Exam 1
5.0(1)
Studied by 1 personCard Sorting
1/58
Earn XP
Description and Tags
Last updated 9:08 PM on 2/12/23
Name | Mastery | Learn | Test | Matching | Spaced | Call with Kai |
|---|
No analytics yet
Send a link to your students to track their progress
59 Terms
1
New cards
the importance of statistics in evidence-based practice
* Formulating a well-thought question
* Identify evidence-based resources that help answer that question
* Critically appraise the evidence to assess its validity
* Applying the evidence
* Re-evaluate the application of evidence and areas for improvement
* Identify evidence-based resources that help answer that question
* Critically appraise the evidence to assess its validity
* Applying the evidence
* Re-evaluate the application of evidence and areas for improvement
2
New cards
sections that make up a journal article
abstract, introduction (background and hypotheses), methods, results, discussion,
3
New cards
abstract
Brief summary of the article at beginning
– Usually contains fewer than 150 words
Provides an overview of the study’s purpose, methods, and findings
– Usually contains fewer than 150 words
Provides an overview of the study’s purpose, methods, and findings
4
New cards
introduction
background
* Statement of Purpose: Why did the author conduct the study?
* Review of Literature most relevant for the presented study
* What is the goal of the study?
\
Hypotheses
* Sometimes explicitly stated
* Other times must be inferred from text
* Statement of Purpose: Why did the author conduct the study?
* Review of Literature most relevant for the presented study
* What is the goal of the study?
\
Hypotheses
* Sometimes explicitly stated
* Other times must be inferred from text
5
New cards
methods
How was the study conducted?
Participants/Subjects/Sample: Who was in the Study
* Sample Size
* Selection Methods
Materials: What was used to collect data
* Instruments or Apparatuses used to collect data
* e.g., Questionnaires, Lab Equipment, etc.
\
Procedures: the protocol for data collection
* What did participants do; When and Where was data collected
Data Analysis Plan: Once data is collected how will the researchers analyze it to come up with their findings; Results not reported here
\
Generally, this presents the Statistical Methods used
6
New cards
results
Overview of the results obtained from analyses
\
Information can be in text, table, or graphical form
\
Statistical information relaying findings regarding research questions
\
Information can be in text, table, or graphical form
\
Statistical information relaying findings regarding research questions
7
New cards
discussion
Authors’ conclusions, understanding, or interpretation of the findings
\
Interprets results section in the context of the purpose of the study
The author will sometimes provide reasoning about the findings
\
Limitations of the study are discussed as well as potential future research
\
Where one is most likely to find the relevance of research findings to practice may be referred to as Implications for Practice
\
Interprets results section in the context of the purpose of the study
The author will sometimes provide reasoning about the findings
\
Limitations of the study are discussed as well as potential future research
\
Where one is most likely to find the relevance of research findings to practice may be referred to as Implications for Practice
8
New cards
discrete
Variable **cannot** take on a Value between Successive Observed Values
Examples: Number of kids in household \\n Type of material used for construction (e.g., wood, brick, etc.)
Examples: Number of kids in household \\n Type of material used for construction (e.g., wood, brick, etc.)
9
New cards
continuous
Variable **can** take on a Value between Successive Observed Values
\
Examples:
Age of an individual
Household income
\
Examples:
Age of an individual
Household income
10
New cards
nominal/categorical
grouping, countable \[ =, ≠\]
\
Bar Graph
\
Bar Graph
11
New cards
ordinal/ranking
direction, comparable \[
12
New cards
interval
equidistant, zero does not mean zero, degree of difference \[+, -\]
\
Using Class Intervals \n Histogram \n Stem-and-Leaf \n
Maintains Individual Values \n Polygon
\
Using Class Intervals \n Histogram \n Stem-and-Leaf \n
Maintains Individual Values \n Polygon
13
New cards
ratio
zero has meaning, magnitude \[\*, /\]
\
Using Class Intervals \n Histogram \n Stem-and-Leaf \n
Maintains Individual Values \n Polygon
\
Using Class Intervals \n Histogram \n Stem-and-Leaf \n
Maintains Individual Values \n Polygon
14
New cards
dependent variable
variable being described
\
variable that is being measured as a result of experiment
\
variable that is being measured as a result of experiment
15
New cards
independent variable
describing variables
\
variable being manipulated in study
\
variable being manipulated in study
16
New cards
predictor
provides information on an associated dependent variable regarding a particular outcome
17
New cards
covariate
an independent variable that can influence the outcome of a given statistical trial, but which is not of direct interest
18
New cards
population
total set of individuals or items of interest
19
New cards
parameter
measured characteristics of population
20
New cards
sample
a subset of the population taken as representative of population
21
New cards
statistic
measured characteristics of sample
22
New cards
data
collected pieces of information about observations on people, lab samples, etc.
23
New cards
systematic differences
Individual Differences Explained by Group Membership. \n
E.G., In general, Elderly Individuals may require longer recovery time.
E.G., In general, Elderly Individuals may require longer recovery time.
24
New cards
random variation
Within a Group there may be Unexplained Differences between Individuals \n
E.G., Louisa had a recovery time shorter than what is typical for Other Elderly Individuals
E.G., Louisa had a recovery time shorter than what is typical for Other Elderly Individuals
25
New cards
descriptive statistics
Describe a Sample; Summarize, Organize, and Simplify Data \n
Graphical and Numerical representations of sample characteristics
Graphical and Numerical representations of sample characteristics
26
New cards
inferential statistics
Make inferences from a Sample to a Population; Derive generalizations about a Population based on a Sample from that Population \n
Statistical Tests and Levels of Confidence in Estimation of \n Parameters
Statistical Tests and Levels of Confidence in Estimation of \n Parameters
27
New cards
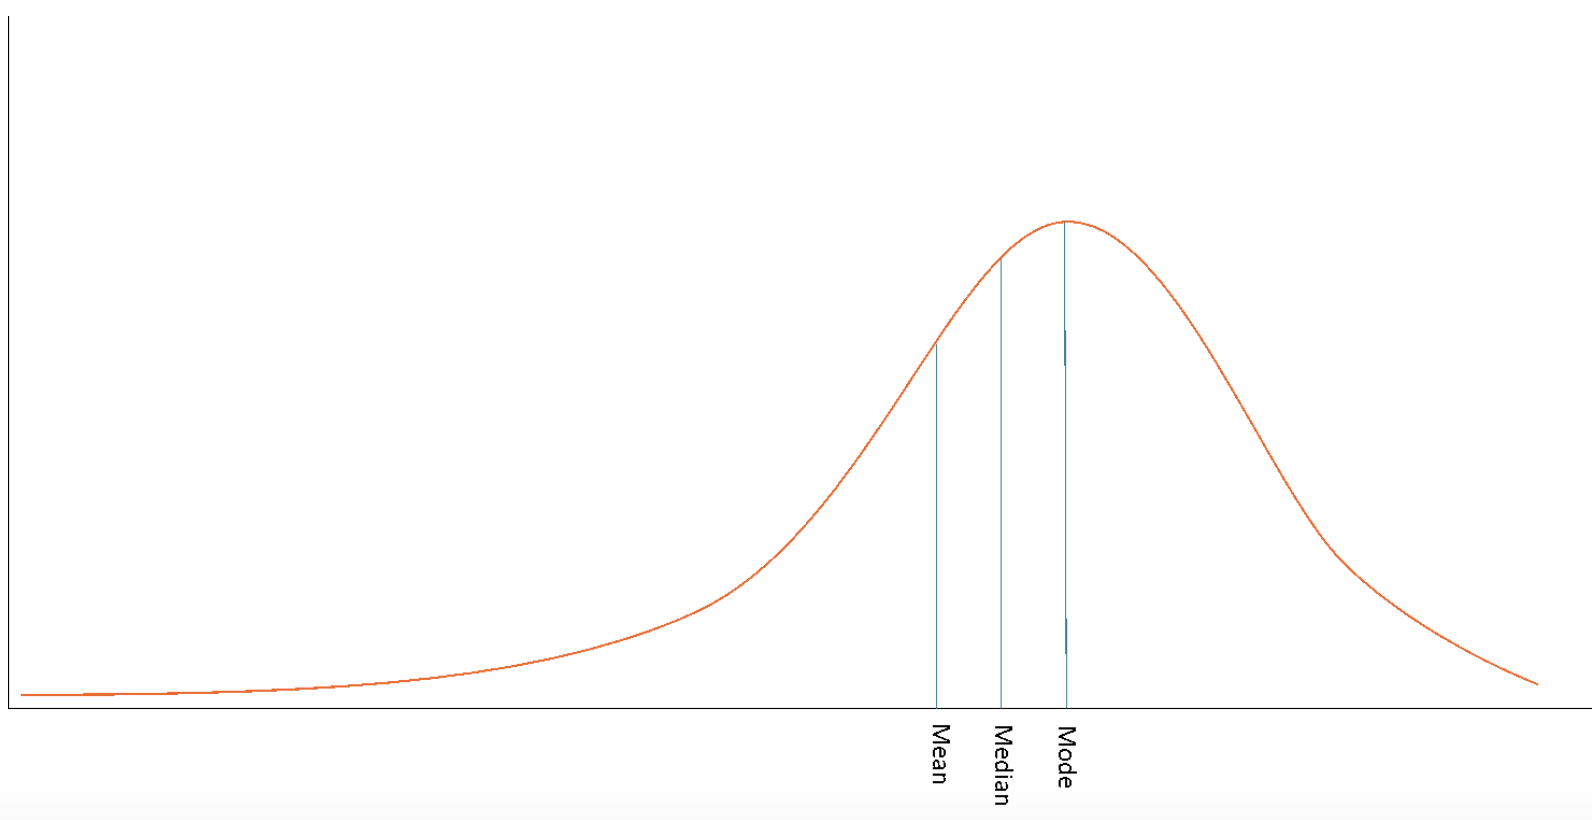
negative skew
most people on higher end of scale
\
mode > median > mean
\
mode > median > mean
28
New cards
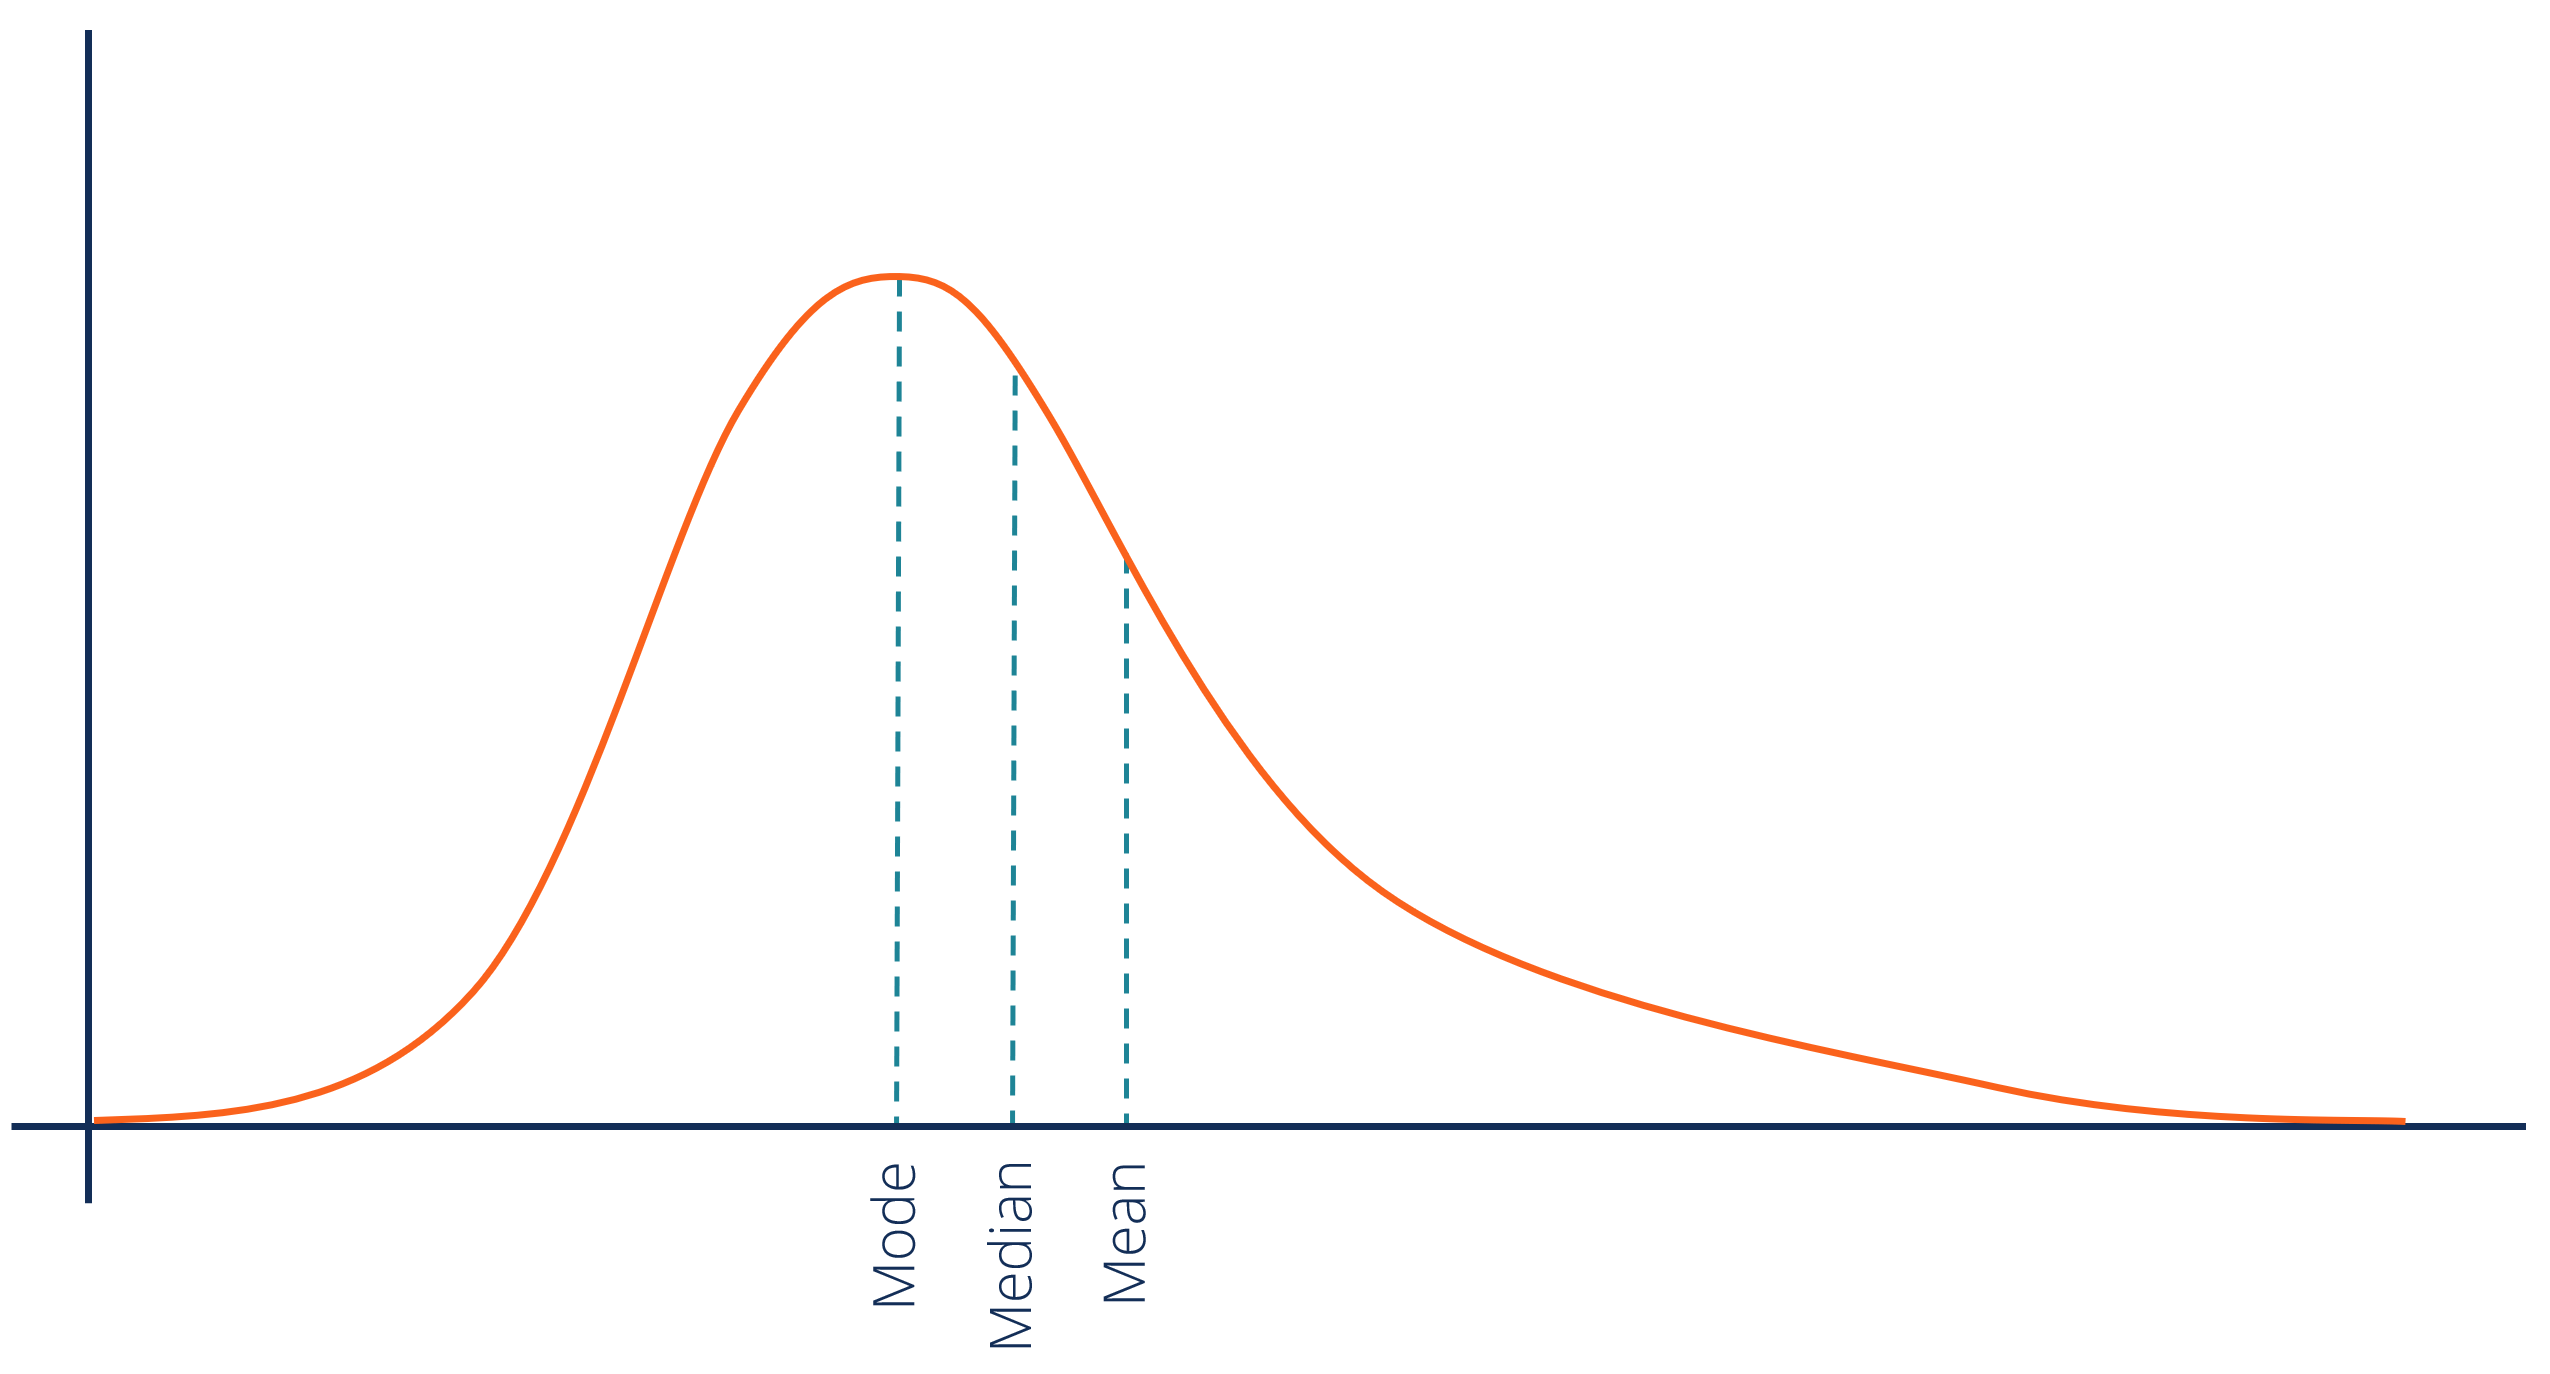
positive skew
most people on lower end of scale
\
mean > median > mode
\
mean > median > mode
29
New cards
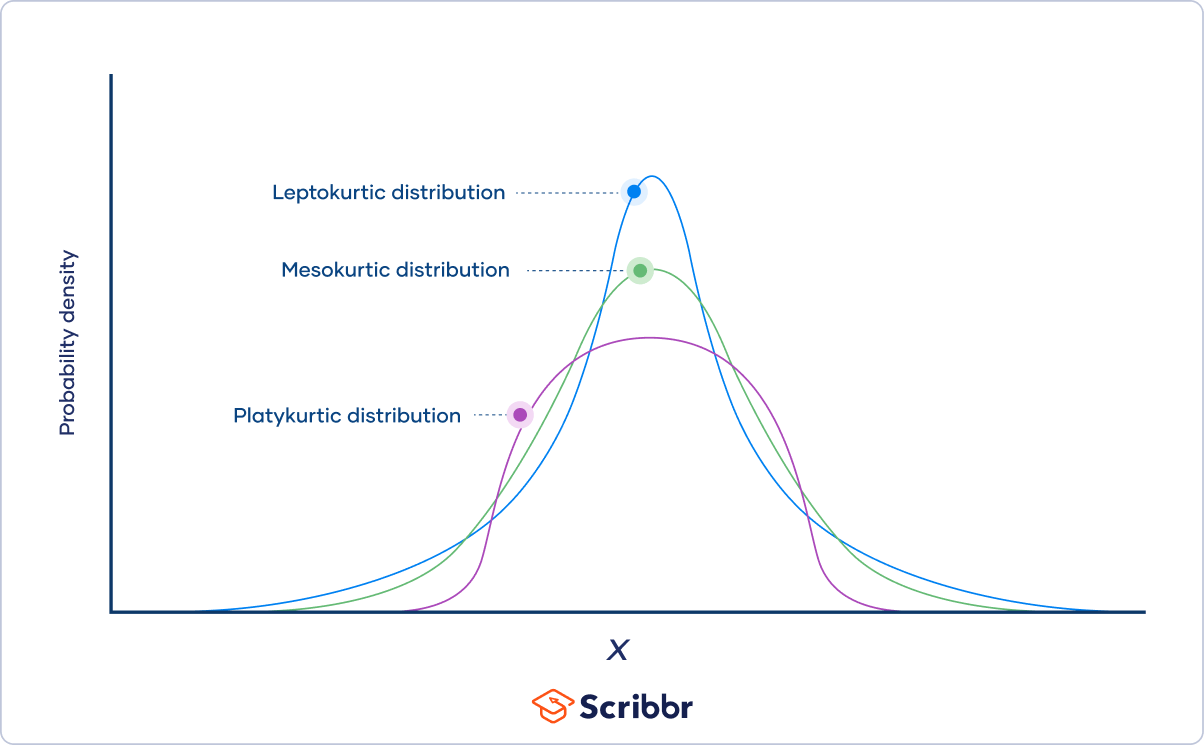
kurtosis
* Peakedness of a distribution
* Positive leptokurtic
* Symmetrical mesokurtic
* Negative platykurtic
* Positive leptokurtic
* Symmetrical mesokurtic
* Negative platykurtic
30
New cards
mean
* Evenly divide the total amount of something amongst everyone in a group
* Can be affected by extreme values (outliers)
* Adding or removing a value will change it unless the value is equal to it
* Adding or subtracting a constant, it will change by that constant
* Multiply or diving by a factor it will also change by that factor
\
not appropriate for nominal variable scales, questionable with ordinal
31
New cards
median
middle value
\
appropriate for ordinal, interval, and ration variable scale
\
appropriate for ordinal, interval, and ration variable scale
32
New cards
mode
most common value
\
appropriate for any variable scale
\
appropriate for any variable scale
33
New cards
z score formula
Z = X - μ / σ
34
New cards
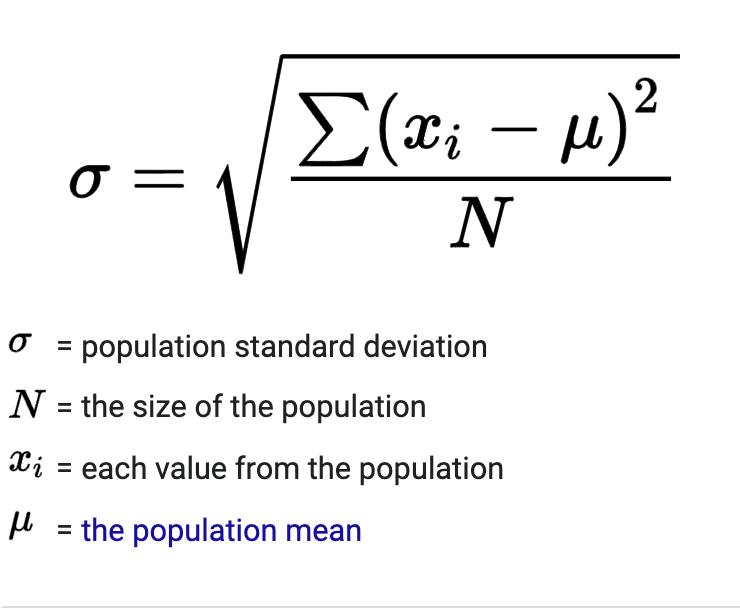
standard deviation formula
35
New cards
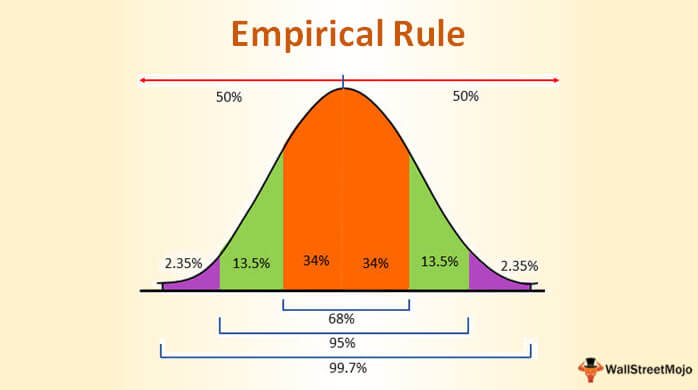
empirical rule
a statistical rule that states that almost all observed data for a normal distribution will fall within three standard deviations (denoted by σ) of the mean or average (denoted by µ)
36
New cards
scatterplot
* Direction of relationship
* Linear relationship is monotonic with constant rate of change
\
Flat
* Changes in one
* No effect on changes in the other
\
Positive
* Both variables change in the same direction
* As X increases, Y increases
\
Negatives
* Variable change in opposite directions
* As X decreases, Y increases and vice versa
\
Can be non-monotonic (move in multiple directions)
* Cannot discern if its positive or negative
37
New cards
strength of relationship in scatterplot
* How much dispersion about a line
* Stronger = more determined
* Stronger correlation when dots are closer to a line
* Stronger = more determined
* Stronger correlation when dots are closer to a line
38
New cards
correlation coefficient
* Often denoted as r
* -1 ≤ r ≤ 1
* The closer to –1 or 1 the straighter the line, and stronger the relationship
* The closer to 0 the weaker the relationship
* R can take on negative, positive, or zero linear directionality
* 0.1 - 0.3 relationship – small correlation
* 0.3 - 0.5 - medium correlation
* 0.5+ - strong correlation
39
New cards
coefficient of determination
* R2 serves as an index measuring the strength (not direction of angle) of the linear relationship (how closely do points follow a straight line)
* If we have r=0.5 then r2 = 0.25 as 25% if the variance between two variables
* R2 does not measure direction of correlation
* If we have r=0.5 then r2 = 0.25 as 25% if the variance between two variables
* R2 does not measure direction of correlation
40
New cards
Spearman rho
* monotonic but non-linear relationships Ordinal, interval, or ratio variables
* Helps when outliers are present
* Helps when outliers are present
41
New cards
Point Biserial
True dichotomy with interval or ratio variable (treatment groups, term class taken, sex, etc.)
\
ex. student type (graduate vs undergrad) and amount of sleep (in hours)
\
ex. student type (graduate vs undergrad) and amount of sleep (in hours)
42
New cards
Biserial
* One artificial dichotomy with interval or ratio variables
* Usually ranked as high or low
* Line represents means of each group
* Usually ranked as high or low
* Line represents means of each group
43
New cards
Tetrachoric
* Two artificial dichotomies
ex. income (high & low) education level (college & less than college)
ex. income (high & low) education level (college & less than college)
44
New cards
Coefficient phi
* With two true dichotomous variables
* Y & N
* Y & N
45
New cards
Cramer’s V
* With two nominal variables (>2 categories)
46
New cards
reliability vs validity
**reliability**
measures consistently and predictably
necessary but not sufficient condition for validity
\
**validity**
how appropriately/accurately a construct is measured
measures consistently and predictably
necessary but not sufficient condition for validity
\
**validity**
how appropriately/accurately a construct is measured
47
New cards
internal consistency
* homogeneity of items within a scale; items on scale work well together
* “Are items on scale doing equally well at measuring a construct”
* Internal consistency is a type of reliability
* \*\*Scale is internally consistent when responses across items provided by individuals are similar thus exhibit correlations with one another & overall scale scores
* “Are items on scale doing equally well at measuring a construct”
* Internal consistency is a type of reliability
* \*\*Scale is internally consistent when responses across items provided by individuals are similar thus exhibit correlations with one another & overall scale scores
48
New cards
alternate forms
* Correlation of scores for the same individuals amongst different versions of the same scale;
* If different forms of instrument are truly measuring the same construct, then we would expect the correlation of the scores to be high
\
why we want them
* Briefer form of a longer scale
* Different forms for a Pre- & Post-test to avoid pretest sensitization (performance upon administration influences performance on next administration perhaps by memorization)
* Prevent Cheating on Tests
49
New cards
test-retest
* if same basic score is expected across measurement occasions (as with traits), correlation of scores across different time points should be high
* Measuring resting heart rate every month, in general should be similar
* Measuring resting heart rate every month, in general should be similar
50
New cards
inter-rater reliability
the extent to which ratings of a phenomena emerging from different judges on the same occasion are in agreement
\
Same scores have high inter-rater reliability
\
Same scores have high inter-rater reliability
51
New cards
intra rater reliability
the extent to which ratings of a phenomena emerging from a single judge across multiple occasions are in agreement
\
intra-rater reliability - How consistent same judge is
\
intra-rater reliability - How consistent same judge is
52
New cards
content of measure
an item asking if an individual has “friends who could help them in a time of need” assesses social support defined as having a network of others upon which they can rely on
53
New cards
response process
* e.g., giving a **higher rating** on an item reflects stronger feeling about the topic expressed in the question
* Scores 1-5 responses
* Scores 1-5 responses
54
New cards
internal structure
* e.g., depression scale has items tapping into each the cognitive, emotional, social, and physical dimensions of depression
* How detailed and if it is reaching every aspect of abstract variables
* How detailed and if it is reaching every aspect of abstract variables
55
New cards
based on other constructs
e.g., college readiness exam scores should be related to other indicators of academic achievement
56
New cards
based on consequences
e.g., would a diagnostic assessment tool erroneously lead to a misdiagnosis which may in turn unnecessarily subject an individual to a risky treatment
57
New cards
content validity
* How well does a measure represent the components of a construct;
* Expert review of how accurately items tap into aspects of a construct & content sampling;
* e.g., if we wanted to assess a person’s Overall Health Well-Being, we may want to sample across health content, such as energy levels, experience of pain, frequency of sickness, etc.
* Expert review of how accurately items tap into aspects of a construct & content sampling;
* e.g., if we wanted to assess a person’s Overall Health Well-Being, we may want to sample across health content, such as energy levels, experience of pain, frequency of sickness, etc.
58
New cards
criterion related validity
* Does a measure have an empirical relationship with various other indicators of a construct;
* Concurrent & predictive
\
Predictive: scores on a college admission test should predict college freshman GPA
* Predicting another outcome based on first one
\
Concurrent: since both SAT and ACT are used for college admissions, then if one scores high on the ACT we would also expect that they score high on SAT
59
New cards
construct valildity
* does a measure behave the way our theory about a construct implies it would;
* Convergent & Divergent
\
Convergent: Stress and Blood Pressure are known to have a positive correlation with one. A researcher checks to see if the scores on their Stress Scale correlate to Blood Pressure Levels.
* If stressed then BP should be higher
\
Divergent: Word problems on a Math Exam are meant to reflect Math Comprehension more so than Reading Ability. To assure this, it was examined whether scores on other measures of Math Comprehension were more strongly correlated with Word Problem scores than to Reading Skill Scores
* If measure stress and height those should not be related