4 - Blood Lactate
1/32
There's no tags or description
Looks like no tags are added yet.
Name | Mastery | Learn | Test | Matching | Spaced | Call with Kai |
|---|
No study sessions yet.
33 Terms
Summary of Bla
Glycolysis
Carbs - 2x ATP
Fat - 3x ATP
Lactate - not independently produced in hypoxia (depends on rate of energy demand)
Lactate reflective of fatigue mechanisms
H+ causes decrease in: pH, ADP, Pi
Reflects elevated glycogen utilisation/depletion
Hypoxia
When the body’s tissues are deprived of adequate o2
BLa as ‘GOOD’
Exercise for longer - extra supply to be oxidised and fuel
Lactate conversion produces NAD - glycolysis to continue
Acts as a buffer
BLa as ‘BAD’
Increases acidic byproducts
(lactate itself not awful, but the acidosis alongside it)
Acidosis
too much acid in the body’s fluids causing a low pH
Lactate
Produced when cells break down glucose for energy (base of lactic acid)
Only measurable thing, not lactic acid
Can be an energy source - transported to liver and, converted back to glucose
Traditional view of Acidosis in High Intensity Exercise
Glucose has 6 Carbon molecules — split in 3 (pyruvate) (end of anaerobic portion of glycolysis)
Low enough rate for an oxidative process
Pyruvate becomes acetyl coenzyme A
Goes into Krebbs cycle
High enough rate (no O2)
Pyruvate becomes lactate (Fermentation)
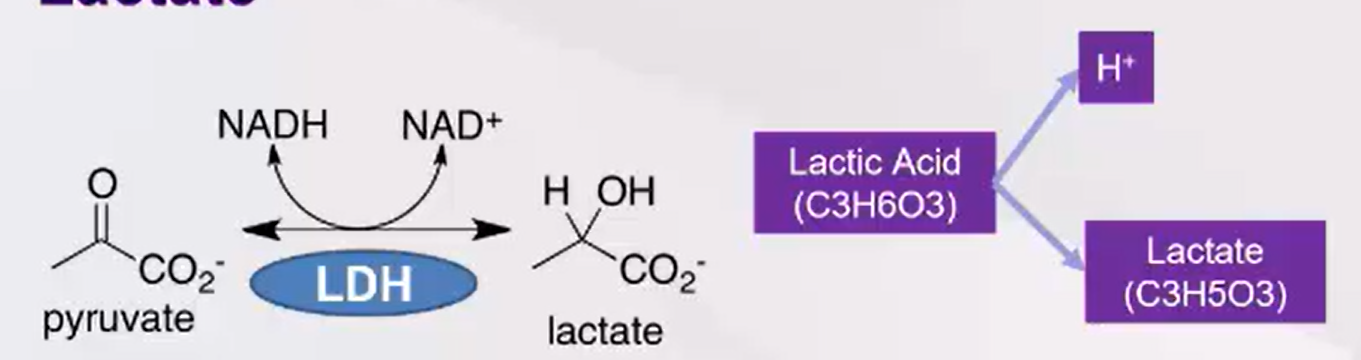
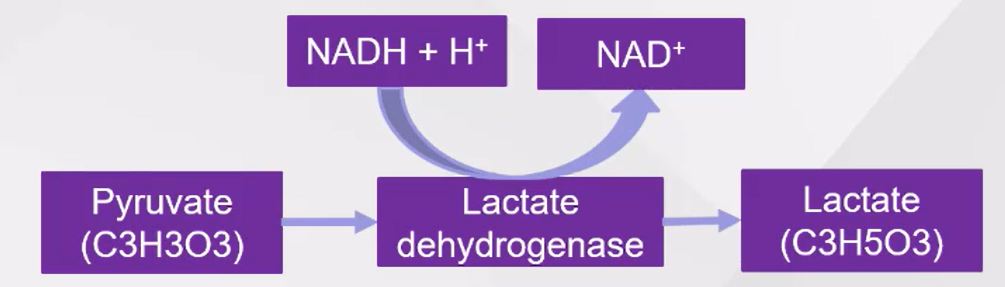
End of Pyruvate conversion - LDH (Lactate Dehydrogenase)
Enzyme that manages reversible reaction between lactate and pyruvate
End result = H+ , Lactate produced
X Increases acidity
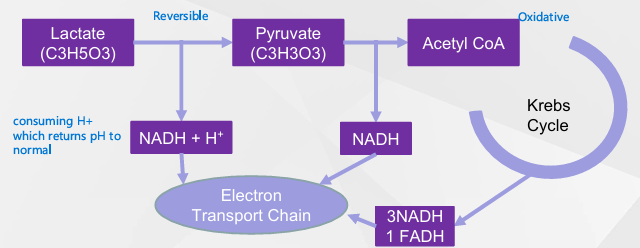
Recent View of Acidosis in High Intensity Exercise - Lactate Prevents Greater Levels of Acidosis?
Robergs, Ghiasvand and Parker, 2004
LDH results in immediate lactate production
LDH does conversion which is reversible
Lactate can go back to pyruvate
Recycling of NADH to NAD
Only measurable thing is lactate
If this is true, some hydrogen ions are being consumed which helps to buffer acidity levels to slow conversion of lactate stopping acidosis (LACTATE BENEFICIAL)
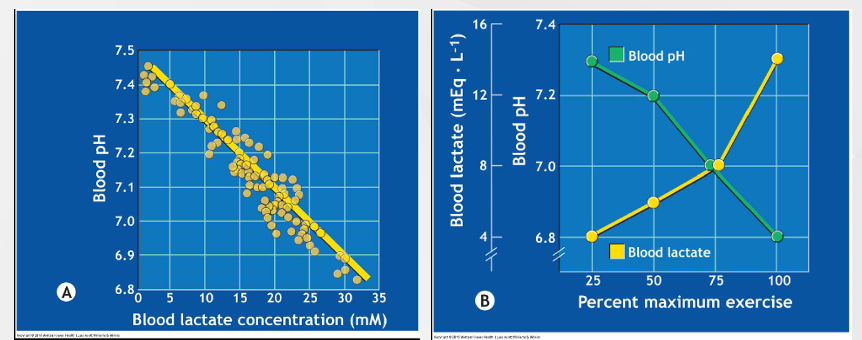
Lactate and pH
First Graph
Direct relationship between BLa and pH
Things that give away Hydrogen are acid
More acidic, Higher BLa concentration, Lower pH
Second Graph
Measured P’s BLa - can assume acidosis is occuring
Process by which we clear lactate from body also consumes H+ - brings pH back up
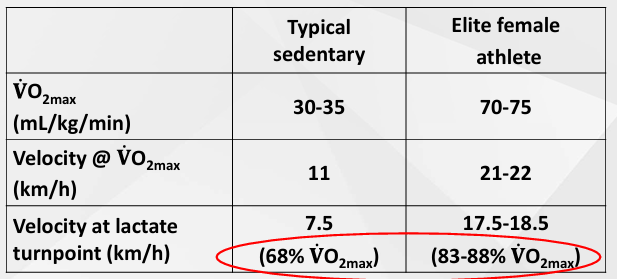
What Determines Blood Lactate Concentration
At rest BLa = 1-1.5 mmol per litre
Liver > Cori cycle > Turn lactate into glucose to be stored
Lactate metabolised in brain tissue - protect
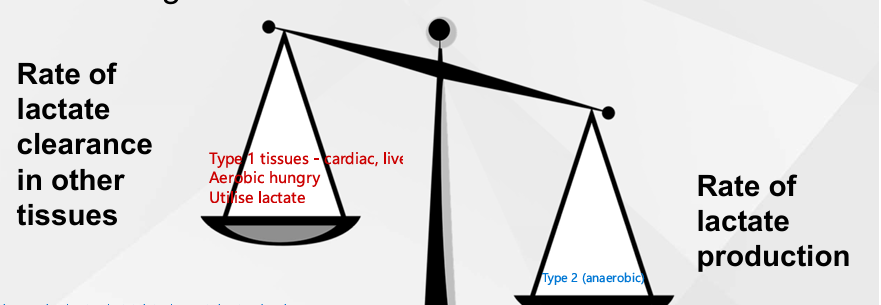
Lactate Production and Removal
Light intensity - some lactate produced, most cleared
Higher intensity - more lactate, more build up
High intensity - rate of clearence can't keep up so lactate builds up
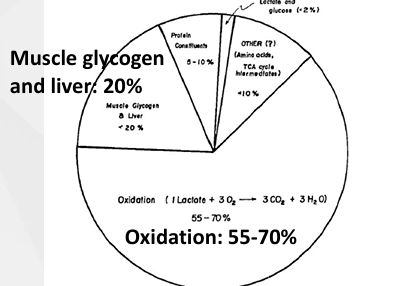
Sites of BLa Removal
Most oxidised in working muscles
Liver/Kidney = 20-25% (cori cycle produces new molecules of glucose)
Cardiac muscle = 10% (oxidised)
Muscle as a Consumer of Lactate
Lactate shuttling
Only 50% of produced lactate appears in vascular bed
Lactate produced by fast twitch fibres oxidised in slow twitch fibres (diffusion)
Shuttling through vasculature: Reperfusion of heart and active muscle
Lactate produced in T2 fibres
Shuttled to adjacent T1 fibres in same muscle
Gets utilised as a fuel source so never makes it into blood
Lag = lactate that does make it into blood takes time (lactate still increases after stopping maximal exercise)

Lactate as a Fuel
• As such, moving the lactate within the muscle fibre and utilising is beneficial
• Moving to other muscles working aerobically (or not involved in the exercise) is beneficial
• Moving to liver for gluconeogenesis may be beneficial
Lactate isn’t a Waste Product : Cori Cycle
Gluconeogenesis in liver
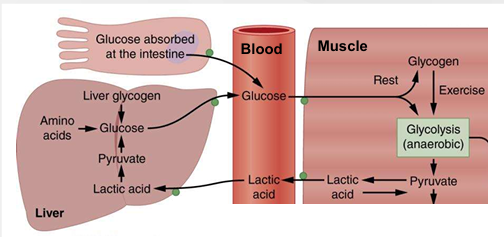
Glucogenesis
Creating new glucose
Why Measure in BLa
How much T2 have contributed
Predict endurance performance
Indicate submaximal fitness - exercise prescription, monitoring, training intensity
BLa exceeds certain con in steady state = exercise duration becomes finite
Change in pH becomes problematic
Low pH limits pfk - stops glycolysis
High BLa = working through glucose stores at high rate
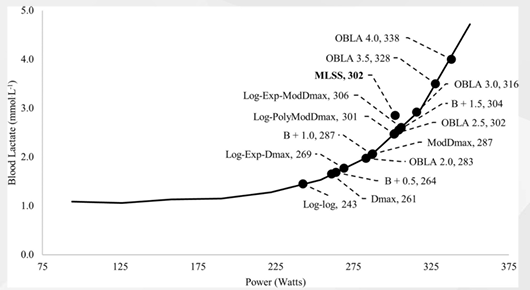
Determination of Lactate Thresholds
25 different thresholds
Lactate Thresholds
0.2 mmol/L above resting concentration
0.5 mmol/L above resting concentration
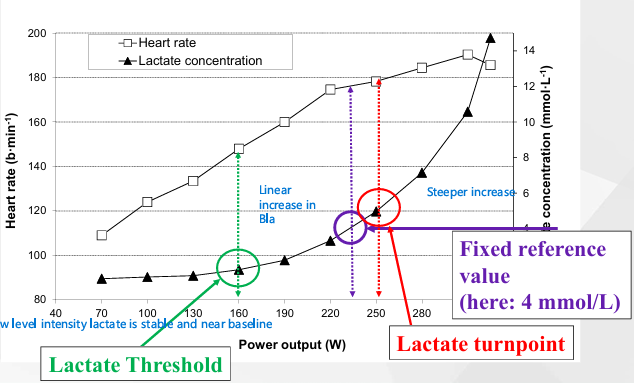
first significant elevation of lactate level (approximately 2 mmol/L)
Lactate Turnpoint
The second lactate increase of at least 0.5 mmol/L from the previous value (in a step test protocol)
D mod : Maximal distance from BLa curve to the line formed by the point before the first rise in BLa and the value at cessation of exercise (see lab book for details)
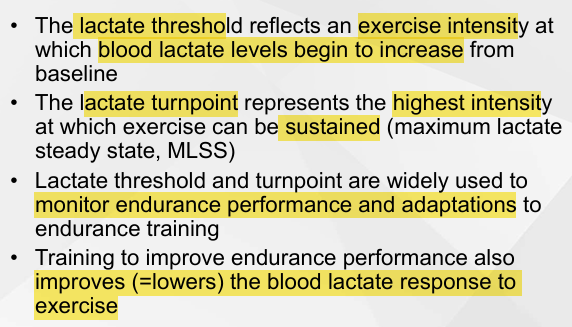
Lactate Threshold
the point during exercise at which the body starts producing more Lactate than it can clear — so lactate (and associated hydrogen ions) begin to accumulate in the blood
Lactate Turnpoint
a point during increasing exercise intensity where blood lactate concentration begins to rise suddenly and steeply, meaning the body is producing lactate faster than it can clear it.
Determination of Lactate Thresholds
Dmod
Draw a line from where lactate starts to increase to the maximal point
Max distance between that line and curve is 2nd threshold
Lactate Threshold vs Lactate Turnpoint
Low level intensity - lactate is stable and near baseline
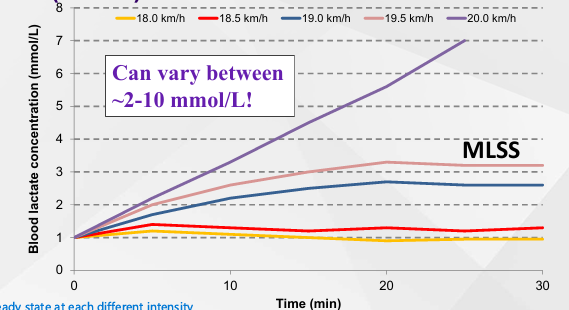
Maximum Lactate Steady State (MLSS/MLaSS)
The highest blood lactate concentration that can be maintained over time without a continual blood lactate accumulation (the highest speed that can be maintained with lactate levels at a constant state)
If we go above lactate turnpoint, even if we stop increasing intensity, lactate doesn't achieve steady state, it keeps climbing
Determine lactate turnpoint, we estimate MLSS (estimate lactate steady state)
Can be done in 1 test (Incremental step test)
Determining MLSS
Perform steady state at each different intensity (speeds)
All eventually reach steady state until highest intensity
Important Points
Lactate Turnpoint/MLSS is NOT the point where metabolism ‘switches’ aerobic to anaerobic
Aerobic + Anaerobic always occur concomitantly (even at low some anaerobic)
At intensities higher than the lactate turnpoint / MLSS, anaerobic processes lead to a gradual build-up of H + and other metabolic products in muscle, ultimately leading to fatigue
Training Zones : Exercise Domains
Low intensity
Moderate
Severe (Domain)
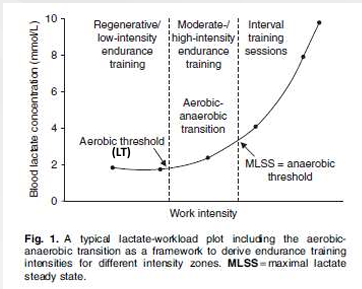
Low Intensity Domain
Below the LT:
BLa < ~2 mmol/L;
< ~ 70 % O2max
Moderate Domain
Between the LT and MLSS
BLa elevated but stable at ~2 to 8 mmol/L;
~ 70-90 % O2max
Severe Domain (Interval)
Above the MLSS
BLa > ~2-8 mmol/L;
> ~ 90 % O2max
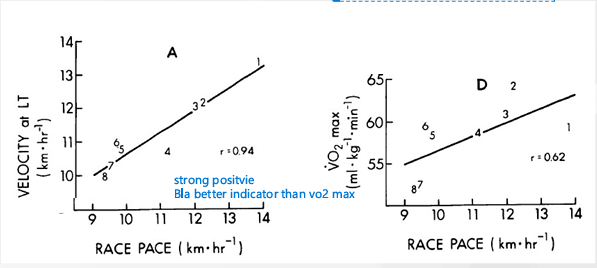
Lactate threshold as a predictor of endurance performance: 20-km race walking
A
Strong positive
BLa better indicator than VO2 Max
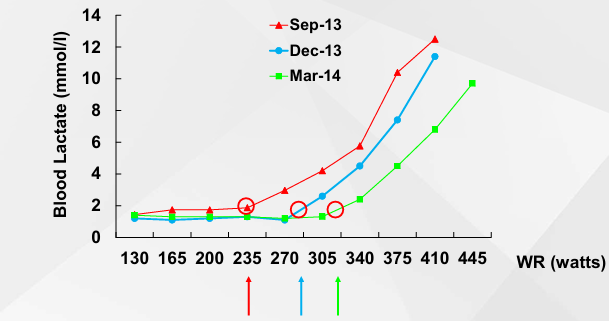
Adaptations can shift curve to right
Thresholds occur at higher intensities
Can work harder
Lactate turnpoint and training status
Using the lactate threshold to evaluate the effectiveness of an endurance training programme
Curve shifts to the right
Lactate curve moves with threshold
Summary