Chapter 23- Conservation Biology
1/153
There's no tags or description
Looks like no tags are added yet.
Name | Mastery | Learn | Test | Matching | Spaced |
|---|
No study sessions yet.
154 Terms
Q: What is conservation biology?
A: It is the scientific study of biodiversity (genetic, species, and landscape diversity), the human impacts on it, and how to maintain or prevent its loss.
Q: What disciplines contribute to conservation biology besides ecology?
A: Law, economics, political science, communications, sociology, and collaboration with stakeholders like landowners, farmers, military, and business.
Q: Why is biodiversity important from a practical perspective?
A: It supports ecosystem services like food, medicine, water purification, pollination, soil formation, and climate regulation.
Q: What is the role of stakeholders in conservation biology?
A: Working with diverse interest groups is essential for successful management and restoration of ecosystems
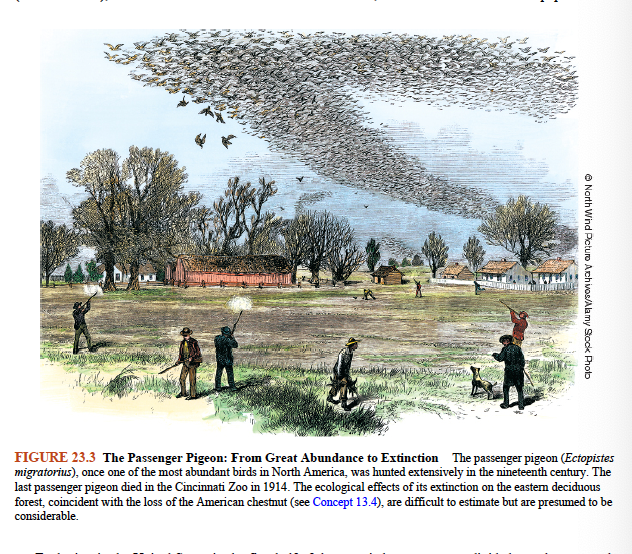
Q: What is Figure 23.3 about and what does it illustrate?
A: It shows the extinction of the passenger pigeon, once North America's most abundant bird, with the last dying in 1914. It emphasizes how human exploitation can quickly eliminate even common species.
Q: What ecological consequences followed the extinction of the passenger pigeon?
A: Although hard to estimate, the loss likely had significant effects on the eastern deciduous forest, especially coinciding with the loss of the American chestnut.
Q: What major shift happened in ecological advocacy in 1948?
A: The Ecological Society of America separated science from advocacy, leading to the formation of The Nature Conservancy for hands-on conservation work.
Q: What organization was formed in 1985 in response to the biodiversity crisis?
A: The Society for Conservation Biology, which formalized conservation biology as a scientific discipline.
Q: How did conservation biology emerge as a formal discipline?
A: Through the rise of biodiversity threats in the 1980s, leading to journals, academic programs, and a unifying effort to apply ecological science to real-world species and ecosystem preservation.
Q: What is meant by saying conservation biology is a “value-based” discipline?
A: It means the field is guided by ethical and social values aimed at preserving biodiversity, in addition to being grounded in scientific methods.
How does conservation biology differ from traditional “pure” science?
A: It is often described as “mission-driven” and “crisis-oriented”, acknowledging a sense of urgency and purpose beyond detached observation.
Q: Who described conservation biology as “mission driven” and “crisis oriented”?
A: These terms were introduced by Soulé and Wilcox (1980) and Soulé (1985), reflecting the field’s proactive and urgent approach.
Why did Dan Janzen shift his research focus?
A: Because he recognized the need to actively protect the tropical ecosystems he studied in order to continue meaningful scientific work there.
Q: Who was Alwyn Gentry, and what was his contribution to conservation biology?
A: Gentry was a tropical botanist who specialized in identifying and classifying plant species in Central and South America, and documented rapid biodiversity loss due to deforestation.
Q: What did Gentry frequently witness during his fieldwork in Ecuador and Peru?
A: He often found newly discovered endemic plant species—only to return a few years later and find the forest cleared and the species gone.
Q: What is an endemic species?
A: A species that is found only in a specific geographic region and nowhere else in the world.
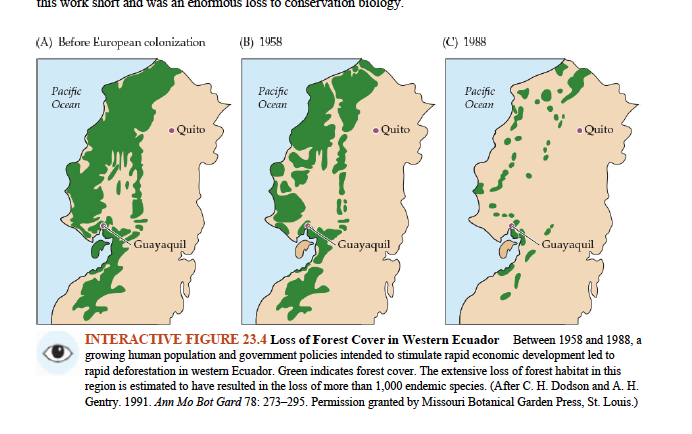
Q: What does Interactive Figure 23.4 illustrate?
A: The dramatic loss of forest cover in western Ecuador between 1958 and 1988, and the associated estimated loss of over 1,000 endemic species.
What broader issue does Gentry’s experience reflect in the tropics?
A: The ongoing extinction of plant and animal species—often before they are even discovered or described—due to habitat loss, disease, and climate change.
Q: Despite growing efforts to explore and catalog Earth’s biodiversity, what challenge persists?
A: The rate of biodiversity loss is keeping pace with, or even exceeding, the rate of new species discoveries
Why is it difficult to determine how rapidly species are being lost?
A: Because we don’t know the exact number of species that exist, especially among microorganisms, and many are undiscovered or poorly studied.
What is the “background” extinction rate based on fossil records?
A: About one extinction every 200 years for mammals and birds, or an average species lifespan of 1–10 million years.
How does the 20th-century extinction rate for mammals and birds compare to the background rate?
A: It was 100 to 1,000 times higher, with about one extinction per year, suggesting a species lifespan of just 10,000 years.
Q: What are four methods used to estimate current extinction rates?
Fossil record comparisons
Species–area relationships
Conservation status changes
Population declines or range contractions
Why is it hard to confirm if a species is extinct?
A: Many are known from a single site or specimen, and remote searches are difficult. Some species reappear years after being declared extinct
Q: How many Hawaiian plant species listed as extinct in 1990 have been rediscovered?
A: 35 species, though most have very small populations and limited ecological function.
Q: What percent of Hawaii’s native flora is now considered extinct?
A: 8% of the 1,342 native species are extinct.
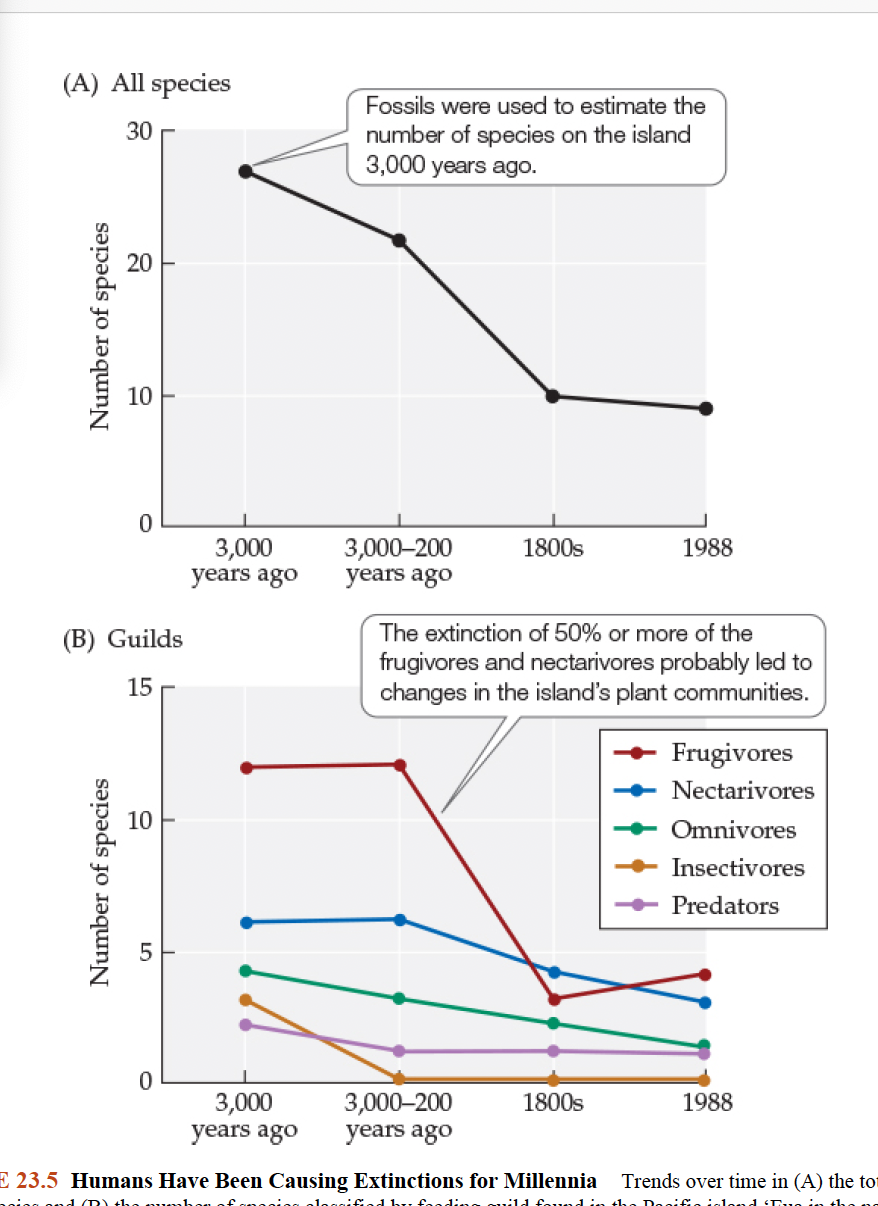
Q: What does Figure 23.5 illustrate?
A: The prehistoric extinction of up to 8,000 bird species—including 2,000 endemic flightless rails—on Pacific islands following Polynesian colonization.
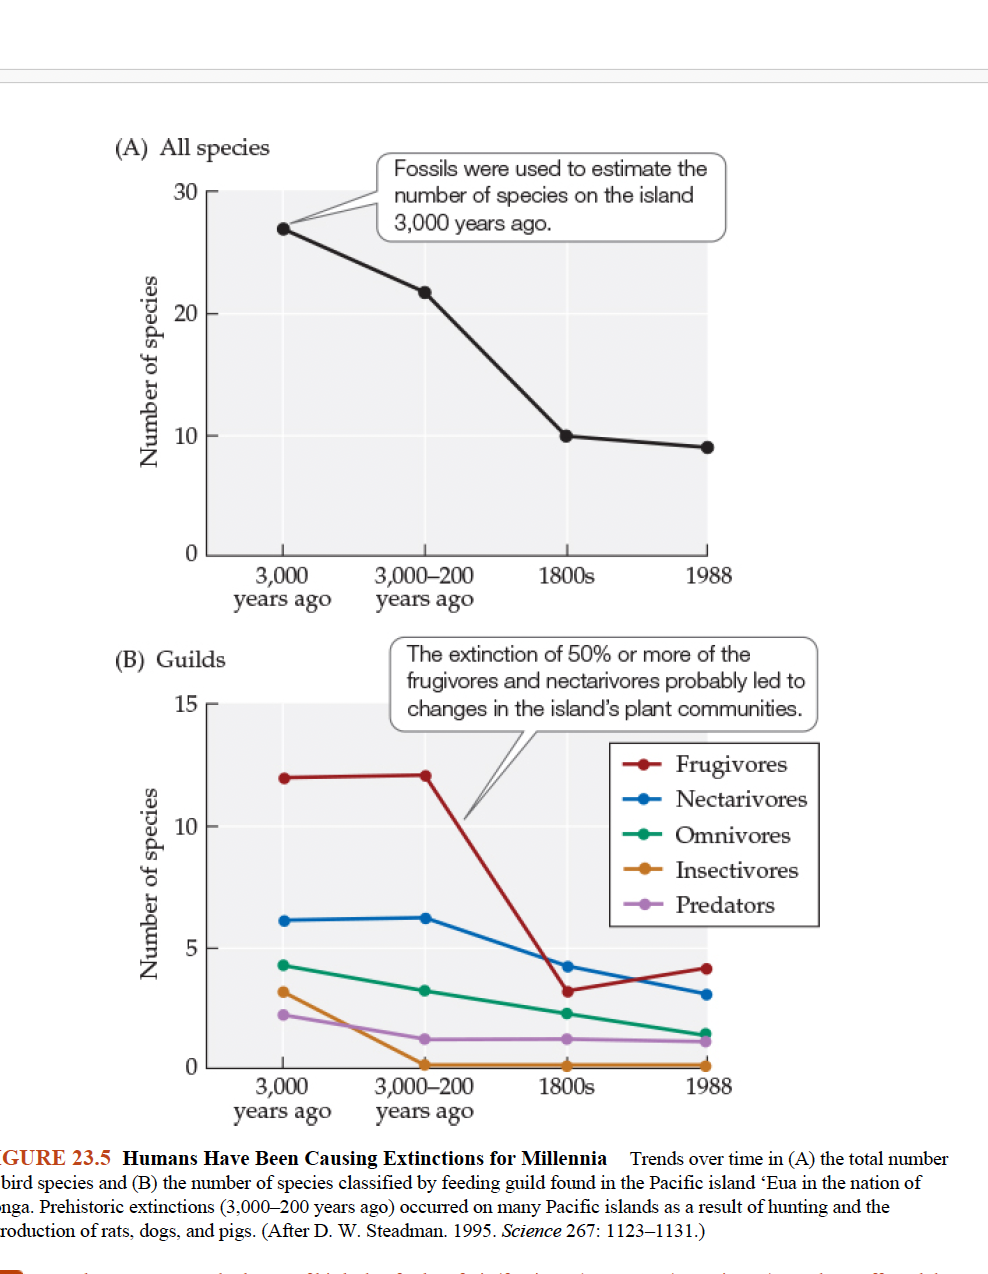
Q: What is the ecological implication of the extinctions shown in Figure 23.5?
A: Entire ecological guilds (e.g., frugivores, nectarivores) were lost, likely disrupting pollination and seed dispersal in endemic tree populations.
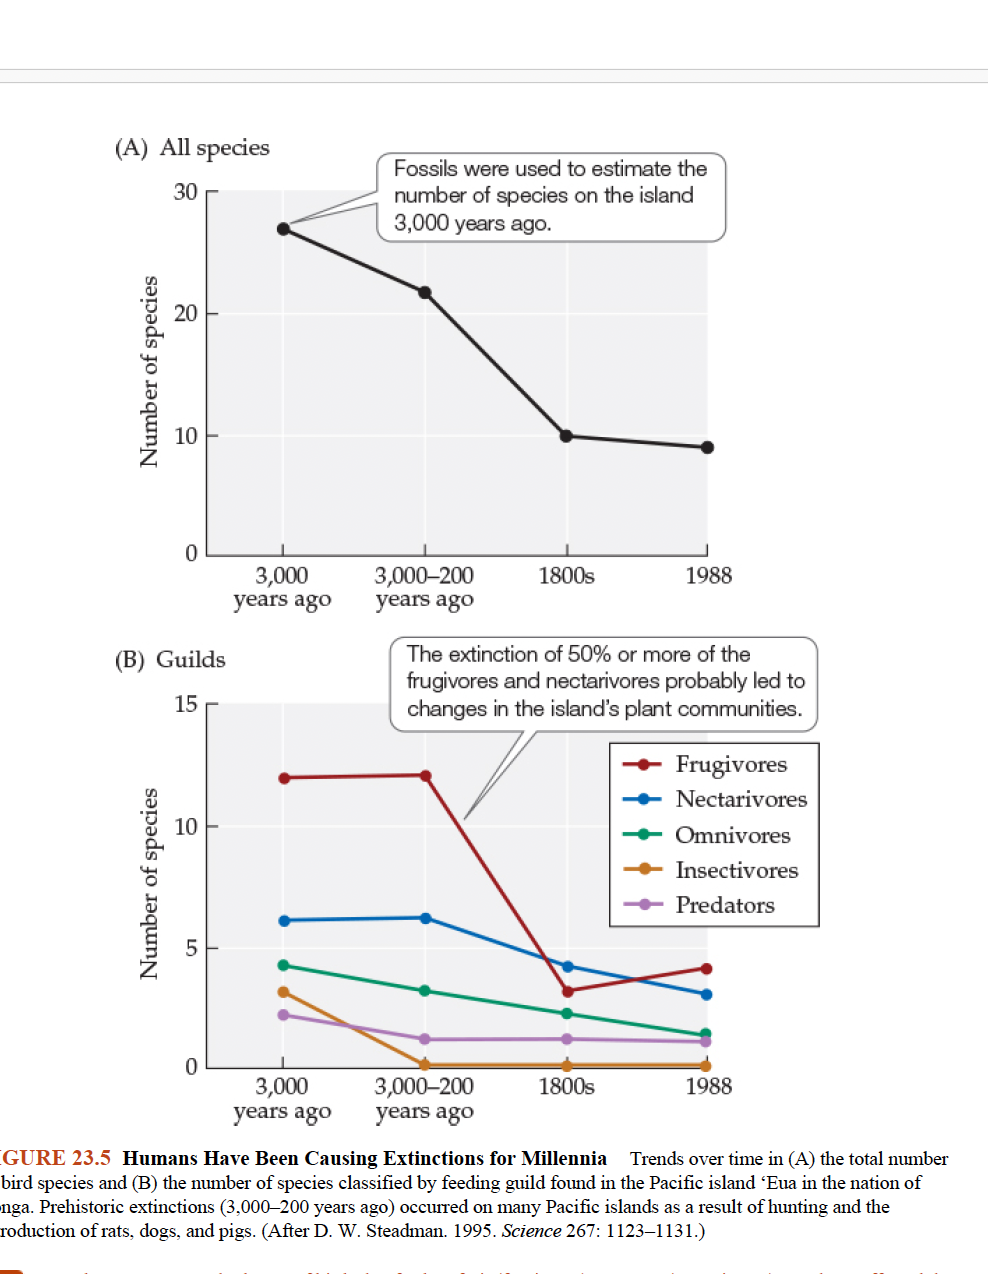
Q: What does Figure 23.5 show about prehistoric bird extinctions in the Pacific Islands?
A: It tracks the decline in total bird species and feeding guilds on ‘Eua (Tonga), showing that hunting and introduced species (rats, pigs, dogs) led to major extinctions, especially of frugivores and nectarivores
Q: What is the extinction vortex concept?
A: It describes how small populations face compounding risks (genetic drift, environmental fluctuations, etc.), leading to further declines and eventual extinction.
What did Ceballos and Ehrlich (2002) find about mammal species’ range contractions?
A: 173 declining mammal species lost 68% of their range, with Asia seeing 83% of the highest contractions.
Q: What did Channell and Lomolino (2000) observe about species range declines?
A: Many declines moved like a wave from one edge of a range to the other, rather than shrinking inward evenly—suggesting directional pressures like invasive species.
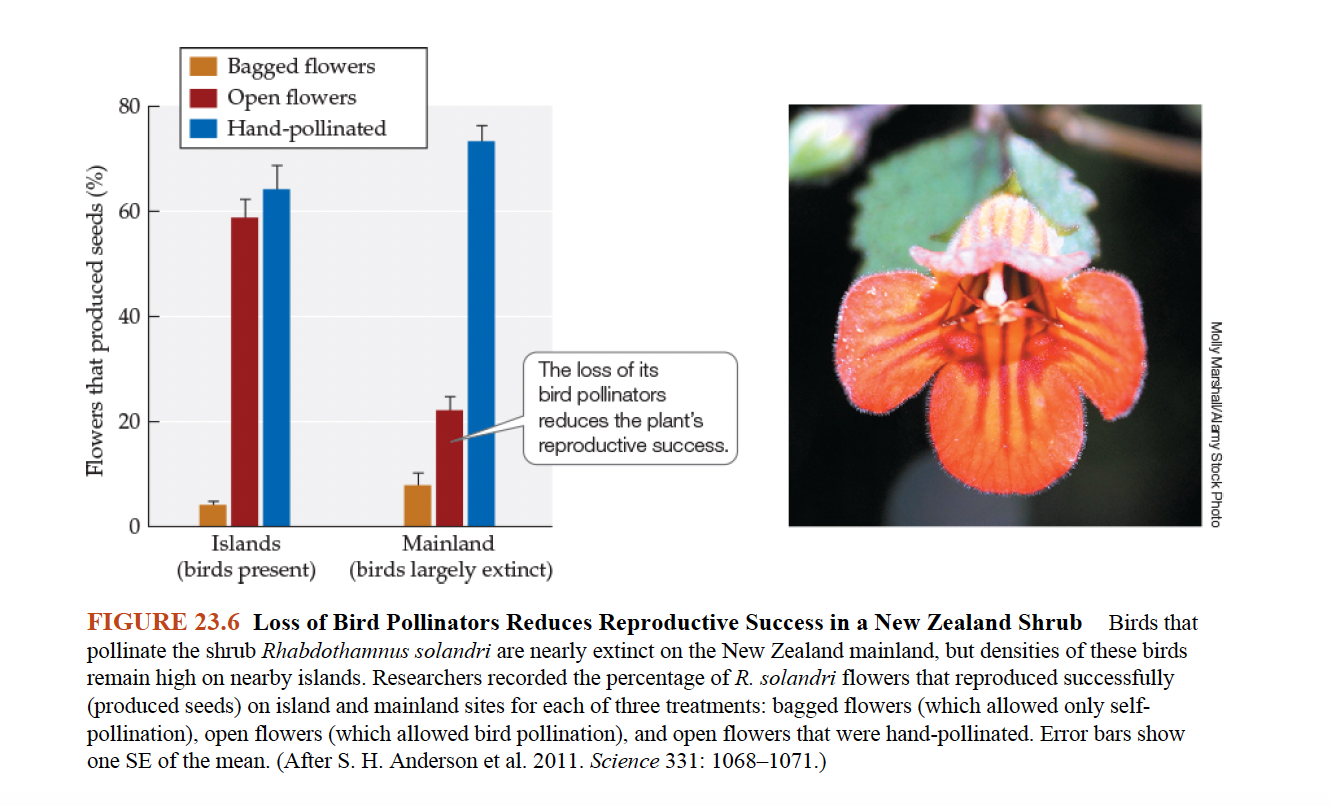
Q: What does Figure 23.6 reveal about bird pollinator loss in New Zealand?
A: Rhabdothamnus solandri shrubs had the highest seed set on islands with birds. Mainland flowers had lower success unless hand-pollinated, showing bird pollinators are essential.
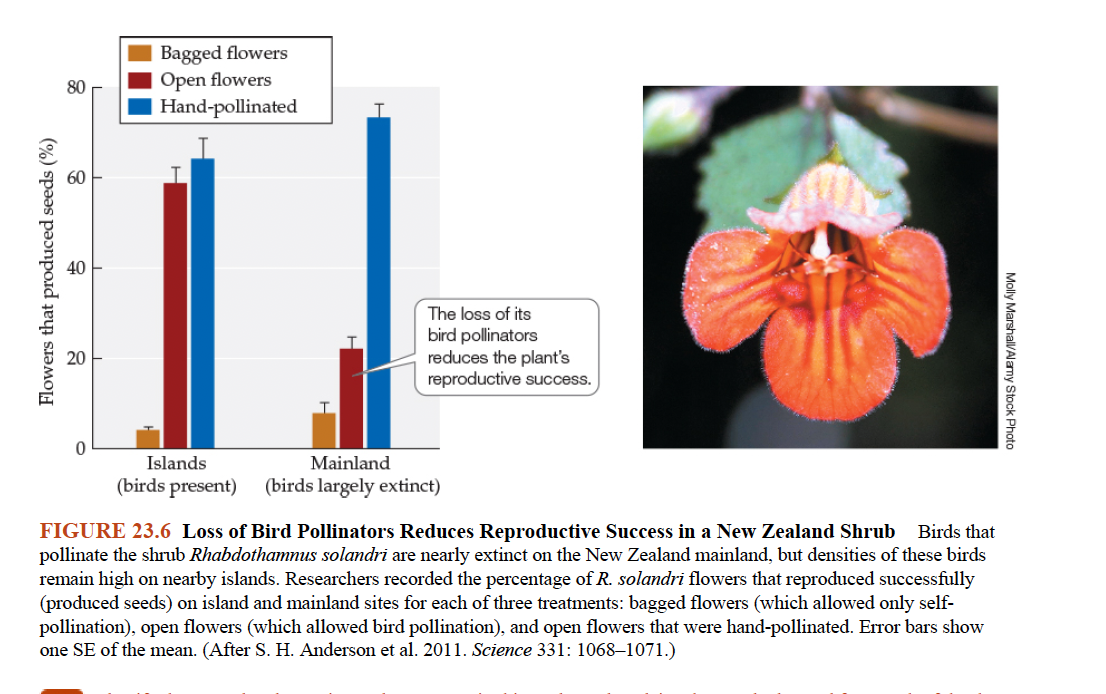
Q: What were the experimental treatments in Figure 23.6?
A:
Bagged flowers: self-pollination control
Open flowers: test of natural bird pollination
Hand-pollinated: maximum reproductive potential
The control was the bagged group; the bird-pollinated and hand-pollinated groups tested the pollination effectiveness.
Q: What is meant by Earth’s biota becoming “homogenized”?
A: The spread of non-native generalists and the decline of native specialists are making species compositions more similar across regions.
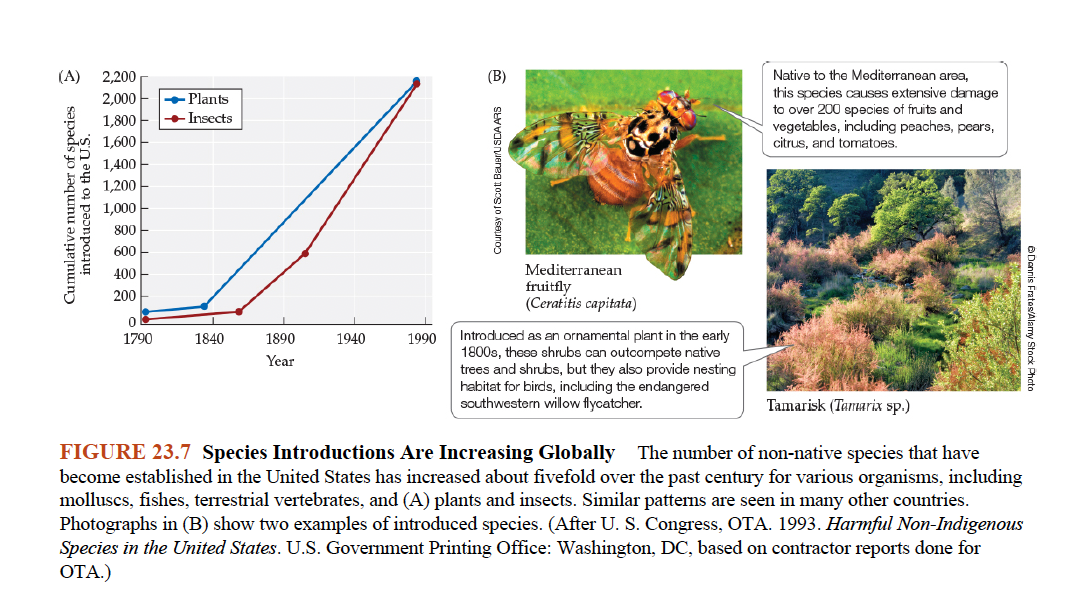
Q: What does Figure 23.7 show about species introductions?
A: The number of non-native species in the U.S. (plants, insects, fish, etc.) has increased fivefold over the past century.
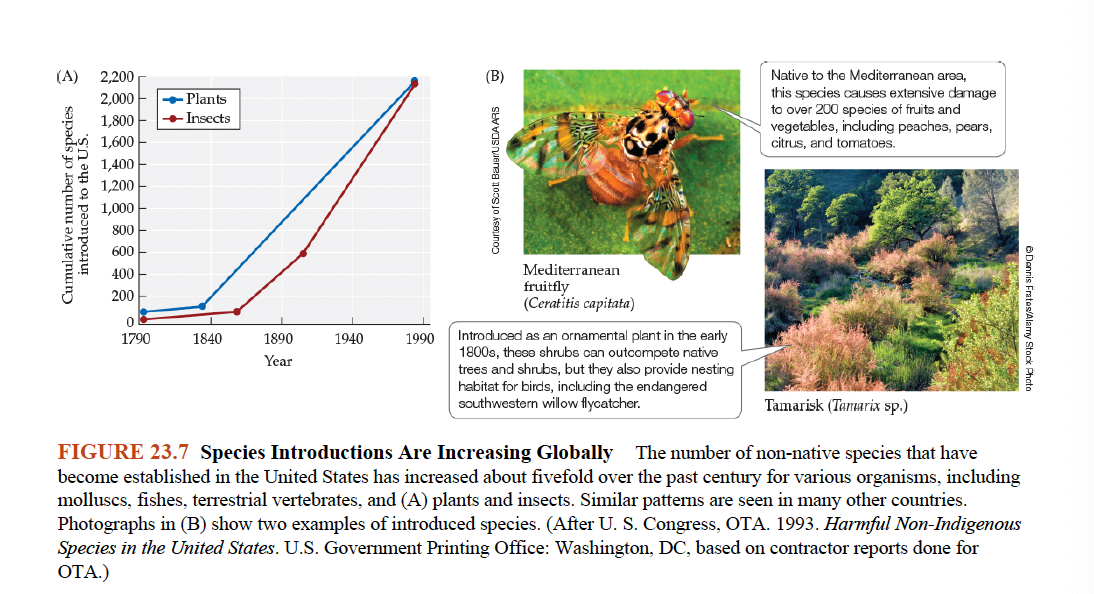
Q: What do the photos in Figure 23.7 illustrate?
A: They show examples of introduced species that can disrupt native ecosystems, highlighting the broader problem of biological invasions.
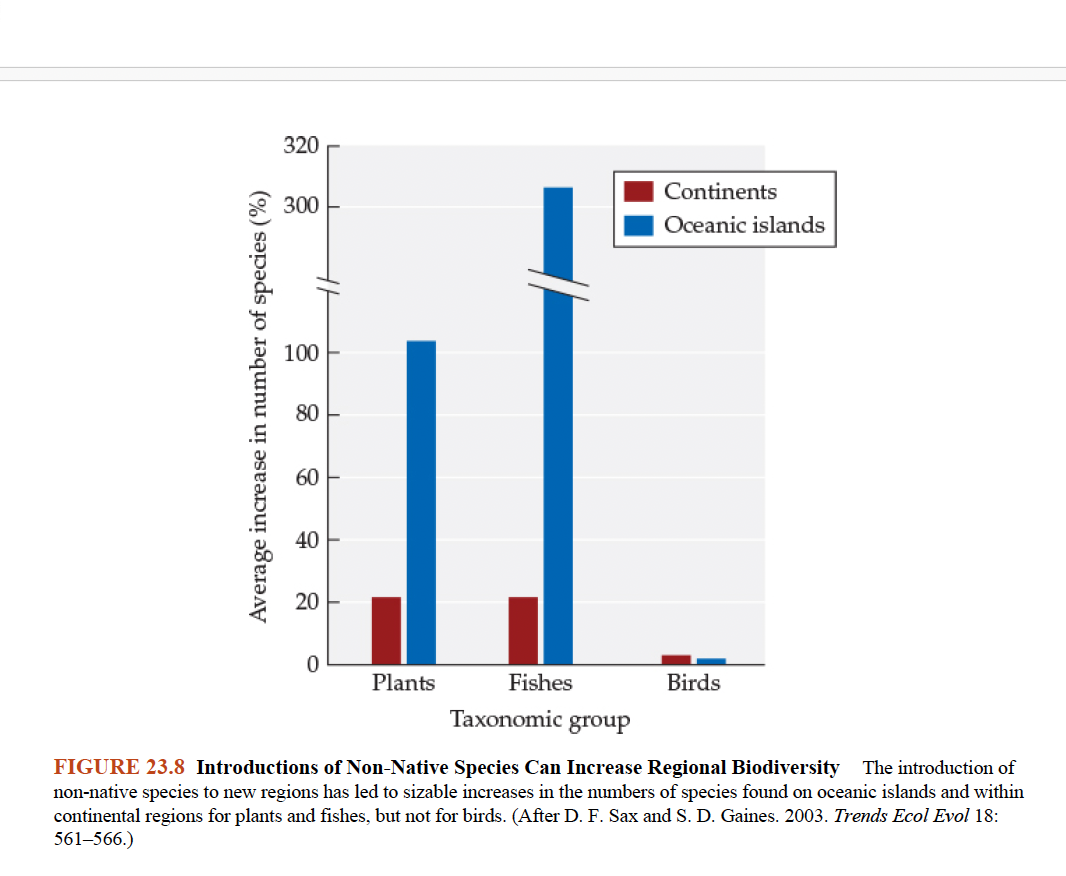
Q: What does Figure 23.8 demonstrate about non-native species and biodiversity?
A: While regional diversity increases (e.g., on islands), this comes at the cost of global diversity, as native species are outcompeted and lost.
Q: How can global plant diversity decline even if regional species counts rise?
A: Widespread non-native species replace locally unique native plants, reducing total global diversity even if local counts go up.
Q: What did Robert Cowie’s survey of American Samoa snails find?
A: Only 19 of 42 native species were found; 12 non-natives made up ~40% of individuals, showing non-natives were thriving while native species declined.
Q: Which invasive predators were contributing to snail declines in Cowie’s study?
A: The predatory snail Euglandina rosea and the house mouse (Mus musculus).
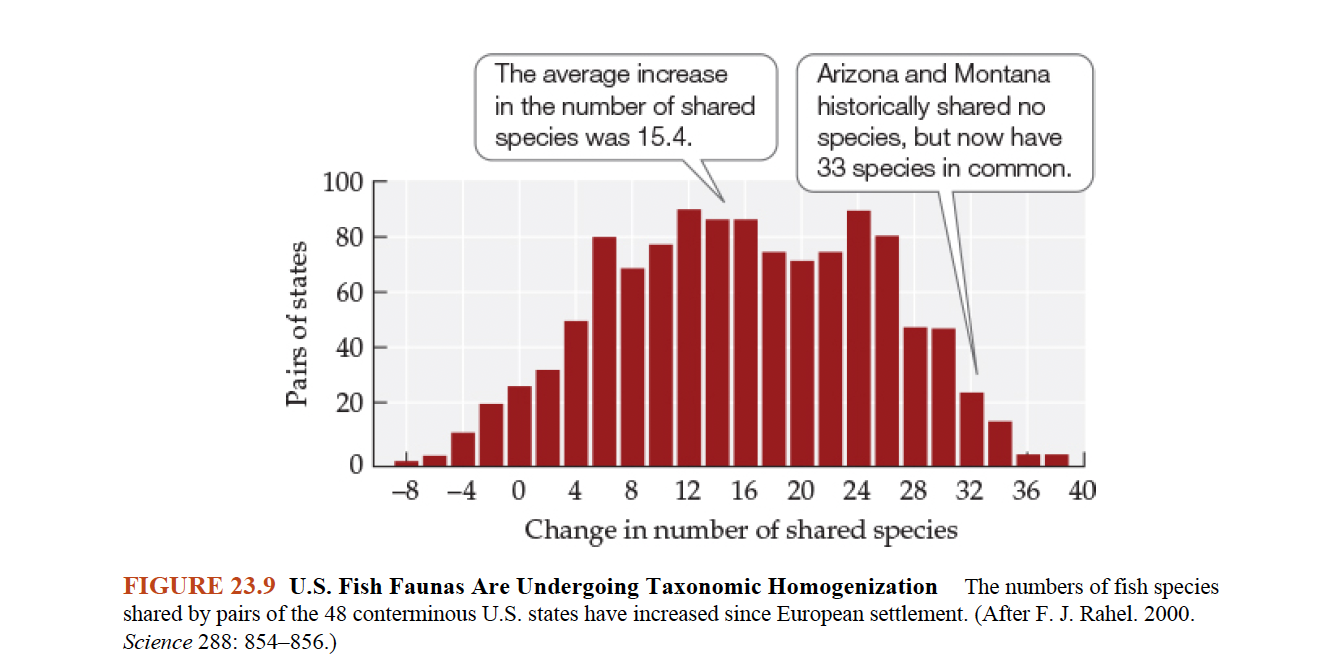
Q: What does Figure 23.9 show about fish communities in the U.S.?
A: There has been increased species overlap across U.S. states due to fish introductions, indicating taxonomic homogenization.
Q: What does taxonomic homogenization mean for conservation?
A: It signals a loss of ecological uniqueness, as widespread generalists replace diverse, specialized native species across ecosystems.
Q: What are the six major threats to biodiversity identified in Concept 23.3?
A: Habitat loss, invasive species, overexploitation, pollution, disease, and climate change
Q: What caused the extinction of the last Pyrenean ibex in 2000, and what led to its decline over time?
A: The last individual died from a falling tree, but long-term decline was due to overexploitation and competition with livestock.
Q: According to Figure 23.10, what are the primary threats to terrestrial mammals?
A: Habitat loss, overexploitation, accidental mortality, and pollution.
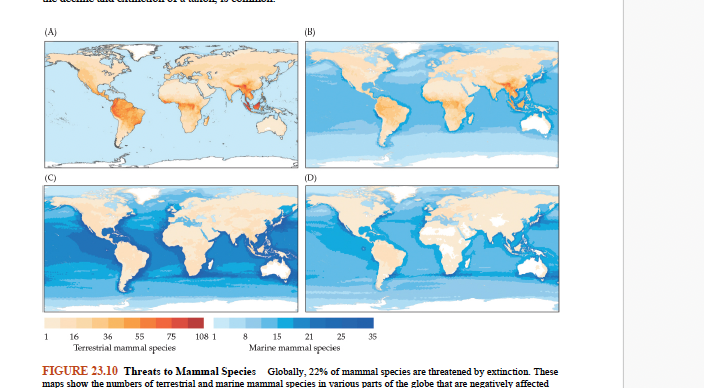
Q: According to Figure 23.10, how do threats to marine mammals differ from terrestrial ones?
A: Marine mammals face more threats from accidental mortality (e.g., bycatch) and pollution, while habitat loss is less direct compared to terrestrial mammals.
Q: What proportion of mammals with sufficient data are threatened with extinction?
A: Approximately 25% of mammal species are currently threatened.
Q: What is the most important global driver of biodiversity loss?
A: Habitat loss and degradation due to human activities like agriculture, urbanization, and resource extraction.
Q: How much of Earth’s land has been significantly modified by human activity?
A: Roughly 60% of Earth’s land surface has been modified (Sanderson et al. 2002).
Q: What are the definitions of habitat loss, fragmentation, and degradation?
A:
Loss: Complete conversion to human use (e.g., farms, cities)
Fragmentation: Breaking continuous habitat into patches
Degradation: Reduction in quality of habitat for many species
Q: Why is the Atlantic forest of Brazil a biodiversity hotspot?
A: It contains many endemic species, including 73 endemic mammals, due to its long isolation from the Amazon rainforest.
Q: What has happened to the Atlantic forest, and what are the consequences?
A: Over 92% has been cleared, with the rest highly fragmented, leading to endangered species and ecosystem disruption.
Q: According to Brooks et al. (1999), why haven’t extinctions been recorded among Atlantic forest birds?
A:
Birds may have adapted to fragments
Vulnerable species may have gone extinct unnoticed
Time lag—extinctions are likely pending due to reduced populations
Q: What ecological effects have already been observed due to bird decline in the Atlantic forest?
A: Reductions in seed size and seedling survival of bird-dispersed plants, indicating breakdown in mutualistic interactions (Galetti et al. 2013).
Q: Why is it important to consider multiple interacting threats in conservation biology?
A: Because most species decline from a combination of factors, not a single cause—interacting threats can amplify extinction risks.
Q: How do human activities impact marine ecosystems in addition to terrestrial ones?
A: All marine ecosystems have been impacted, particularly through pollution, overfishing, and habitat modification (Halpern et al. 2008).
Q: What percent of Earth’s primary production is appropriated by humans?
A: Humans now use approximately 25% of Earth's NPP (Haberl et al. 2014), reducing energy available to other species.
Q: How has the Eurasian zebra mussel affected North American freshwater mussels?
A: It has caused population declines of 60–90%, including some regional extinctions, due to competition for space and resources (Strayer & Malcom, 2007).
Q: Why are North American freshwater mussels particularly vulnerable to invasion?
A: They are often endemic, already globally imperiled, and threatened by pollution and river channelization, making them highly sensitive to additional stress.
Q: What happened after the Nile perch was introduced into Lake Victoria in the 1960s?
A: Roughly 200 endemic cichlid species went extinct. The Nile perch now makes up 80% of fish biomass, replacing the once-dominant cichlids.
Q: What factors besides predation by Nile perch contributed to cichlid decline?
A: Pollution and overfishing further stressed the cichlid populations (Seehausen et al., 1997).
Q: How have invasive species impacted Hawaiian tropical dry forests?
A: Invasive hogs, rats, and grasses have worsened habitat loss. Fire-adapted grasses increase fire frequency, degrading forests and favoring invasives.
Q: What is kudzu and how has it impacted nitrogen cycling?
A: Kudzu (Pueraria montana) is an invasive vine that fixes large amounts of nitrogen and increases soil nitrogen mineralization, altering nutrient dynamics.
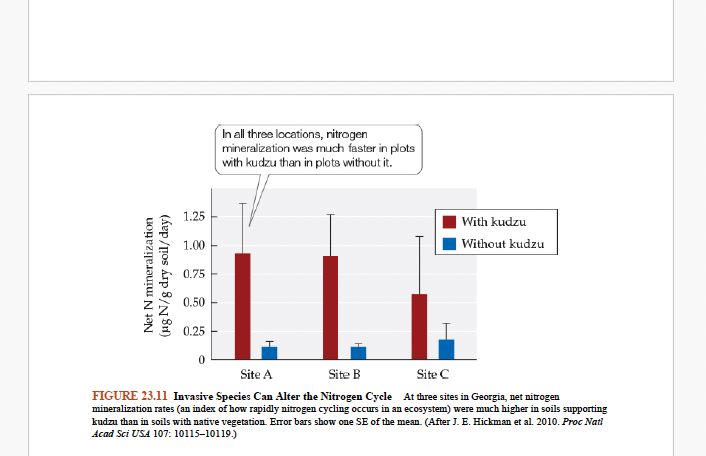
Q: What does Figure 23.11 show about kudzu's effect on nitrogen cycling?
A: At 3 sites in Georgia, soils with kudzu had over 7x higher nitrogen mineralization rates than native plots—indicating major nutrient cycle disruption (Hickman et al., 2010).
Q: What is nitric oxide (NO) and how does kudzu affect its emission?
A: NO is a gas that contributes to ozone pollution. Kudzu-invaded plots released more than twice as much NO as non-invaded plots.
Q: How did researchers test kudzu’s effect on NO emissions (Analyzing Data 23.1)?
A: They used a t-test comparing NO emissions from 4 kudzu plots and 4 control plots, finding statistically significant increases in emissions from invaded plots.
Q: What broader environmental effect could kudzu have according to modeling?
A: It could increase the number of high-ozone days by up to 7 per summer across the southeastern U.S., worsening air pollution and human health risks
Q: Why is kudzu’s high nitrogen fixation especially problematic for ecosystems?
A: It fosters the spread of other invasive plants, outcompetes natives, and alters ecosystem functions such as nutrient cycling and air quality.
Q: What makes invasive species management difficult?
A: Eradication is labor-intensive and expensive, especially once the species is well-established. Control is most effective through early detection and rapid response.
Q: What is the best strategy for combating invasive species?
A: Prevention through border screening and immediate control upon detection are the most effective and economical approaches (Simberloff, 2003).
What is overexploitation?
A: The harvest of wild organisms at a rate that exceeds their replacement, leading to population declines and biodiversity loss.
Q: What is the “empty forest” syndrome?
A: Forests that appear intact from satellite imagery but lack large vertebrates due to overhunting (Redford, 1992).
How many animals were imported to the U.S. (mostly for the pet trade) from 2000–2006?
A: About 1.5 billion animals (Smith et al. 2009).
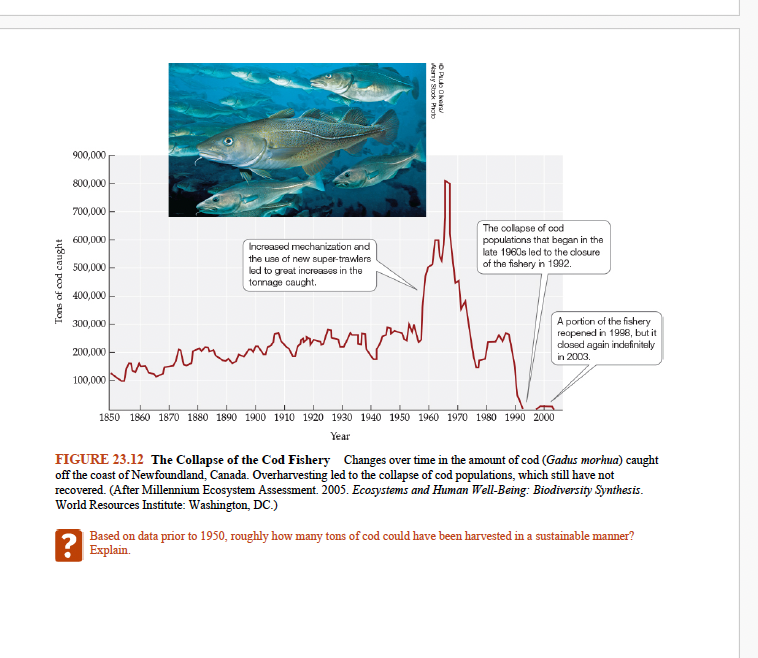
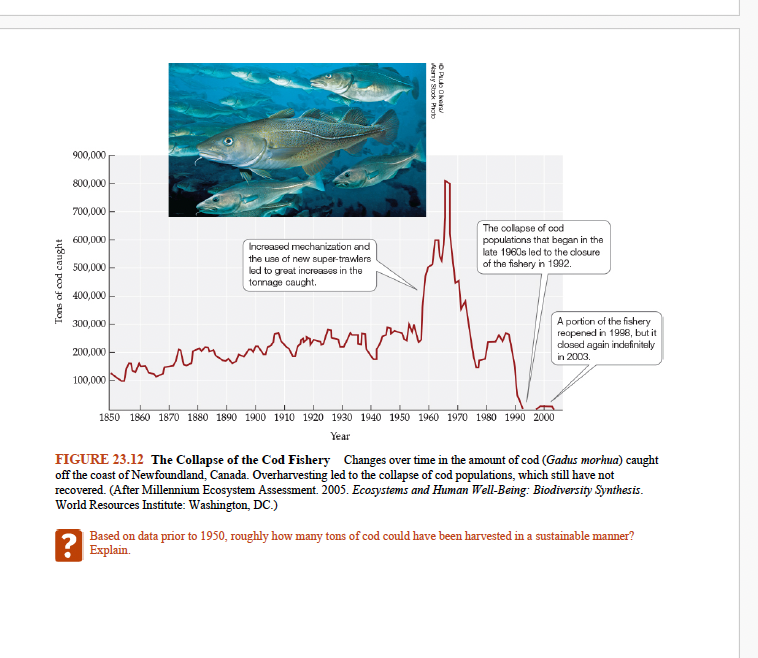
What does Figure 23.12 show about cod fishery collapse?
A: Cod catches off Newfoundland peaked mid-20th century but crashed due to overharvesting. Before 1950, ~250,000 tons could have been sustainably harvested.
Q: What trend is shown in Figure 23.13 about trophy fish?
A: Between 1960 and 2007, the average size of fish caught declined by over 50%, showing size-selective overharvesting (McClenachan, 2009).
What is the "anthropogenic Allee effect"?
A: Economically valuable species become more sought after as they become rarer, increasing the risk of extinction due to human-driven overharvesting.
Q: What are bycatch and its ecological effects?
A: Non-target species caught during fishing (e.g., turtles, seabirds). It disrupts food webs and causes unnecessary marine mortality.
Q: How does repeated trawling affect ocean habitats?
A: It damages benthic species (e.g., corals, sponges) and results in slow recovery of sea floor habitats (NRC, 2002).
Q: What are EDCs and why are they concerning?
A: Endocrine-disrupting chemicals like DDT, PCBs, and flame retardants interfere with hormone systems and are bioaccumulated in marine mammals.
Q: What does Figure 23.14 reveal about EDCs in marine mammals?
A: Killer whales and harbor seals in British Columbia have very high levels of PCBs and PBDEs, leading to reproductive and immune dysfunction.
Q: What effect do EDCs have on pallid sturgeon?
A: They cause feminization, interfering with reproduction in endangered fish populations in the Mississippi River.
Q: What diseases have contributed to species declines?
A:
Batrachochytrium fungus: global amphibian decline
Canine distemper: black-footed ferrets
Facial tumor disease: Tasmanian devils
Unknown virus: Tasmanian wolf extinction
What does Interactive Figure 23.15 show about biome-specific threats?
A:
Tropics: most affected by habitat loss
Polar regions: most affected by climate change
Threats vary by biome and are increasing in severity
Q: What are the most pressing threats globally now and into the future?
A:
Currently: Habitat loss, overexploitation
Future: Climate change, invasive species, pollution (Millennium Ecosystem Assessment, 2005)
Q: Why are pollutants like PBDEs particularly dangerous for top predators?
A: They biomagnify in food chains, reaching high concentrations in organisms like orcas, where they impair health and reproduction.
Q: What is the best strategy for addressing overexploitation?
A: Determine sustainable harvest levels and enforce regulations that allow populations to replenish.
Q: What is one example of sustainable use to protect a species?
A: Banteng populations in Indonesia are managed through regulated trophy hunting that generates revenue while protecting recovery (Bradshaw & Brook, 2007).
Q: How does pollution compound other threats to biodiversity?
A: It increases physiological stress, weakens immune function, and lowers species’ resilience to other threats like habitat loss and disease.
Q: How can conservation biologists respond to multifaceted threats?
A: By developing integrated strategies that address multiple interacting threats through monitoring, policy, habitat restoration, and education.
Q: What is the primary focus of conservation biology—species or habitat?
A: While both are important, conservation biologists generally focus on habitat protection, since preserving habitat supports entire communities. However, understanding the biology of threatened species is essential to identify and manage their habitat effectively.
Q: Why are genetic analyses crucial in conservation biology?
A: Genetic analyses help assess genetic variation and detect inbreeding or genetic drift in small populations, guiding interventions such as genetic rescue to prevent extinction.
Q: What was the genetic problem in the Florida panther population, and how was it resolved?
A: The population suffered from low genetic diversity, heart defects, and poor sperm quality. In 1995, 8 female pumas from Texas were introduced to increase gene flow, resulting in tripled population size by 2007 and reduced genetic abnormalities.
Q: What does Figure 23.16 demonstrate about genetic rescue in the Florida panther?
A: It shows that after the introduction of Texas females, genetic diversity increased, and the frequency of defects decreased, supporting genetic rescue as a viable conservation strategy.
Q: What is a risk associated with genetic rescue?
A: Introducing individuals with incompatible breeding traits, like ibex from the Middle East mating in fall (vs. winter in the local population), can result in mistimed births and population failure.
Q: How is forensic genetics used in conservation biology?
A: It can trace the geographic origin of illegal wildlife products, like ivory, using DNA profiling (e.g., PCR amplification of variable segments), helping law enforcement target poaching hotspots.
Q: What did Wasser et al. discover about the 2002 Singapore ivory seizure using DNA?
A: All tusks originated from a small region in southern Africa (Zambia), contradicting the assumption they came from multiple areas, allowing focused anti-poaching efforts.
Q1: What is conservation biology?
.
Q3: What is the difference between objective and value-based questions in conservation?
A3: Objective questions are fact-based (e.g., "How many whales can be sustainably harvested?"), while value-based questions ask what should be done (e.g., "Should we harvest whales at all?").
A1: Conservation biology is an integrative discipline that applies ecological principles to protect biodiversity
Q2: How does conservation biology balance objectivity and values?
A2: While science aims to be objective, conservation biology occurs within a social context and is influenced by human values (e.g., valuing species, ecosystems).
Q3: What is the difference between objective and value-based questions in conservation?
A3: Objective questions are fact-based (e.g., "How many whales can be sustainably harvested?"), while value-based questions ask what should be done (e.g., "Should we harvest whales at all?").