CH. 3 DISPLAYING AND SUMMARIZING QUANTITATIVE DATA
1/62
There's no tags or description
Looks like no tags are added yet.
Name | Mastery | Learn | Test | Matching | Spaced |
|---|
No study sessions yet.
63 Terms
What is quantitative data?
It’s data that consists of variables that measure numerical quantities
What are 2 major ways we can describe quantitative data? Using what?
plots, numerical summaries
What are the 2 types of plots we can use to describe quantitative data?
histogram, boxplot
What are the 3 types of numerical summaries we can use to describe quantitative data?
mean, median, range, etc.
What type of categories do histograms create?
artificial categories for values of quantitative variable
What do you call these artificial categories that these histograms create?
bins or classes
Fill in the blanks.
Pretend variables is categorical & create _______.
bar-plot
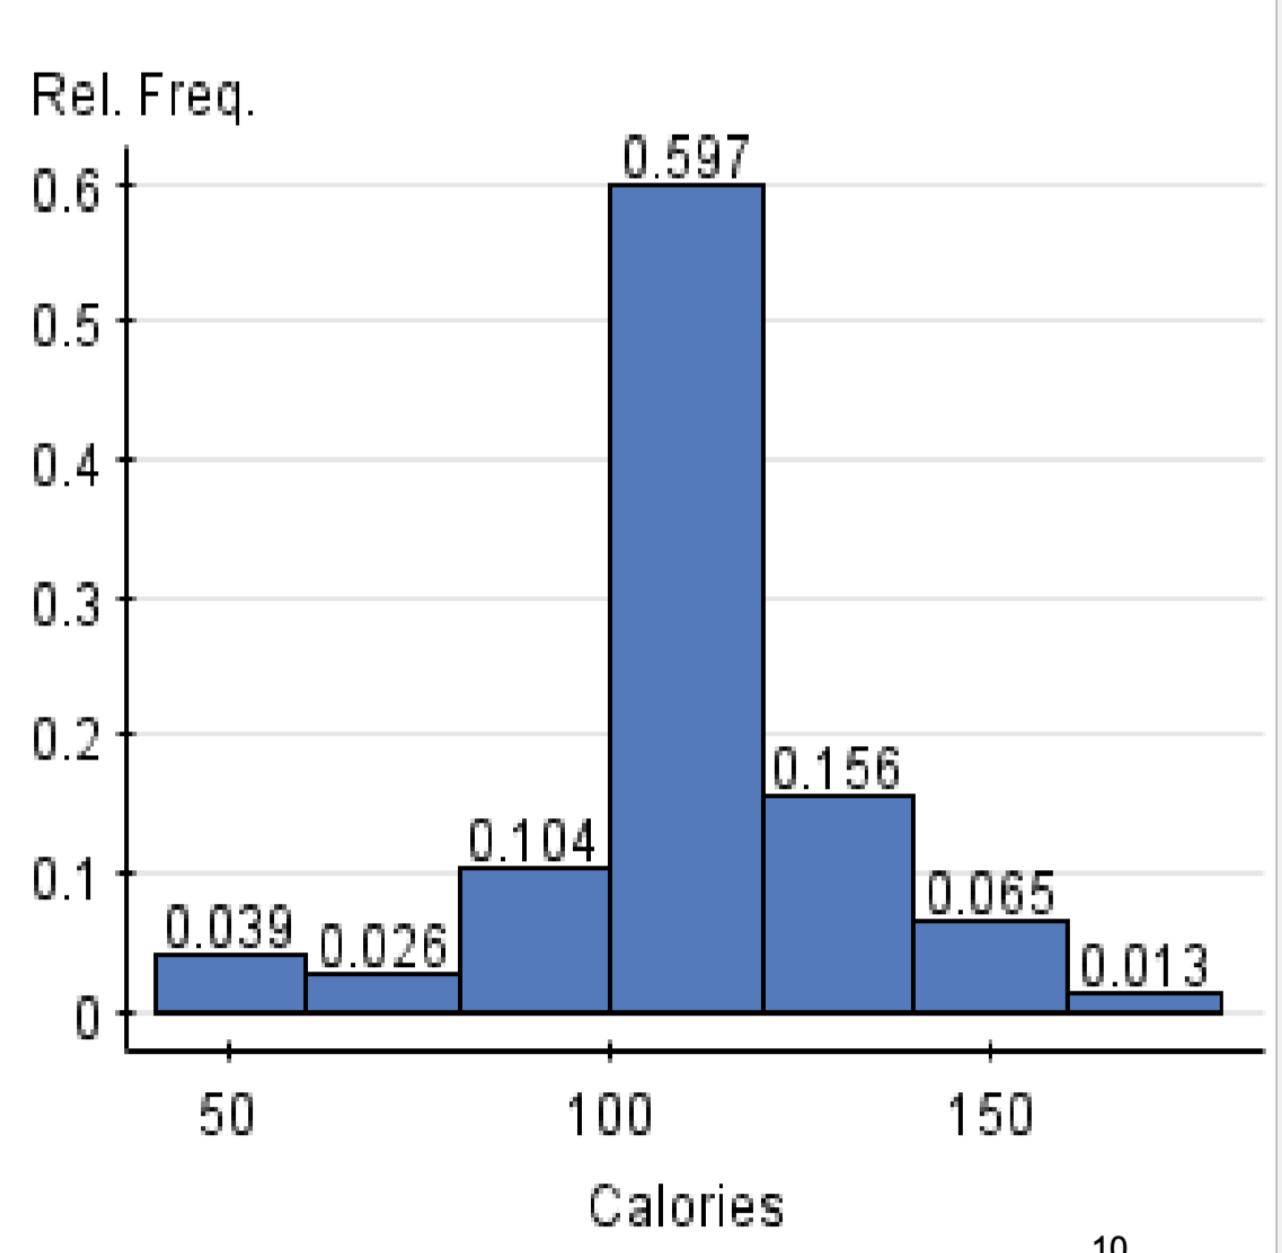
What type of graph is this in the image shown?
relative frequency histogram
What are the 2 major features that distinguish bar-plot from histogram?
Categories (classes)
are orderedNo gaps between
bars (unless freq.=0)
For any quantitative variable, what are 3 aspects we look at to describe the overall pattern of it’s distribution?
shape
centre
spread
What do you look at when you see the shape of the distribution?
the modality
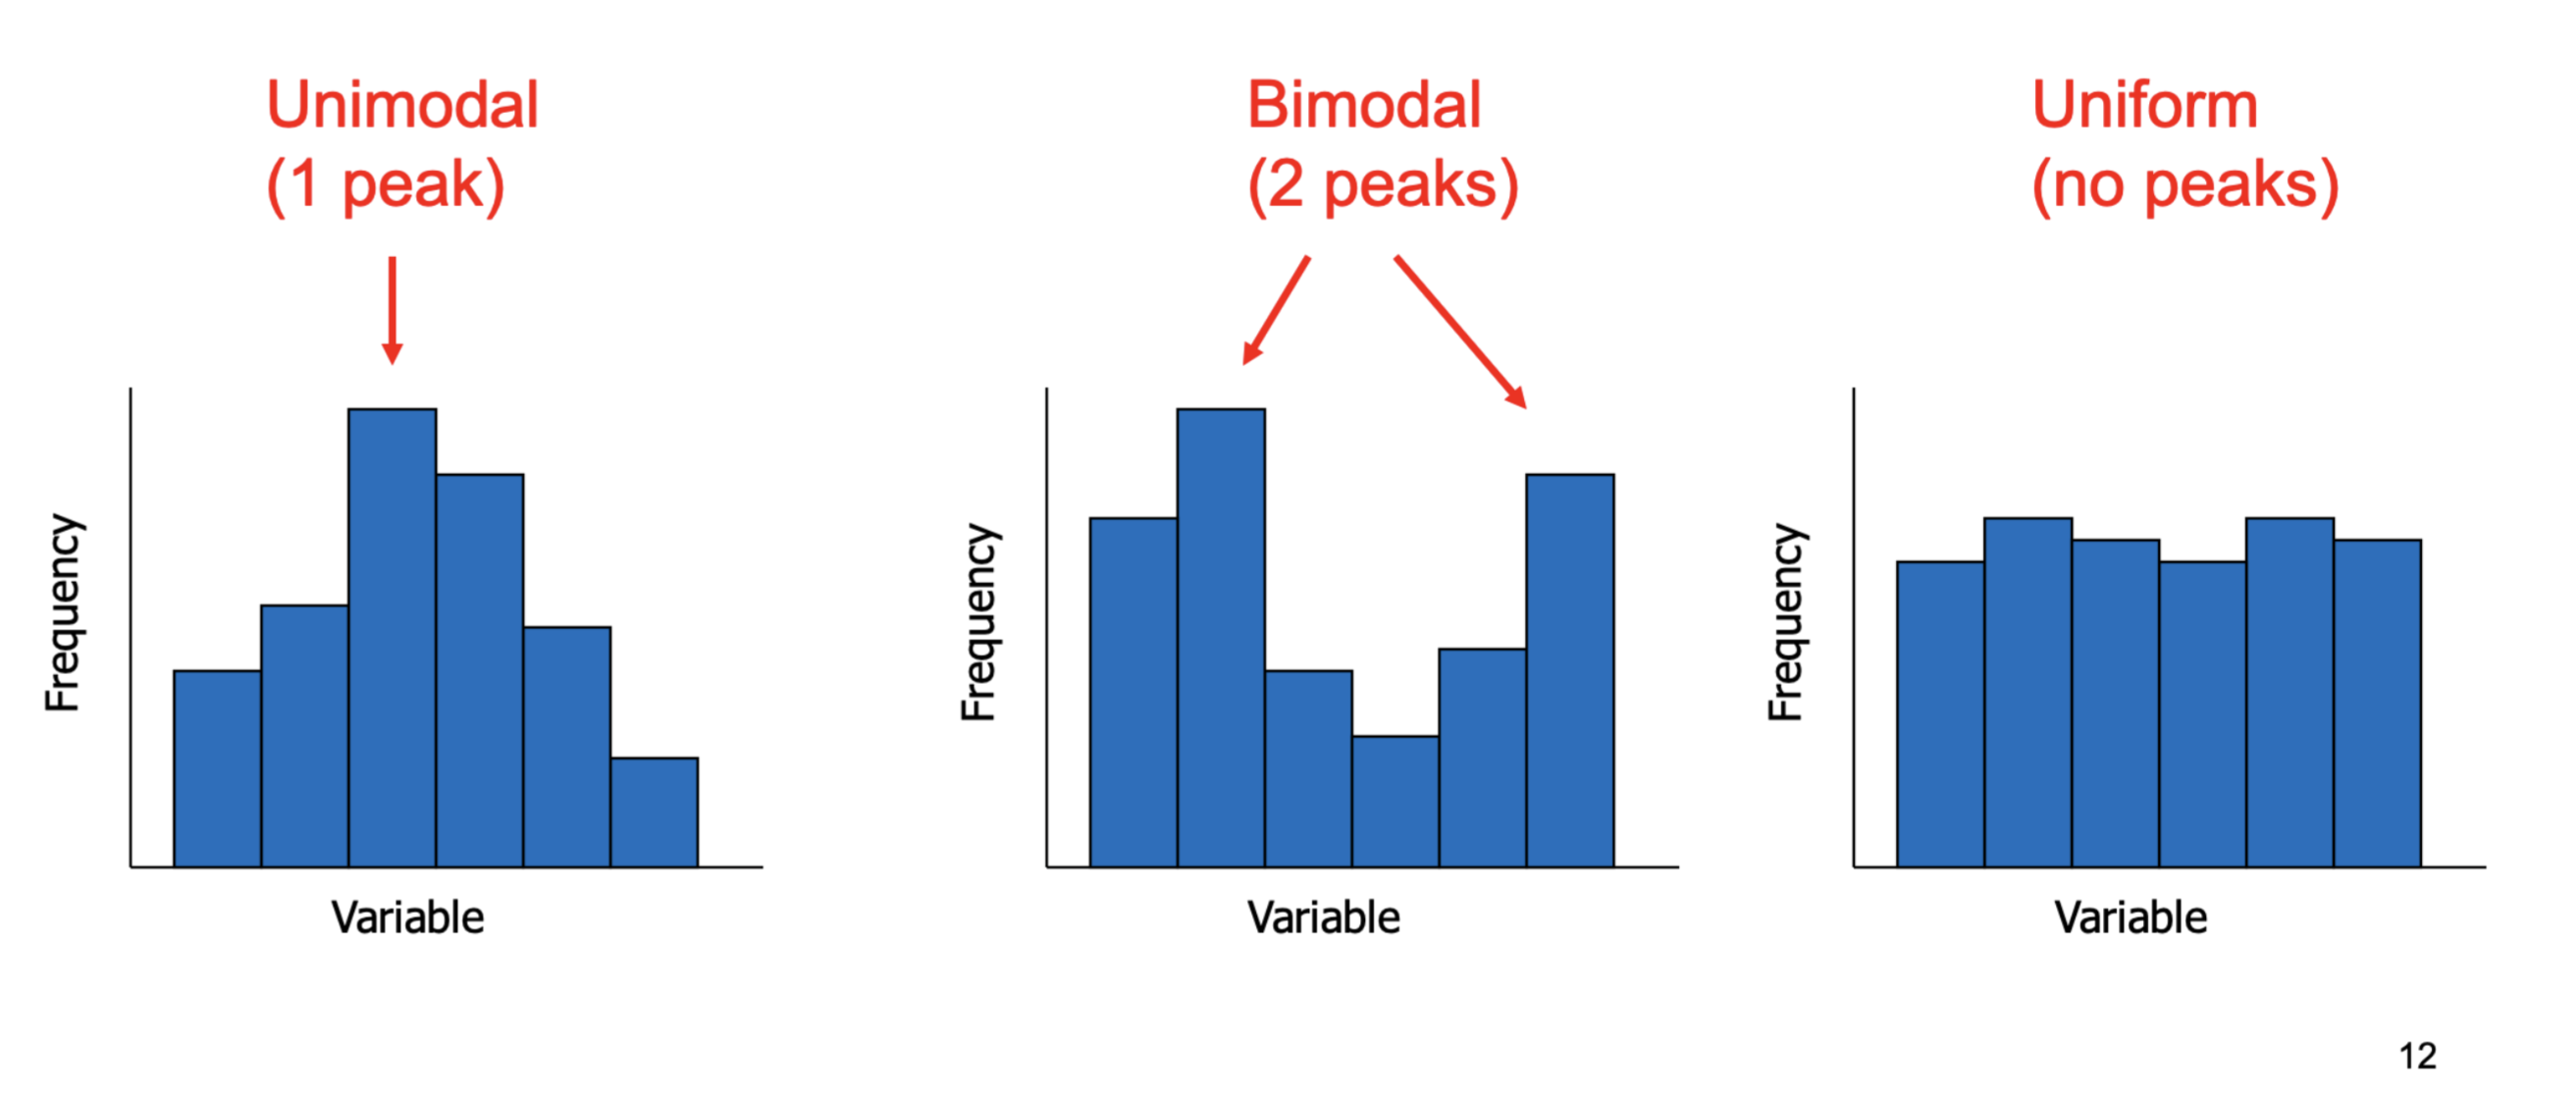
What does modality refer to?
the number of modes or peaks in the data set distribution
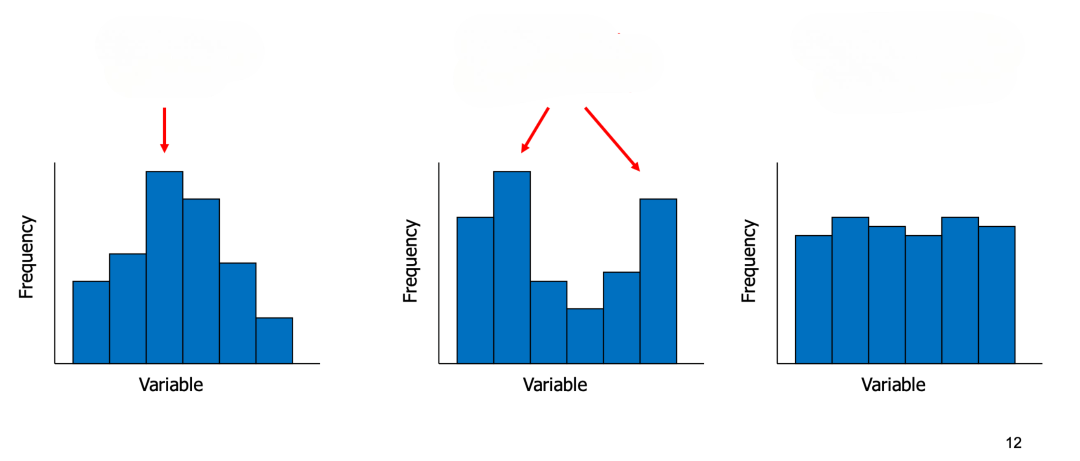
What are the 3 different types of modality (shape of distribution)?
unimodel
bimodel
uniform
What are the 4 factors you must consider when looking at the shape of the distribution?
modality
symmetry
skeweness
outliers
Looking at the shape of the distribution, when do we call a distribution “symmetric”?
if, when we draw a vertical line down its center, the two sides are similar in shape and size
When do we call a shape of distribution towards being “skewed”?
When the graph is a unimodal distribution with one
tail longer than the other.
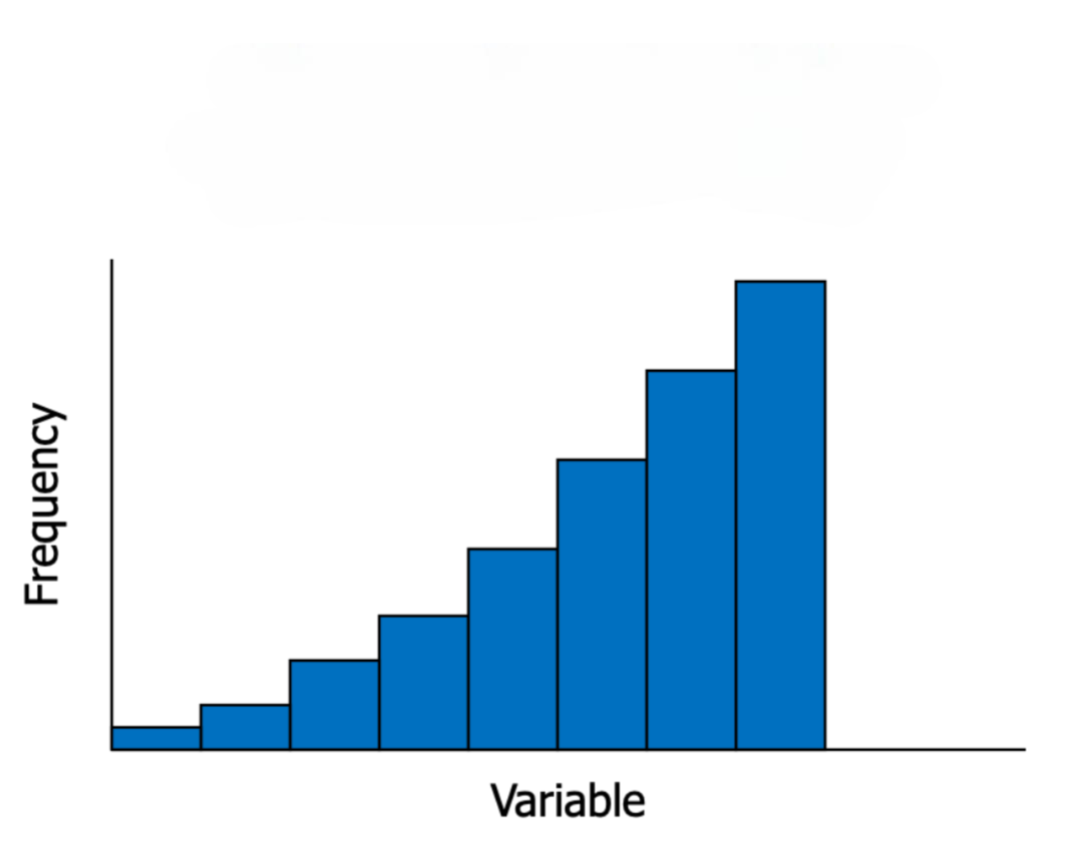
How would you describe the shape of the distribution in the provided image?
skewed to the left (negatively skewed)
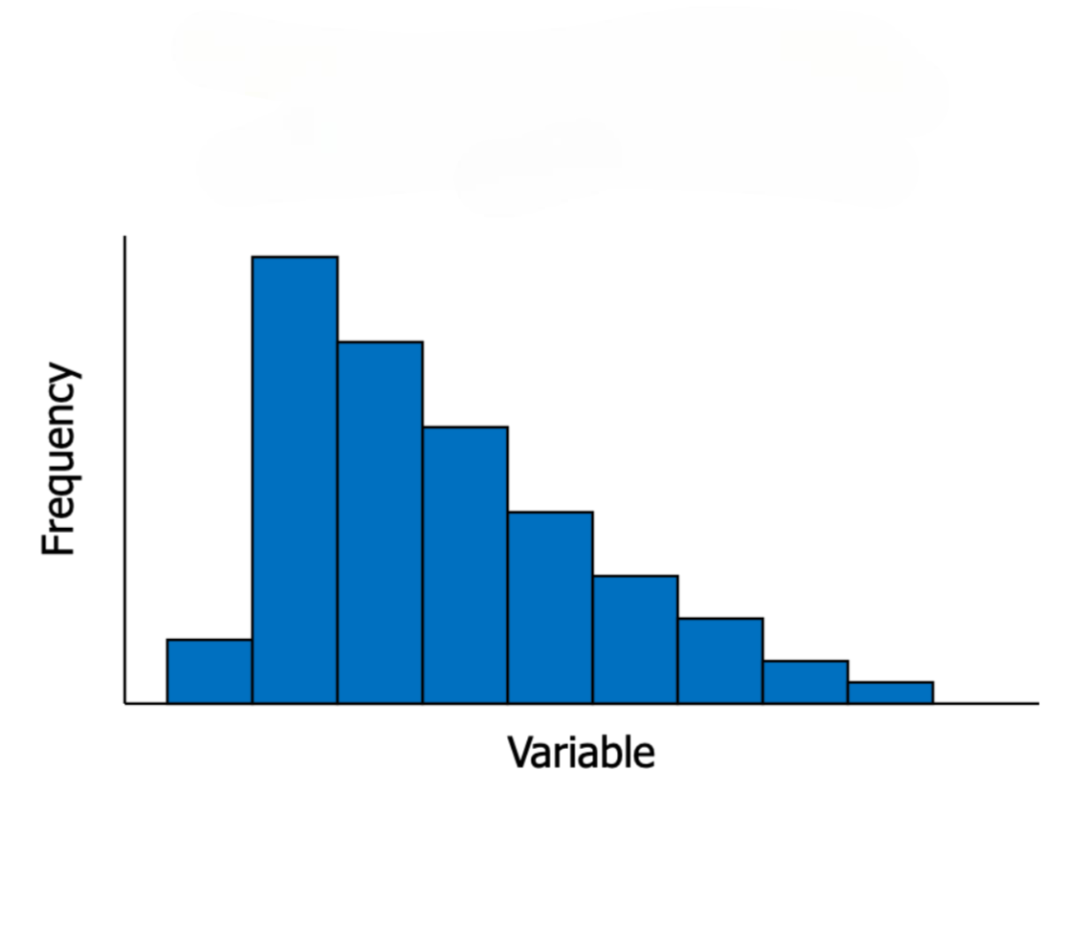
How would you describe the shape of the distribution in the provided image?
skewed to the right (positively skewed)
Looking at any data set provided on a graph (in general) , what would be considered an “outlier”?
Any data that lie far off the main body of the distribution
True or False.
Extreme values are known as “outliers”.
True.
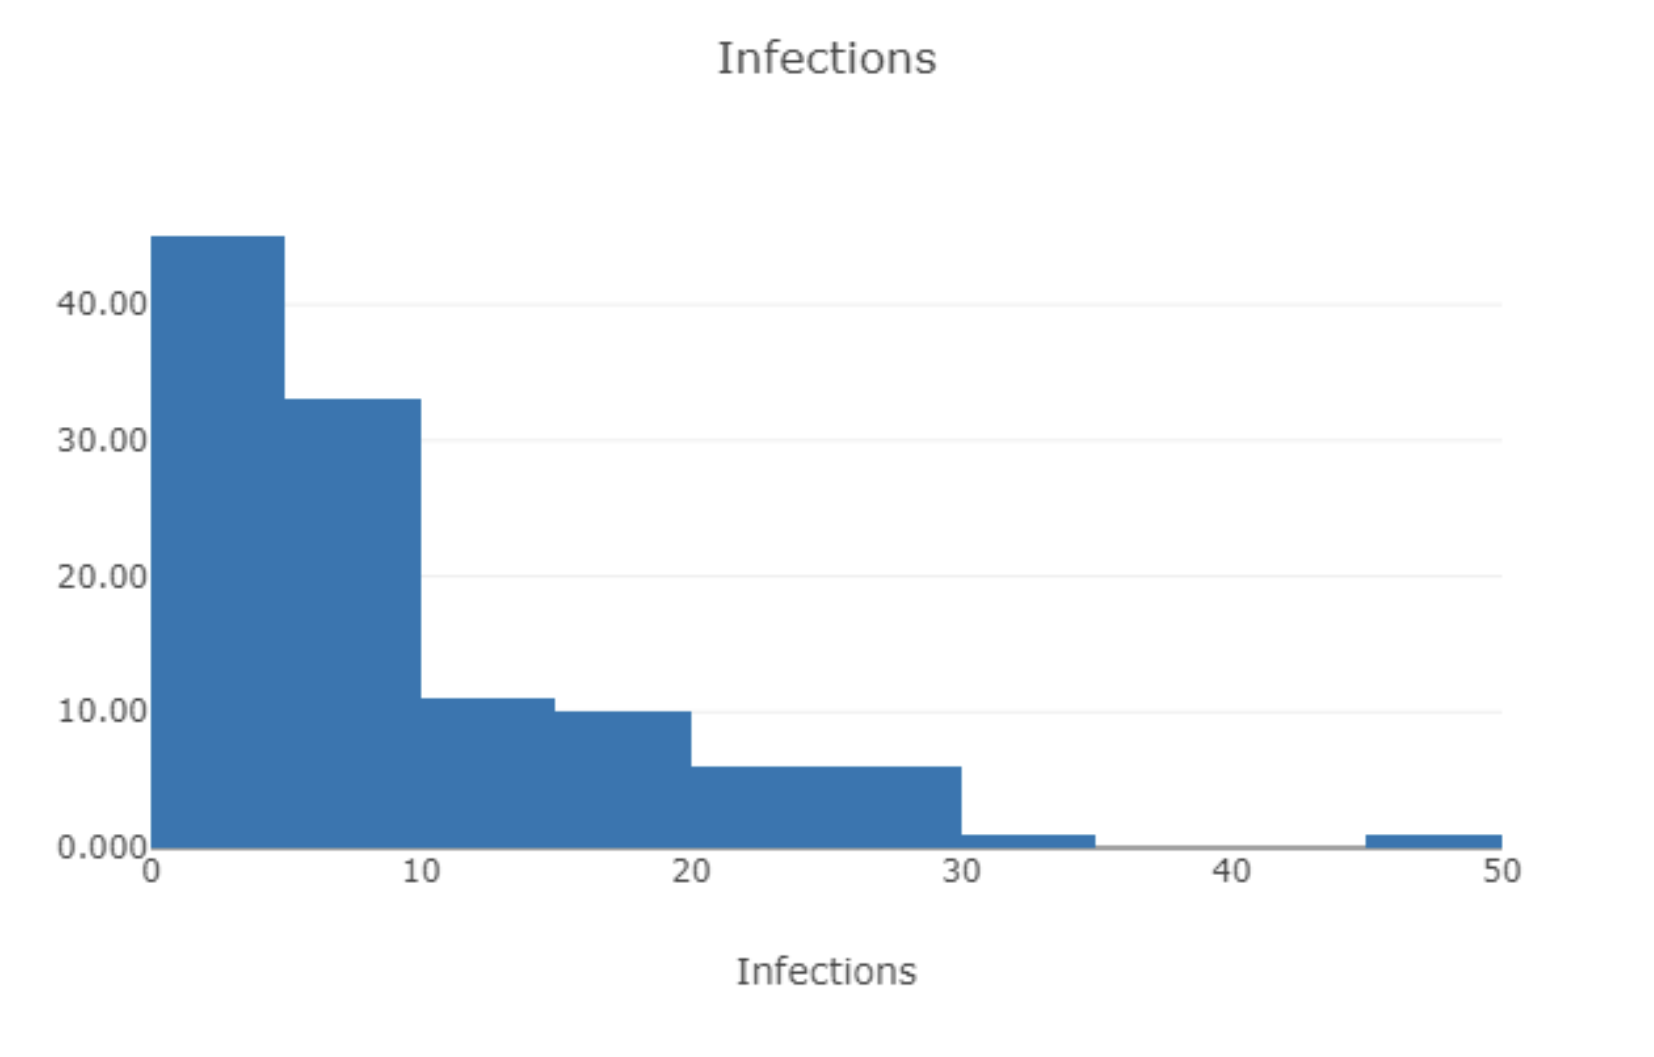
How would you describe the shape of the distribution of the variable, infections?
unimodel, skewed to the right & one outlier present
What are 2 different types of centres that an describe the pattern of distribution?
mean and median
What value is considered to be the “mean”?
A value that is the sum of all values of the quantitative variable divided by the number of values
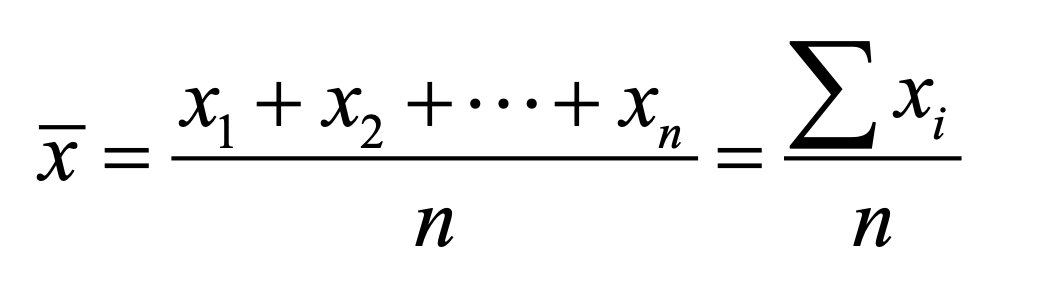
What is this formula (seen in the image) calculating for?
the mean
Fill in the blanks.
Mean is “_______” of data
center of gravity
True or false.
Mean is not sensitive to outliers.
False.
What value is considered to be the “median”?
A value that is the midpoint of all values, after they are
ordered from the smallest to the largest.
True or false.
Median is considered to be the value expressing 50% of values above & 50% below the median.
True.
For an even (#) number data set, how would you calculate the median?
You would take the mean of the two middle numbers.
True or false.
Median is robust to outliers.
True.
What does the term ‘robust’ mean?
less influenced by
Fill in the blanks.
For symmetric distributions: mean __ median
For skewed distributions: mean __ median
For symmetric distributions: mean = median
For skewed distributions: mean >< median
Fill in the blank
When does a graph become left-skewed:
when mean __ median.
mean < median
Fill in the blank
When does a graph become right skewed:
when mean __ median.
mean > median
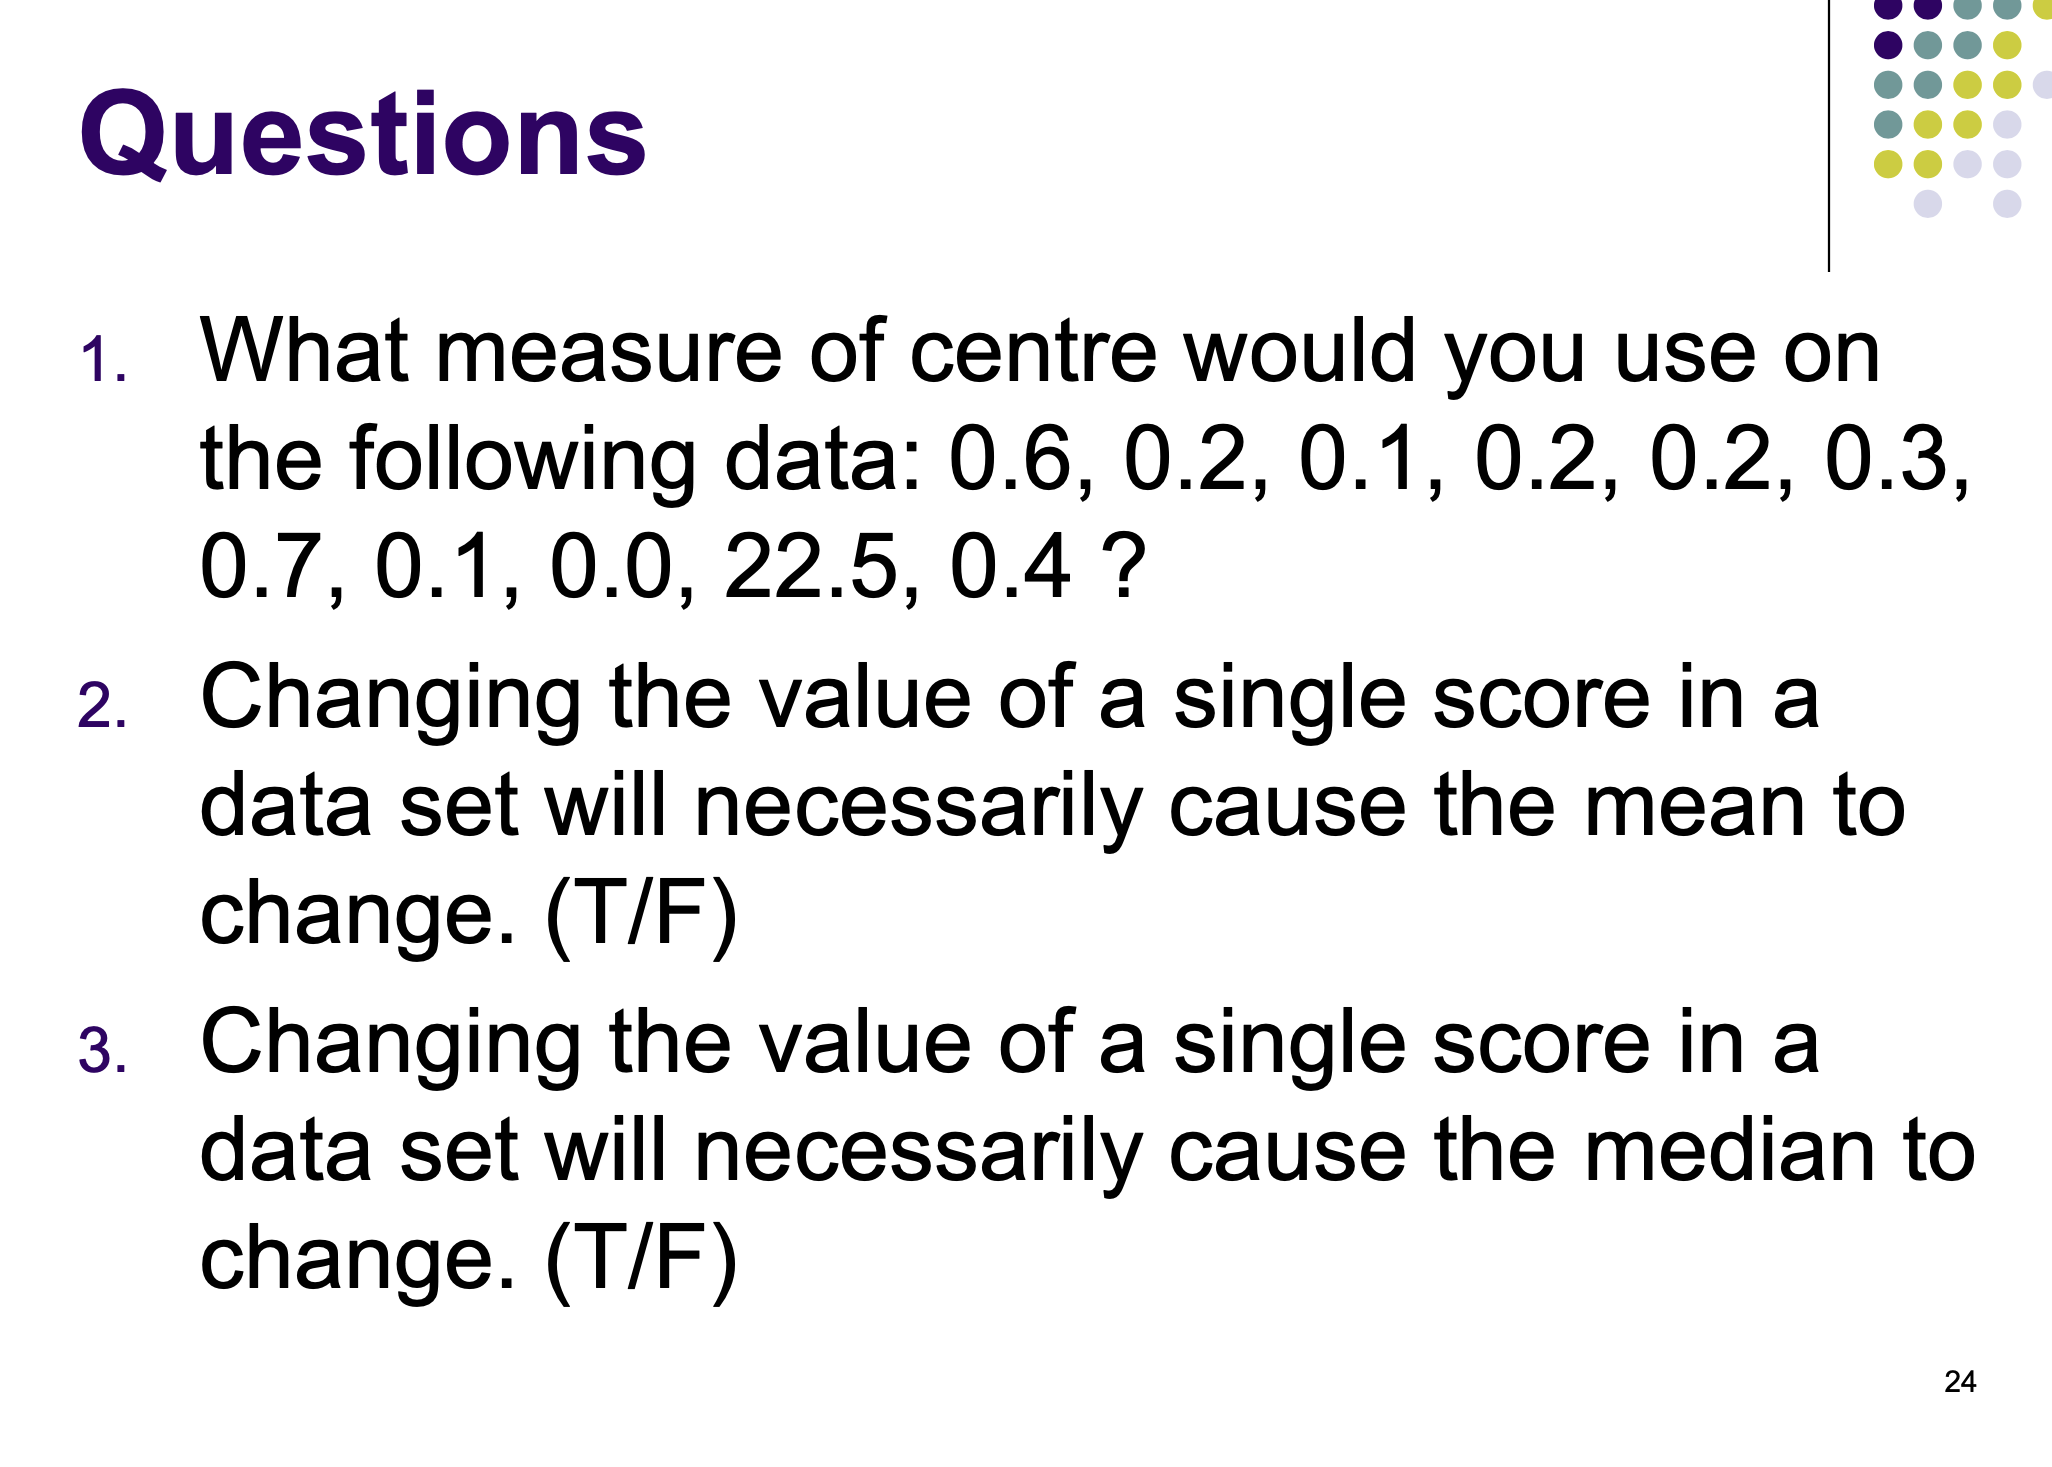
Answer the following questions on the provided image.
Median
T
F
What are the 4 different types of spreads of distributions to consider when describing the pattern of distribution of a graph/chart?
range, standard deviation, IQR, variance
What does spread describe?
how much data vary about their centre
What is the formula used to calacuate the range of a data set?
range = max - min
True or false.
Range is not very sensitive to outliers.
False.
If your data set clearly has outliers present and you want to figure out a good measure of spread distribution for that particular data set provided. What spread of measure would you use?
IQR (interquartile range)
Fill in the blanks.
Quartiles are ___ values that divide distribution
into ____ parts, each containing ¼ of data.
3, 4
Fill in the blanks.
1st quartile (Q1) has __ of data below & __ above
¼ , ¾
Fill in the blanks.
2nd quartile (Q2) has __ of data below & __ above
½, ½
Fill in the blanks.
3 rd quartile (Q3) has __ of data below & __ above.
¾, ¼
Given a data set, how would you find Q1, Q2 and Q3?
Split the data into two halves, and the middle value would be the Q2. The first half of the data's middle value would be the Q1, and the second half's middle value would be the Q3. *NOTE: (if two values are present, take the mean of both values to obtain one value)
What is the formula to caluclate the IQR?
IQR = Q3 - Q1
What does IQR (interquartile range) mean?
It’s the distance between Q1 and Q3
Fill in the blanks.
IQR is _________ to outliers.
resistant
What measure is variance (s²)?
A measure that measures the average squared deviation of individual data from their mean.
What measure of units is variance always?
squared units
How would you calculate standard deviation?
s = √s² = √variance
What do both variance and standard deviation both measure?
the spread around the mean (distance)
Are variance and standard deviation both sensitive to outliers? Explain.
Yes, as they look at the measure from each data point to the sample mean (which, is sensitive to outliers)
What do both variance and standard deviation work best for?
symmetric distribution
What kind of measure is standard deviation?
measure of the amount of variation in a set of data
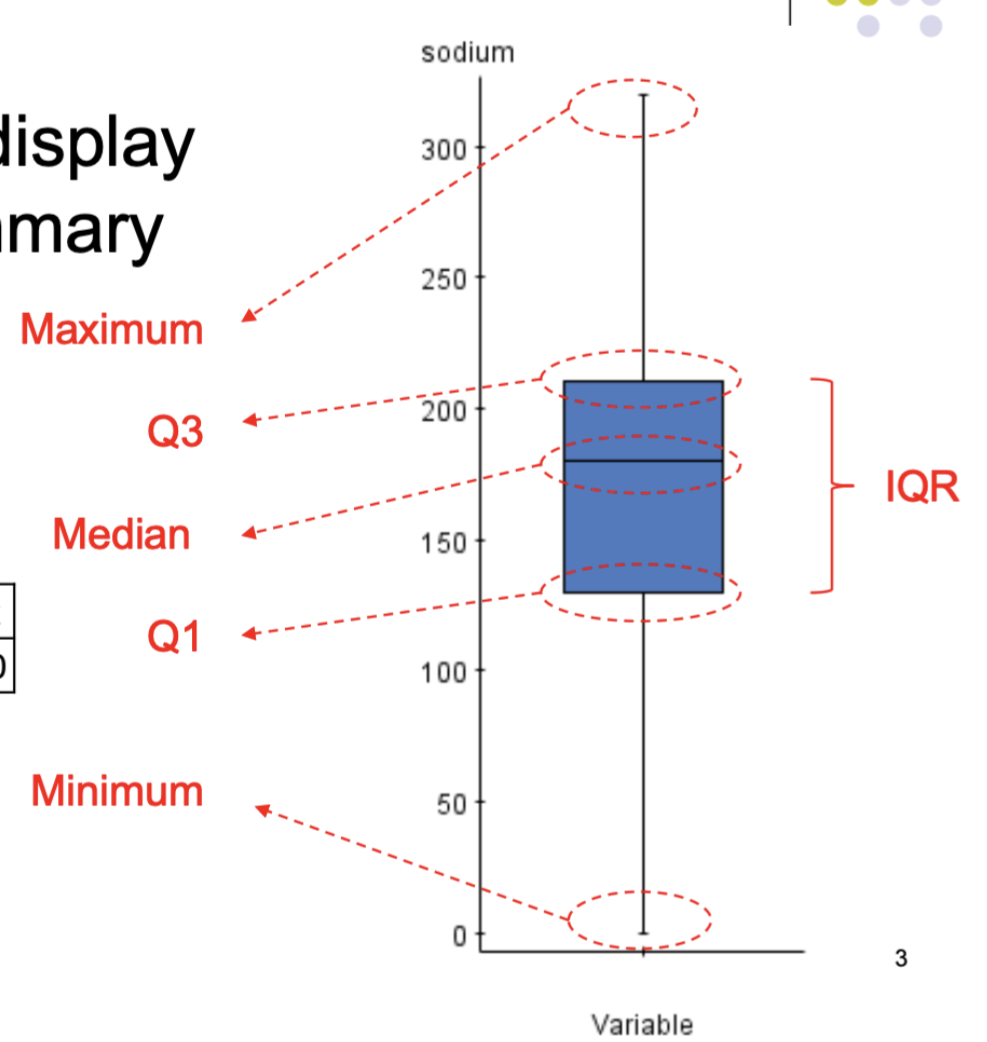
What is a 5-number summary?
A 5-number summary is set of five measures giving quick summary of a distribution.
What does the five-number summary consist of?
Minimum
Q1
Q2 - Median
Q3
Maximum
What would be a visual display of 5-number summary?
a boxplot
Why do boxplots aid in identifying outliers?
by calculating both the upper and lower fences, and drawing those fences on the boxplot - those points outside these fences are suspected the outliers
How would you calculate upper & lower fences?
upper fence = Q3 + 1.5 * IQR
lower fence = Q1 - 1.5 * IQR
Fill in the blanks.
Five-number summary is better for describing
__________________________.
skewed distributions w/ outliers
Fill in the blank.
___________ and __________ work well for reasonably symmetric distributions w/o outliers
mean, standard deviation
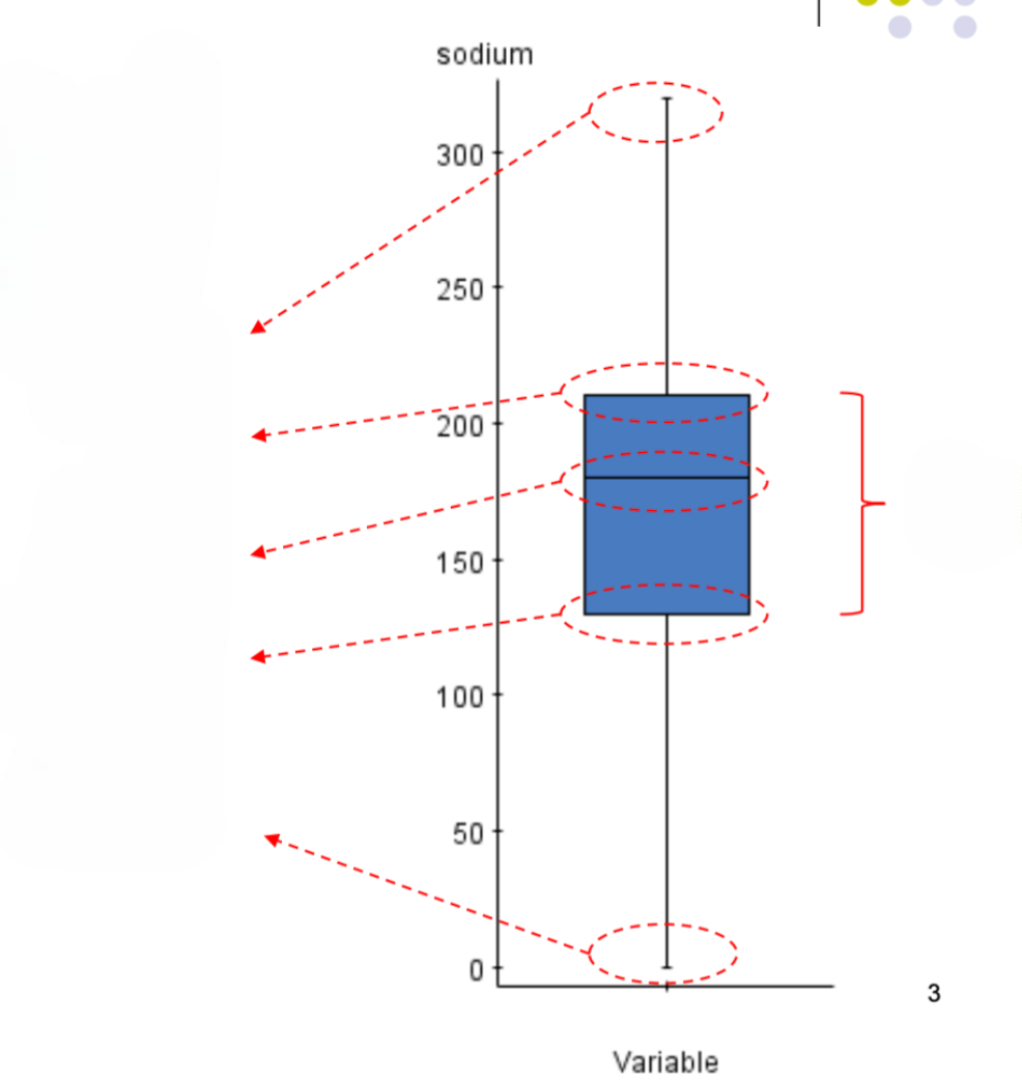
Fill in the blanks on this box-plot diagram?