Normal distribution
1/4
There's no tags or description
Looks like no tags are added yet.
Name | Mastery | Learn | Test | Matching | Spaced |
|---|
No study sessions yet.
5 Terms
What is a normal distribution graph?
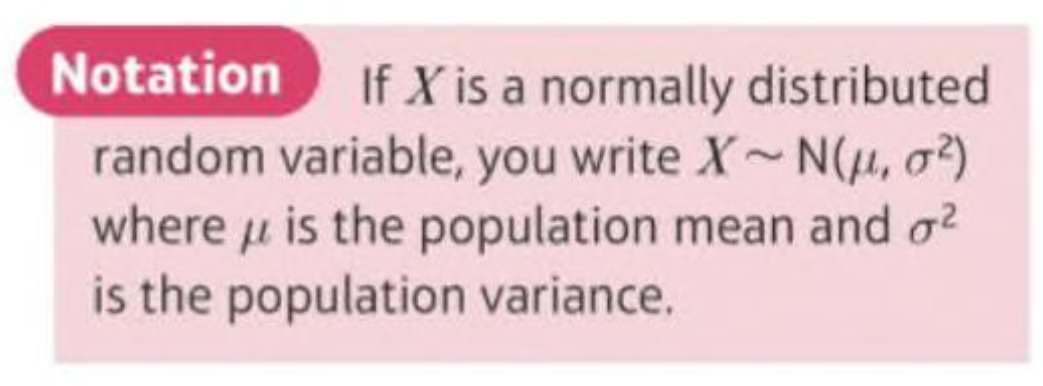
Has parameters µ, the population mean and σ², the population variance
is symmetrical (mean = median = mode)
Total area = 1
Point of inflection at µ + σ and µ - σ

Key percentages needed to know about normal distribution:
68% of data lies within one standard deviation from mean
95% of data lies within two standard deviations from the mean
99.7% of data lies within three standard deviations from the mean
The standardised normal distribution => Z
Useful for working out mean and standard deviation

Approximating binomial distribution
When N is large and P is close to 0.5 in binomial distribution, this can be used to work out mean and standard deviation.

Hypothesis testing with normal distribution:
All the other steps for hypothesis testing is same
IN THE PICTURE: the formulae present
