PSYASS 2 - 3 A Statistics Refresher
1/24
Earn XP
Description and Tags
Name | Mastery | Learn | Test | Matching | Spaced |
|---|
No study sessions yet.
25 Terms
Measurement
act of assigning numbers or symbols to characteristics of things (people, events, whatever) according to the rules
Scale
a set of numbers (or other symbols) whose properties model empirical properties of the objects to which the numbers are assigned
Continuous Scale
a scale used to measure a continuous variable
Discrete Scale
a scale used to measure a discrete variable
error
Measurement always involves _____.
Error
refers to the collective influence of all the factors on a test score or measurement beyond those specifically measured by the test or measurement
Four Levels or Scales of Measurement
N - nominal
O - ordinal
I - interval
R - ratio
Nominal Scales
the simplest form of measurement; involves classification or categorization based on one or more distinguishing characteristics, where all things measured must be placed onto mutually exclusive and exhaustive category
Ordinal Scales
just like the nominal scale, it permits classification and in addition to that, rank ordering on some characteristics is also permissible with this scale
Interval Scales
in addition to the features of nominal and ordinal scales, this scale contain equal intervals between numbers; each unit on the scale is exactly equal to any other unit on the scale; similar to ordinal scales without absolute zero point
Ratio Scales
In addition to all the properties of nominal, ordinal, and interval measurement, this scale has true zero point; all mathematical operations can meaningfully be performed because there exist equal intervals between the numbers on the scale as well as a true or absolute zero point
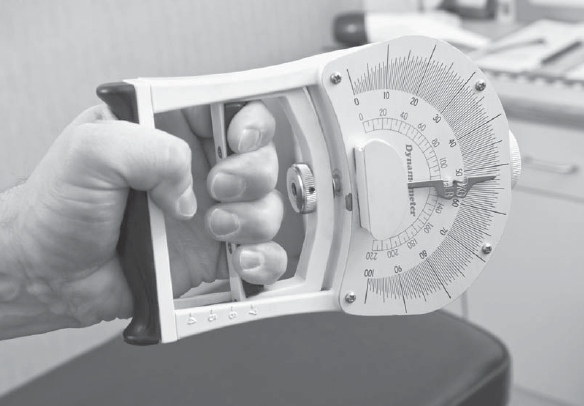
Dynamometer
instrument used to measure strength of hand grip
Distribution
a set of test scores arrayed for recording or study
Raw Score
a straightforward, unmodified accounting of performance that is usually numerical
Frequency Distribution
all scores are listed alongside the number of times each score occurred; scores might be listed in tabular or graphic form
simple frequency distribution
a frequency distribution is referred to as a ______ _________ ____________ to indicate that individual scores have been used and the data have not been grouped
Grouped Frequency Distribution
frequency distribution used to summarize data; test-score intervals, also called class intervals, replace the actual test scores
Graph
a diagram or chart composed of lines, points, bars, or other symbols that describe and illustrate data
Histogram
a graph with vertical lines drawn at the true limits of each test score (or class interval), forming a series of contiguous rectangles
abscissa ; ordinate
It is customary for the test scores (either the single scores or midpoints of the class intervals) to be placed along the graph’s horizontal axis (________ or X-axis) and for numbers indicative of the frequency of occurrence to be placed along the graph’s vertical axis (________ or Y-axis)
Bar Graph
numbers indicative of frequency also appear on the Y-axis, and reference to some categorization (yes/no/maybe, male/female) appears on the X-axis; typically rectangular bars are not contiguous
Frequency Polygon
data illustrated in a _________ _______ are expressed by a continuous line connecting the points where test scores or class intervals (X-axis) meet frequencies (Y-axis)
Measure of Central Tendency
a statistic that indicates the average or midmost score between the extreme scores in a distribution
Mean (Arithmetic Mean)
most commonly used measure of central tendency; referred to in everyday language as the “average“; takes into account the actual numerical value of every score
Arithmetic Mean
denoted by the symbol x̄ (and pronounced “X bar”), is equal to the sum of the observations (or test scores, in this case) divided by the number of observations