CHP 5 Biodiversity, Species Interactions, & Population Control
1/35
There's no tags or description
Looks like no tags are added yet.
Name | Mastery | Learn | Test | Matching | Spaced | Call with Kai |
|---|
No analytics yet
Send a link to your students to track their progress
36 Terms
native species
live and thrive in a community (native to that place)
invasive species
non native and displace native species
pioneer species
first to colonize a new area, tolerable to dif temp/ conditions (generalist)
keystone species
helps determine the type and number of other species in a community (beaver)
foundation species
create and enhance habitats
indicator species
species that are an early warning when there’s something wrong with environment (die first)
amphibians- habitat loss, pollution, UV rays
resource partitioning
splitting of resource use (times or heights) to not run out of resources
interspecific competition
competition between same species
intraspecific competition
competition between different species
climax community
when a population reaches a stable point (cant predict when)
parasitism
- & +
parasite feeds and harms host
endo- inside, ecto- on outside
mutualism
both species cooperate and benefit (bees and flowers)
commensalism
+ & =
one species benefits and other isn’t affected
exploitation competition
one organism indirectly limits resources(use faster)
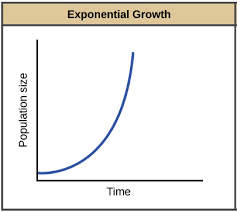
exponential growth
exponential graph (J) does not take limiting factors into account
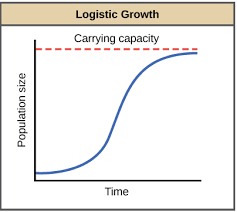
logistic model
accounts for limiting factors (closer to carrying capacity)
interference competition
when two or more organisms directly try to limit access to resources
environmental resistance
factors that limit population growth (competition)- determine K
opportunist
a species that can quickly exploit new resources as they arise
r- selected species
species produce many “cheap” offspring
no parental care
small lives
k - selected species
few “expensive” offspring
lengthy parental care
high ability to compete
low ability to adapt
biotic potential
The capacity of a species to reproduce under ideal environmental conditions
intrinsic rate of increase
R- rate of growth without limitations
population size
number of individuals
population density
number of individuals per area of volume
dispersion
spacial distribution: clumped (most common), even/uniformed, random
age structure
pre-reproductive → reproductive → post-reproductive
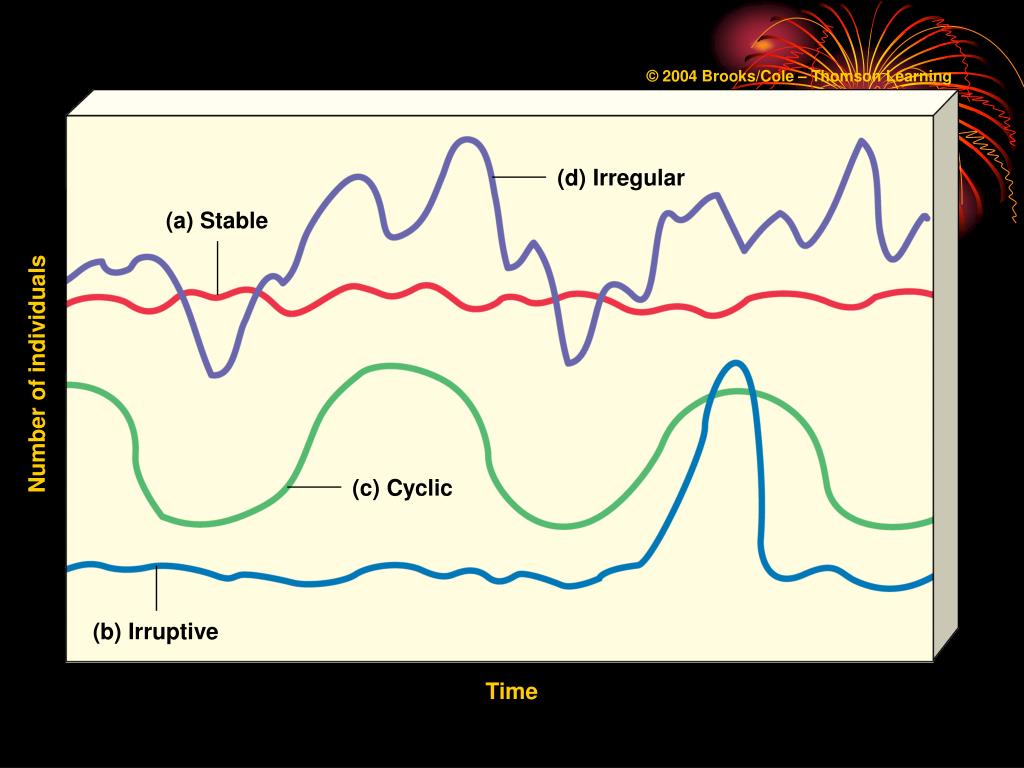
population curves
stable, irruptive, cyclic and irregular
age graphs
type one- late loss (humans)
type two- constant loss (birds)
type three- early loss (turtules)
intermediate disturbance hypothesis
local species diversity is maximized when ecological disturbance is neither too rare nor too frequent. (periodic fires)
inertia/persistence
ability of a system to resist disturbances
constancy
keeps population level stable
resilience
ability to bounce back
theory of Island biogeography
bigger = higher diversity
closer to main land = higher diversity
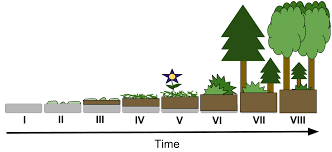
primary succession
establishment without soil LONG TIME (volcanic island- physical weathering/ moss acids)
secondary succession
contains soil (forest fires/ natural disasters)