ISS W2 Sampling
1/66
There's no tags or description
Looks like no tags are added yet.
Name | Mastery | Learn | Test | Matching | Spaced | Call with Kai |
|---|
No analytics yet
Send a link to your students to track their progress
67 Terms
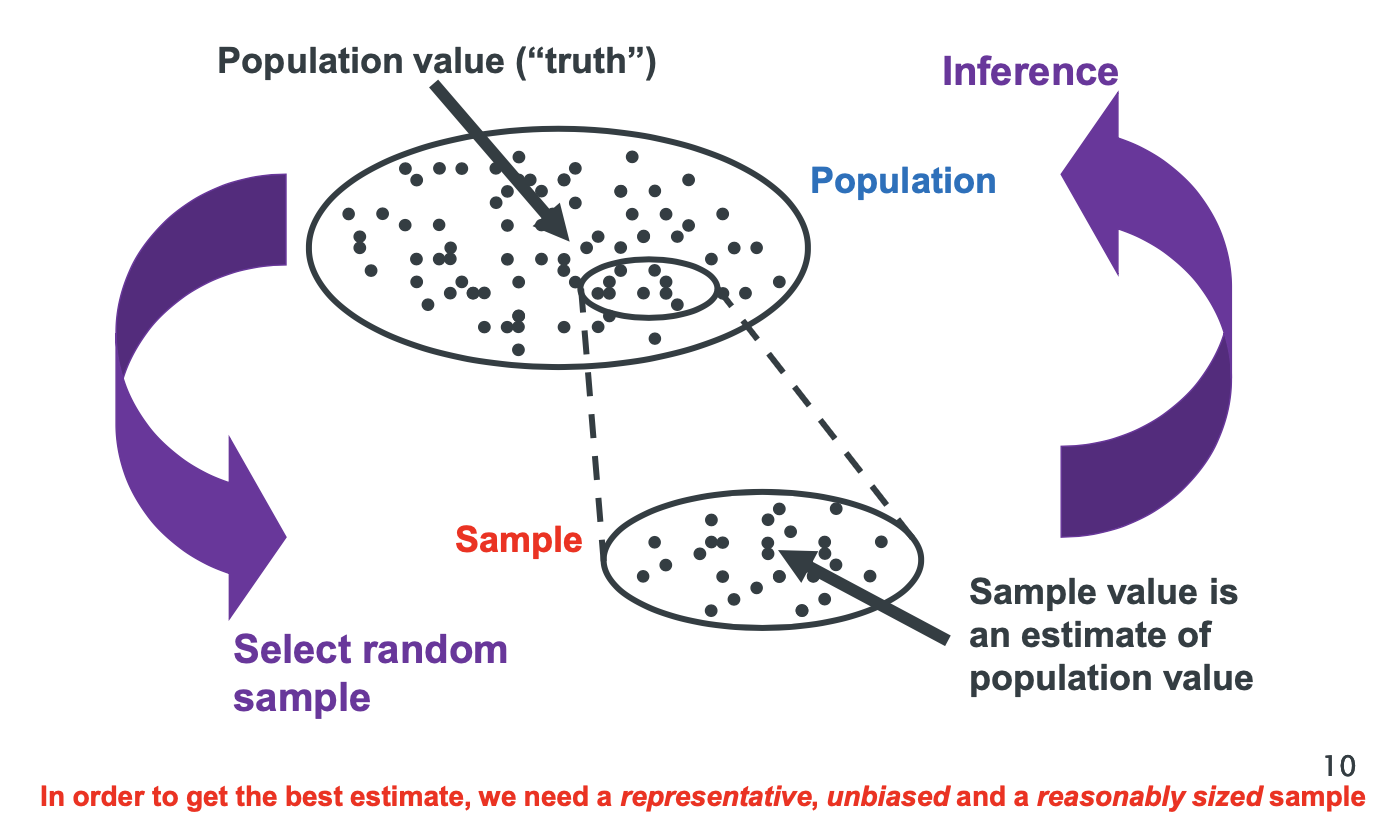
Why do research studies usually involve taking a sample from the population of interest instead of measuring the whole population of interest itself?
When there is a large number of subjects in the population, it is generally impossible to measure everyone - you have limited resources (time, money, labour).
If the sampling process is done appropriately, what features should the sample have?
Representative
Unbiased
Reasonably sized
A miniature of the population of interest.
What do the findings obtained from a sample allow us to do?
Generalise and make reasonable conclusions of the wider population.
Define the study/target population.
The group of people or characteristics we wish to study and about whom/which we wish to make statements, consisting of a large number of subjects.
What is a census?
An official survey of the entire population (usually of a country).
Define a sample population.
The group of people chosen from the study/target population is a “sample” and is considered representative of the qualities of the larger encompassing population, but only if proper sampling techniques are used.
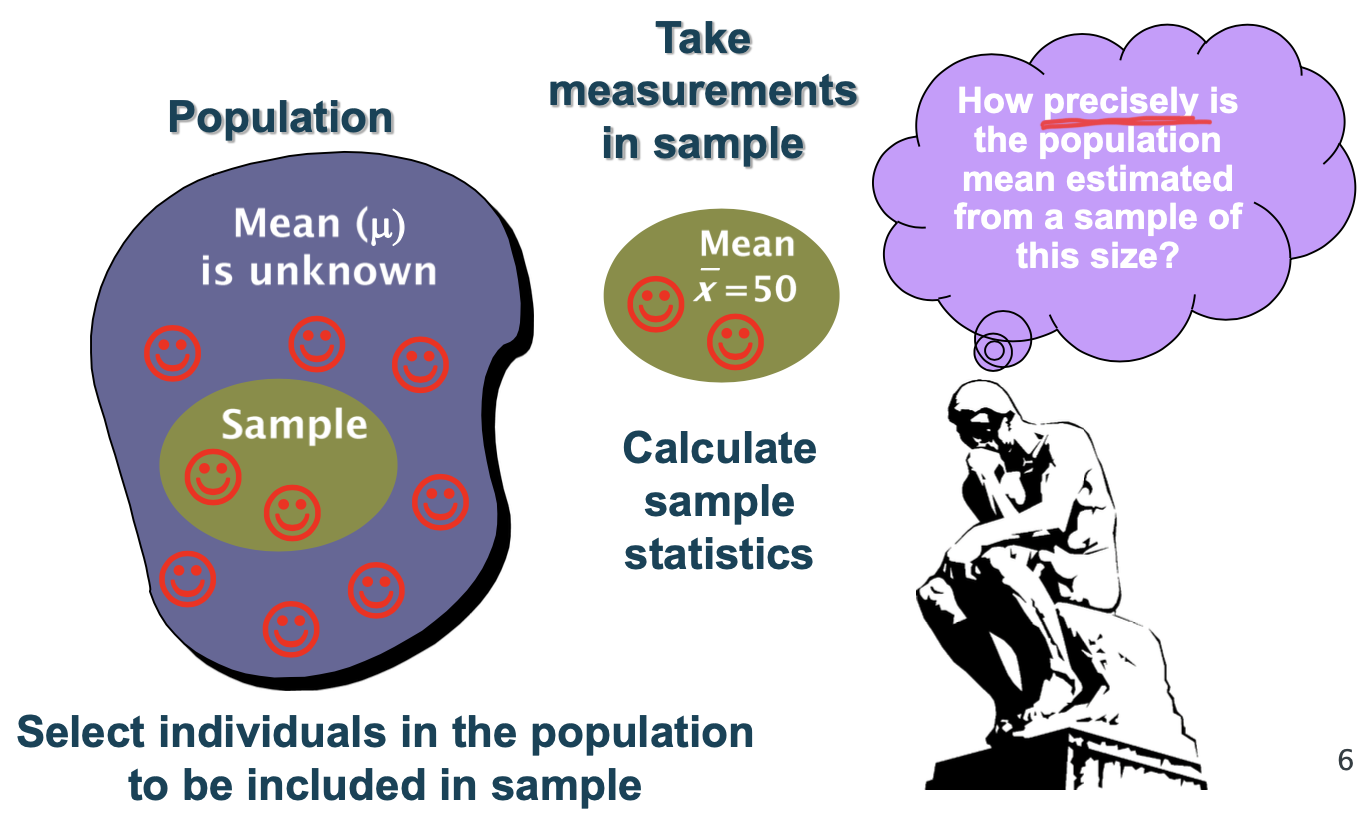
What is the estimation process (4 steps) for sampling a population?
Define your study population
Select individuals in the population to be included in the sample population
Take measurements in the sample
Calculate sample statistics
Sample is to Estimates as Population is to…
…Parameters.
Population is to Parameters as Sample is to…
…Estimates.
What symbol is used to represent the true population mean?
Mu - μ (small)
What symbol is used to represent the number of subjects in the true population?
N (large)
What symbol is used to represent the number of subjects in the sample population?
n (small)
What symbol is used to represent the sample population mean?
x̄ (xbar)
What symbol is used to represent the study/target population standard deviation?
Sigma - σ (small)
What symbol is used to represent the sample population standard deviation?
s or SD
The population is the wider group of interest to the researcher, eventually _____ will be made about this population.
Conclusions.
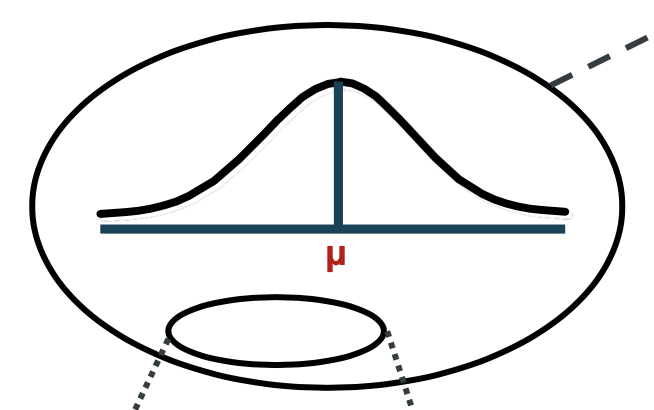
Assuming the variable of interest is Normally distributed in the population, its distribution is completely described by its ___ (__) & ___ ___ (__)
mean (μ)
standard deviation (σ)
When studying a Normally distributed variable in the population, in what is our primary interest?
In the mean (μ).
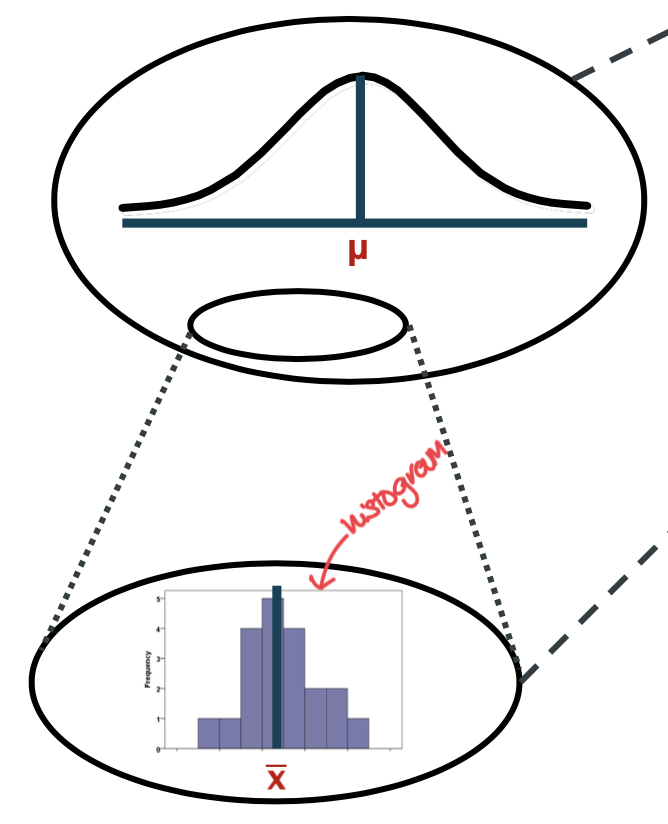
If the study sample is ____ of the wider population, its mean (x̄ ) can be taken as an estimate of the true population mean (μ) i.e. the sample results can be ____ to the wider population
Representative
Generalised
What is statistical inference?
The theory, methods, and practice of forming judgements about the parameters of a population and the reliability of statistical relationships, typically on the basis of random sampling.
What 3 features do we look for in a sample population?
Representative
Unbiased
Reasonably sized
What 2 features govern how well/precise the sample mean (x̄ ) is as an estimate of the true population mean (μ)?
How the sample was taken
The sample size
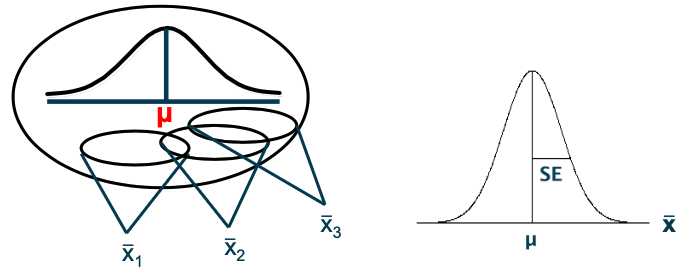
On what is the statistical theory based regarding how precise the the sample mean (x̄ ) is?
Hypothetical repeated samples, where each repeated sample would yield different values for x̄ and SD.
Is the Normal distribution of an individual sample mean (x̄ ) likely to be wider or tighter than that of the mean of all the sample mean (x̄ infin)?
The Normal distribution of an individual sample mean (x̄ ) is likely to be wider than that of the mean of all the sample mean (x̄ infin).
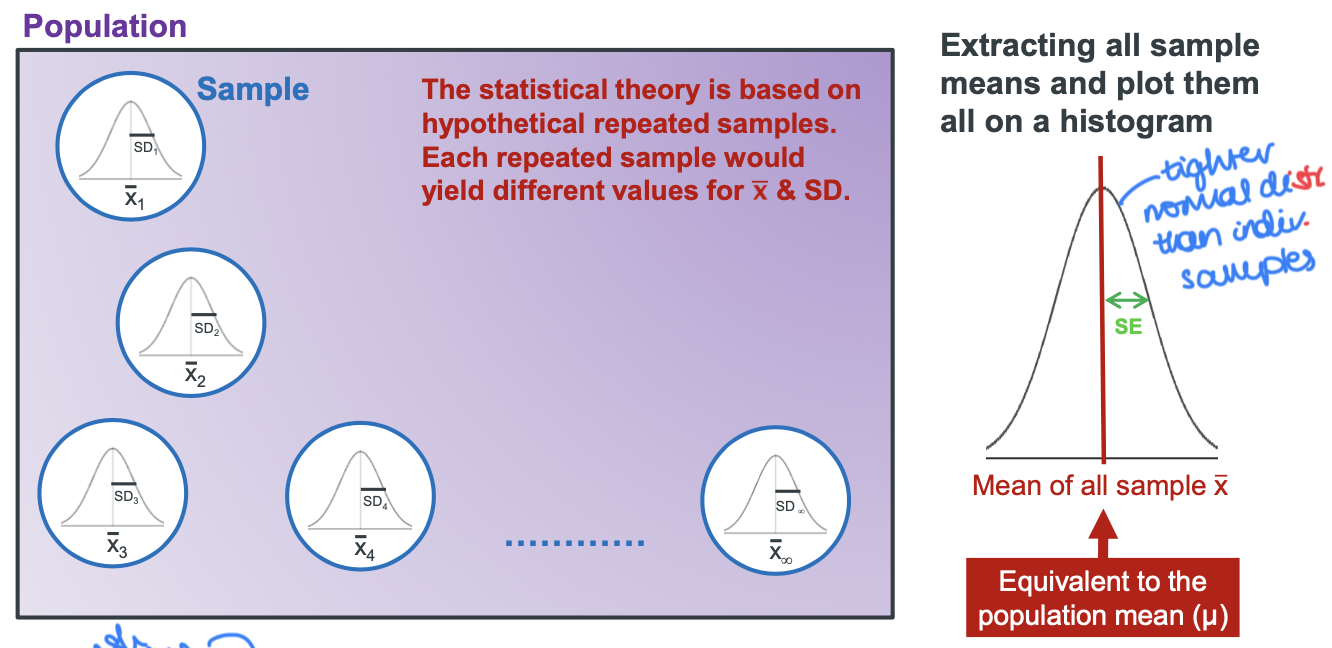
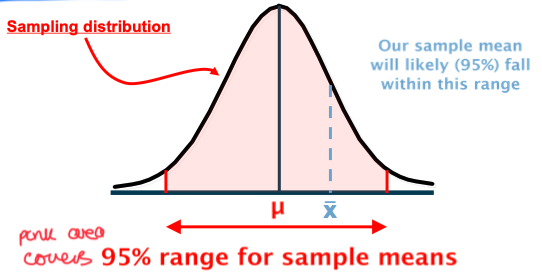
What is the distribution of hypothetical repeated sample means called?
Sampling distribution for the mean.
What does the sampling distribution reflect?
Sampling variability.
Rearrange these words to make another statement that means the same thing: “sampling distribution for the mean”
Distribution of sample means.
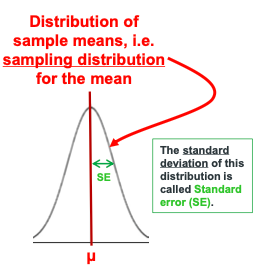
The standard deviation of the sampling distribution is call the ___
Standard Error (SE) or Standard Error of the Mean (SEM).
What does the Standard Error describe?
It estimates the spread of sample means (x̄infin) about their underlying population mean (μ).
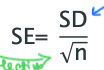
What is the equation relating the Standard Deviation and the Standard Error?
If the population variability is wide, is the Standard Deviation large or small?
The Standard Deviation will be large.
If the population variability is narrow, is the Standard Deviation large or small?
The Standard Deviation will be small.
Mathematically, if your sample population (n) is larger, what happens to the value of the standard deviation?
The Standard Deviation gets smaller.
Mathematically, if your sample population (n) is smaller, what happens to the value of the standard deviation?
The Standard Deviation gets larger.
What is the denominator in the Standard Error formula?
The square root of the number in the sample population.
What is the numerator in the Standard Error formula?
The Standard Deviation of the sample mean (x̄)
If there is larger population variability (σ), how will this affect the sample variability?
There will be a larger sample variability denoted by a wider Standard Deviation.
Sample means from LARGER samples show ___ variability in the sampling distribution than from smaller samples because ____…
less
these sample means would be clustered closely around the population mean
μ ± 1.96 x SE covers __ % of sample means?
95
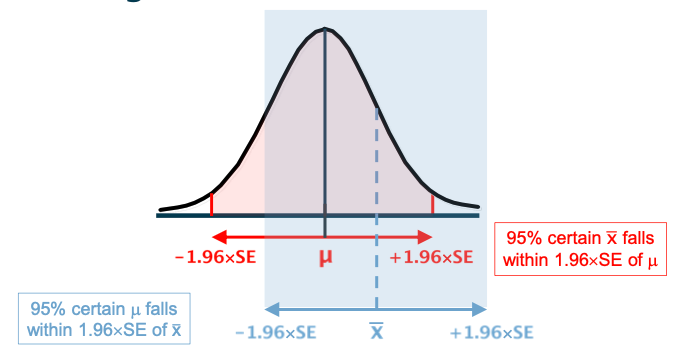
What is the relationship between μ , x̄ , and the SE in a Normal or “reference” range?
We are 95% certain x̄ falls within 1.96xSE of μ, so we can conclude that a range of ±1.96xSE centred on x̄ is likely to cover the unknown mean μ with the same probability of 95%.
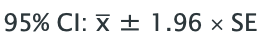
What is the formula for calculating Confidence Intervals (CIs)?
Sample mean x̄ ± 1.96 x Standard Error
When calculating CIs, why is the ± symbol important?
The ± sign yields two values for the two ends of the CI
__ values within the confidence interval (CI) are ___ values for the population mean (μ) that generated the observed sample
All
Resonable
If any value in the CI range should be considered as a possible “true” value, i.e. a possible value for unknown μ, what does the CI range indicate?
CIs indicate the preCIsion of the estimate from the sample size (n) available.
The divisor sqrt of n means that as the sample size gets ___, SE becomes ___, the CI then gets ___.
Larger
Smaller
Narrower
With a narrower CI, we can be ___ confident of the ___.
More
Precision
A ___ sample would be anticipated to give a more precise estimate of the mean and have a ___ precision interval.
Large
Narrower
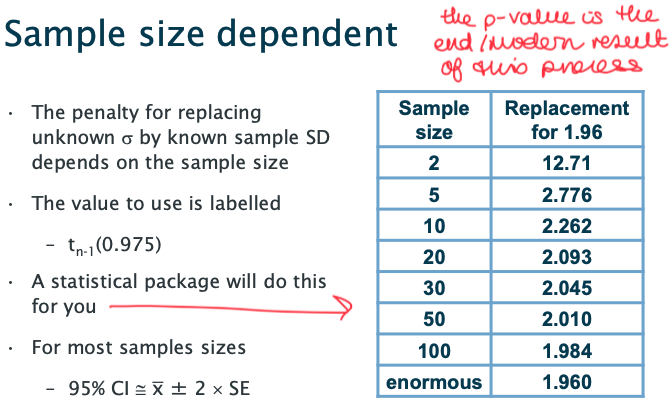
What is the replacement multiplier when working out confidence intervals for the SE?
The t-value.
What size of sample would affect the t-value when working out the SE?
From 2 - 100; after that, 1.96 occurs.
If the 95% Normal Range describes the spread of data, what does the 95% Confidence Interval do?
Gives the precision of the estimated mean.
If the 95% Confidence Interval gives the precision of the estimated mean, what does the 95% Normal Range do?
Described the spread of data.
What does the 95% Normal Range cover?
95% of the values of the variable.
What does the 95% Confidence Interval cover?
the “true” mean 95% of the time (in repeated hypothetical examples)
The statistical theory says that when a variable follows a Normal distribution in the population, repeated ___ ___ will follow a Normal distribution
sample means
The statistical theory says that when a variable follows a skewed distribution in the population, repeated sample means will follow a ___ distribution
Normal
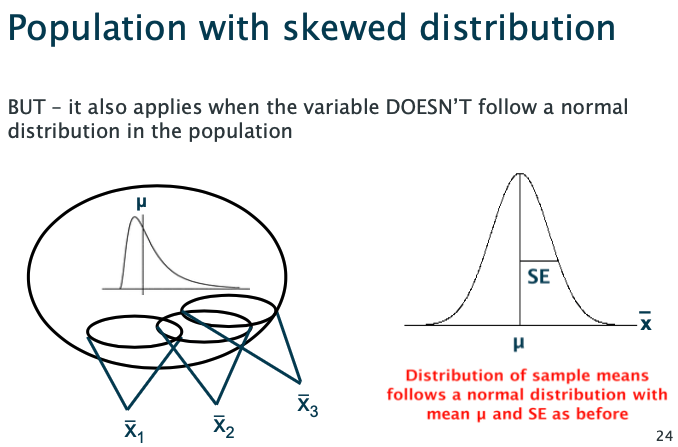
Does the statistical theory that says “when a variable follows a skewed distribution in the population, repeated sample means will follow a Normal distribution” apply for all samples?
No, it only applies for large samples, e.g. n>30.
Define “asymptotic”.
Approaching a value or curve arbitrarily closely; it describes limiting behaviour.
What 5 considerations are important for sampling?
Sampling unit (animal / patient / household / GP prac)
Study population (general pub / all patients / incl & excl criteria)
Sampling frame (list or database with information on study popn)
Sampling methods (random / stratified / cluster / convenience)
Sample size
How do you select a sample that is representative of the population?
Take a random sample.
How can you obtain a random population sample?
List possible participants; assign a unique identifier; generate a random number (omitting repeats); where random number = unique identifier = participant.
What does oversampling lead to?
Bias
What is oversampling?
Individuals from the higher or lower regions of the population are disproportionately represented in the sample population.
Define statistical bias.
The sample means are centred around a value other than μ
What type of analysis can be done to ensure estimates are unbiased and with correct standard errors?
Weighted
What are three other sampling methods other than random?
Cluster
Stratified
Convenience
What does the Confidence Interval encompass when looking at a non-random (convenience) sample?
Sampling variability for the same non-random approach, not necessarily an estimate of the population mean i.e. x̄ might be miles away from μ due to bias.
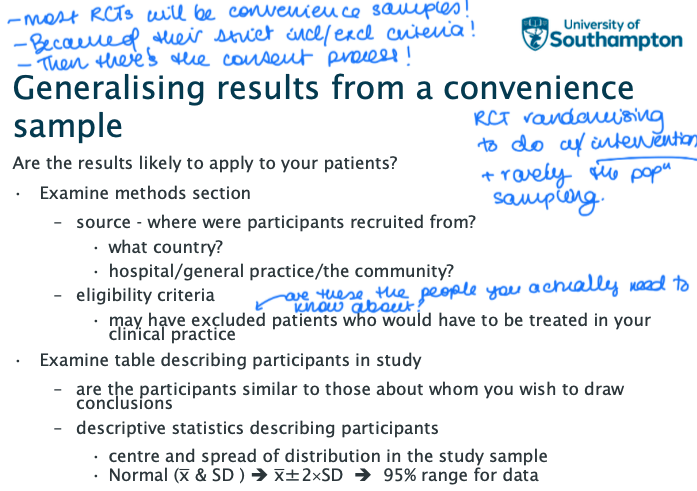
What points must you review when determining whether the results of study apply to your patients?