Lecture 2: Central Tendency and Variability
 Call Kai
 Learn
Learn Practice Test
 Spaced Repetition
 Match
Match Flashcards
 Knowt Play
1/40

There's no tags or description
Looks like no tags are added yet.
Name | Mastery | Learn | Test | Matching | Spaced | Call with Kai | Chat |
|---|
No analytics yet
Send a link to your students to track their progress
41 Terms
Interpolation
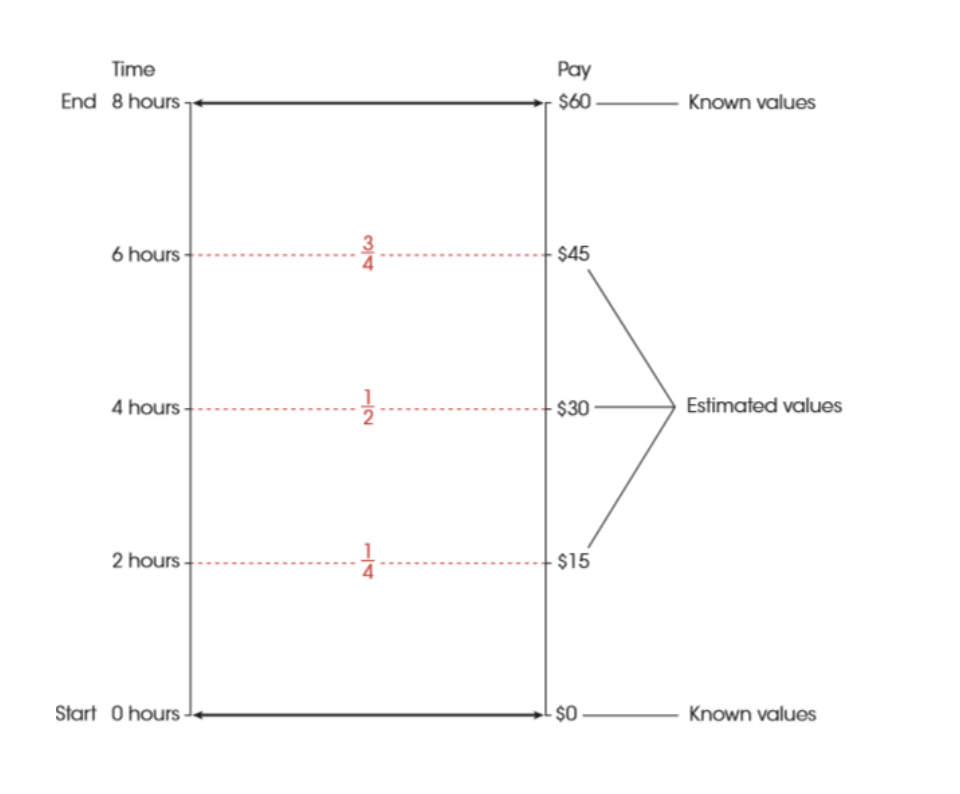
estimating percentile ranks not defined
e.g. job wages estimations (eight hours work = $60, how many hours to get $30 = half or four hours)
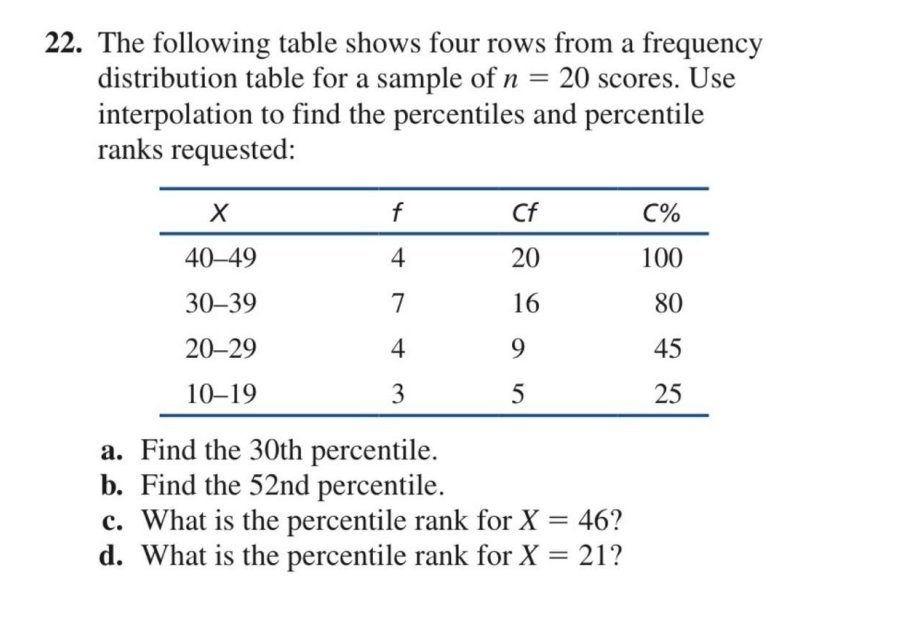
How to solve percentile
Solve each problem
e.g. score, asked for percentile rank
30th percentile rank
You know that it is between 25 and 45 cumulative percentile (or the percentile percentage is the better def) on the graph
interval width = 10
percentile = 45 - 25 = 20
Intermediate value of the interval
e.g. 30 percentile rank, fraction = (45-30)/20 = 15/20 = 0.75 (or 75 percent of the way to 45) (between 25 to 45 ranking, it is 75 percent to 45)
Determine positions on the new scale
Distance = 0.75 ×10 = 7.5 units
Use distance from the top to determine new position: percentile = 29.5 - 7.5 = 22
For 52 percentile
interval width = 10
percentile = 80-45 = 35
intermediate value = (80-52)/35 = 0.8
Position: 39.5 - 0.8 × 10 = 31.5
What is the percentile rank for X = 46?
Interval width = 10
Percentile width = 20
Intermediate value: (49-46)/10 = 0.3
Position = 100-0.3×20 = 94 percentile
What is the percentile rank for X = 21
In 20-29 interval = 10 width
percentile width =
Central Tendency
tendency towards the center of the distribution
An informative, representative of the population
Depends on the type of distribution you have
Three major measures that have diff properties used in diff situation
Mean
Median
Mode
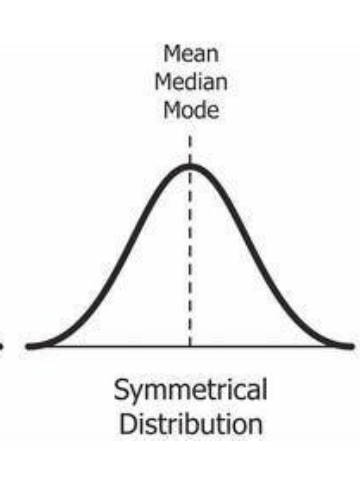
In the normal distribution all three are very similar - expected, hopefully result
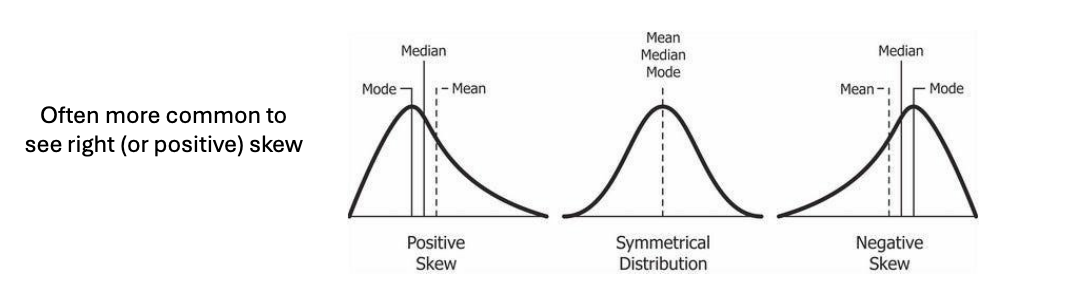
Types of not normal = skew = three measures not similar and mean is not presentative of the results
Positive skew: mean is higher than the mode and median
Disproportionally more low values and less high values
Negative skew: mean is lower than the median and mode
Disproportionally more high end cases and fewer low cases
Therefore, have to use the proper measure, rather than always going for the mean
Means
main def
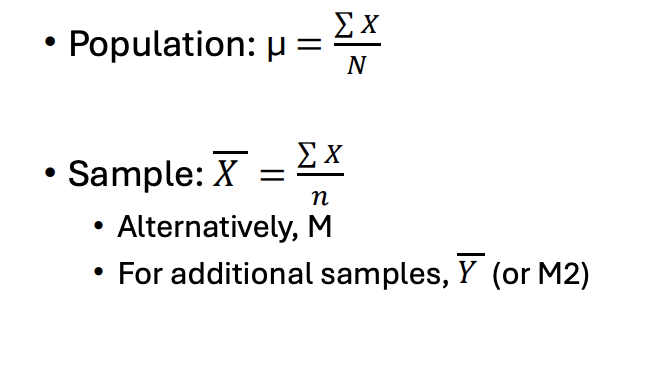
population symbol and equation
Use of means
the arithmetic average of all scores
Influenced by extreme scores and mean is easily affected
Population: mu symbol
Use for data in interval or ratio scales
More useful for symmetrical distributions (normal)
most statistics based on means
Salary is not summarized with means
Typically positively skewed, therefore not useful
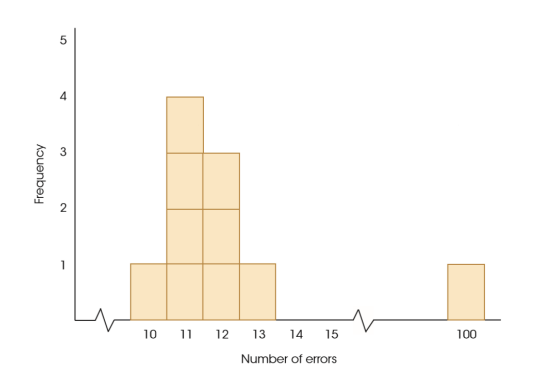
Outlier
an extreme score
Often extreme high values (range from 0 to infinity)
Only one is enough to throw the entire mean
Common when sample sizes are smaller
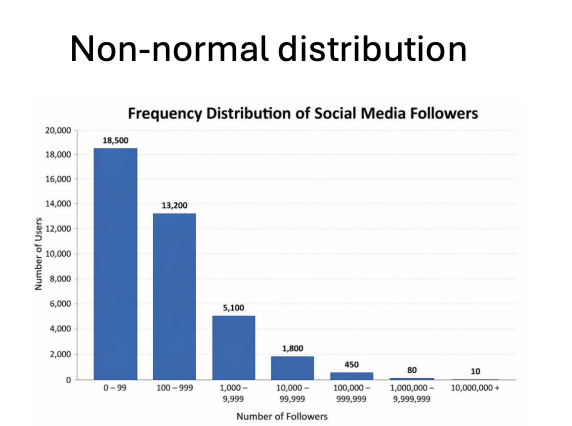
Non-normal distribution - open-ended
range from something to infinity (no limit)
e.g. number of followers (0 to more than millions)
Positive skewed is likely
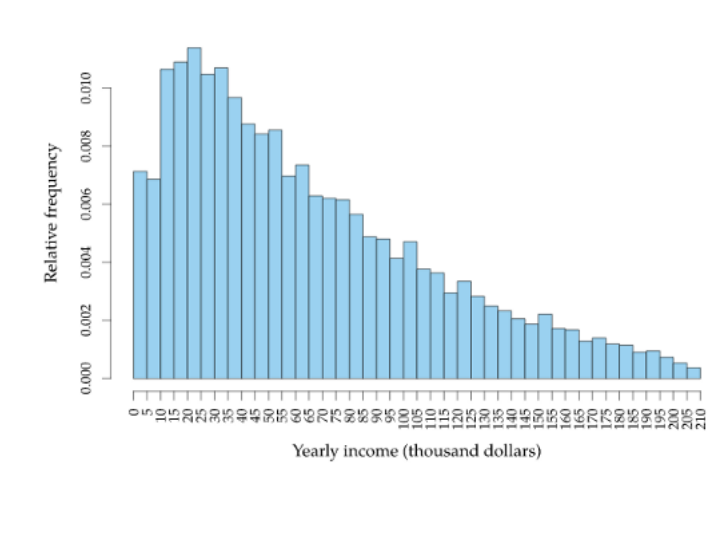
Image: the intervals are inconsistent
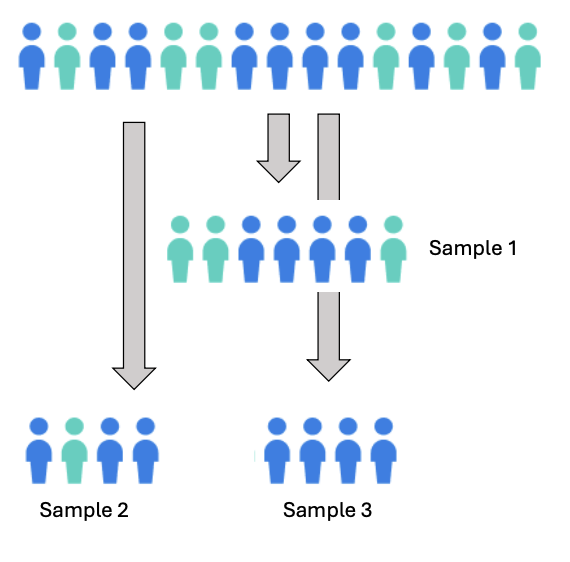
Multiple samples, multiple means
Multiple samples from the same population
May range in diff sizes
Due to sampling error, not every mean will be the same
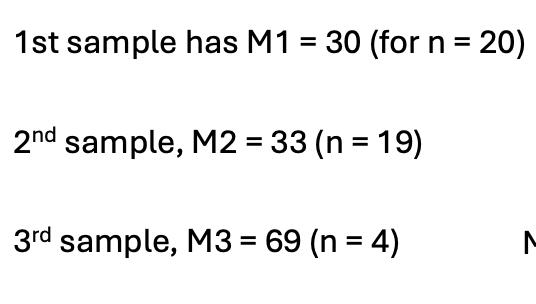
The default approach
how to calculate the mean with multiple sample sizes
The better approach (solution)
take the mean of all the means
Mean = (M1 + M2 + M3)/3 = 132/3 = 41
Issue: the sample sizes are different, and still treating each of them equallly
Solution: weight them according to the sample sizes
e.g. like grades
Weighted Mean = M1 20/43 + M2 19/43 + M3 * 4/43 = 34.9 - mean is more smaller (better representative)
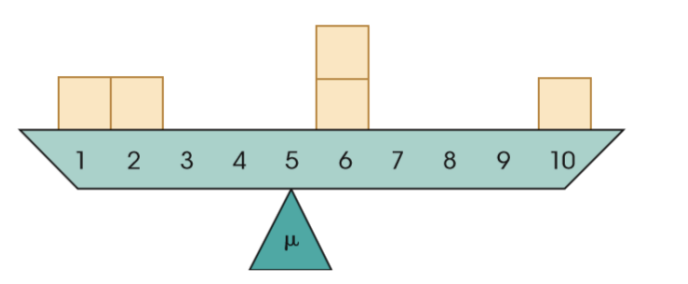
View: The mean as a “balance point“
calculate for example
distance of scores below mean = distance of scores above mean
e.g. 7 below and 7 above
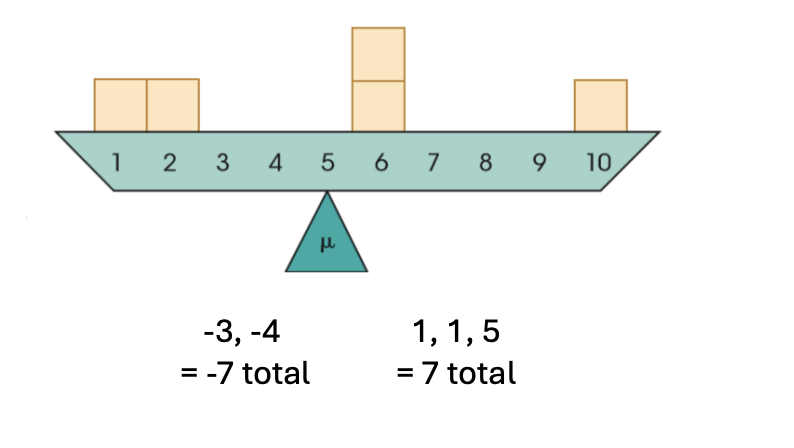
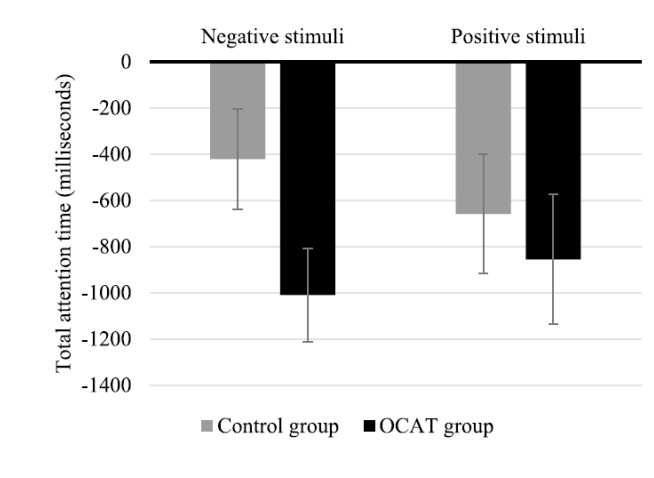
Delta Scores
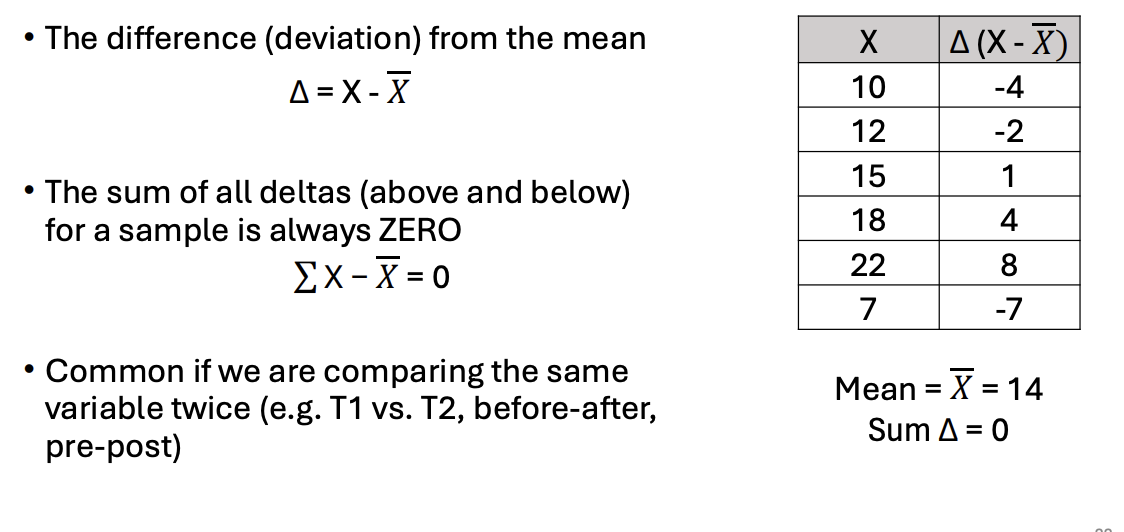
The deviations from the mean
Sum of all deviations is 0 (the balance point view)
e.g. change in attention time following training
Negative stimuli vs positive stimuli or change time spent after stimuli
What happens to the mean if…
You replace a single score with one of a different value?
You remove a score?
You multiple ALL scores by a constant value (e.g. X * 4)?
You divide ALL scores by a constant value (e.g. X / 5)?
The mean changes
The mean changes
mean multiples by 4
The mean divides by 5
Median
main def
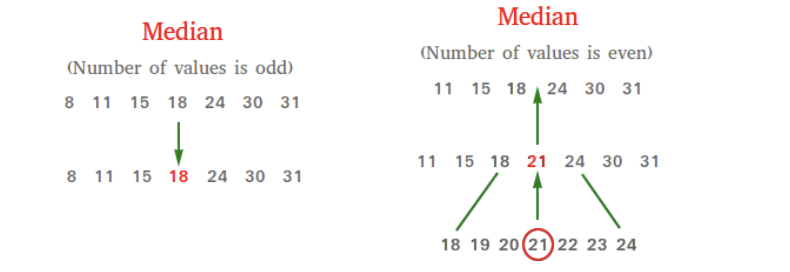
diif strats to calculate (odd vs even)
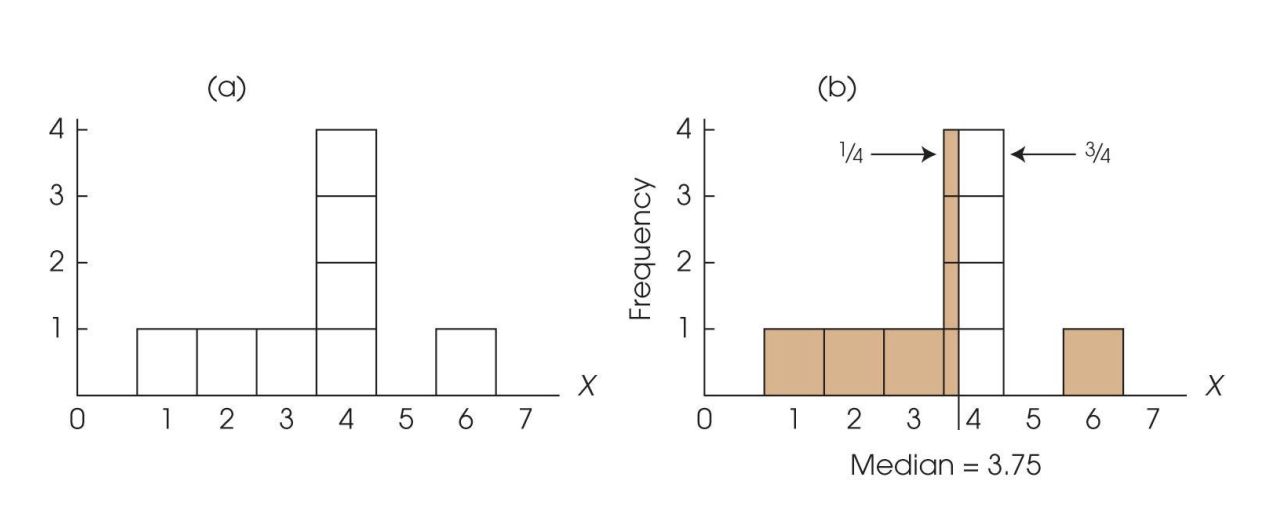
midpoint in a group of rank-ordered scores, separates distribution into 2 equally-sized groups
Diff strats
if n = odd and no repeats, the median is the middle score
if n = even number, no repeats, median calculated between two scores closest to the middle
For cases in the same value, it is harder to find the median
useful for ordinal (rank-ordered) data
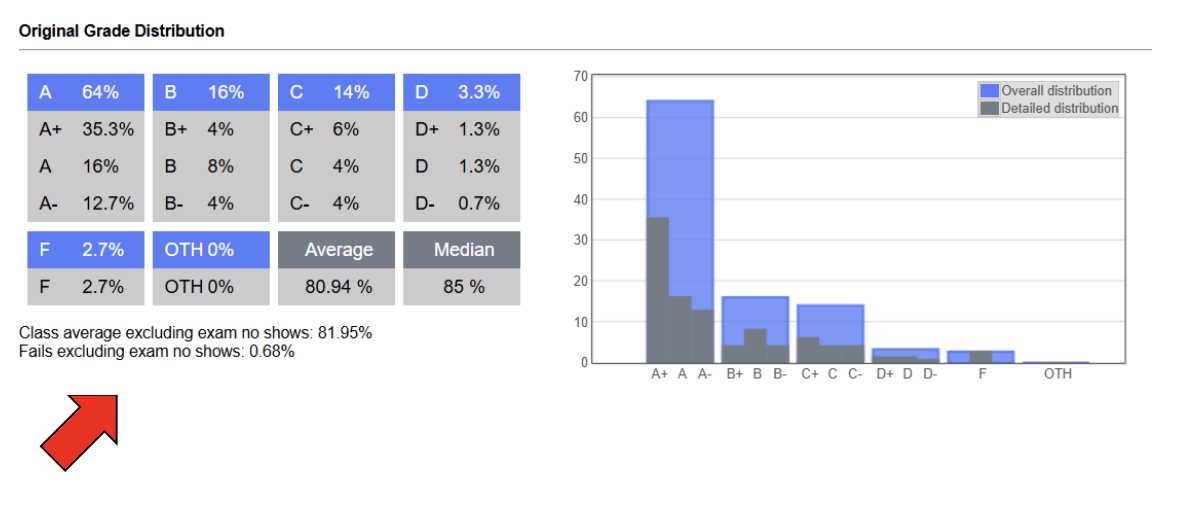
Useful for data not normal/skewed (e.g. in the image
e.g. salary (median is lower than the mean)
Case: Likert scales
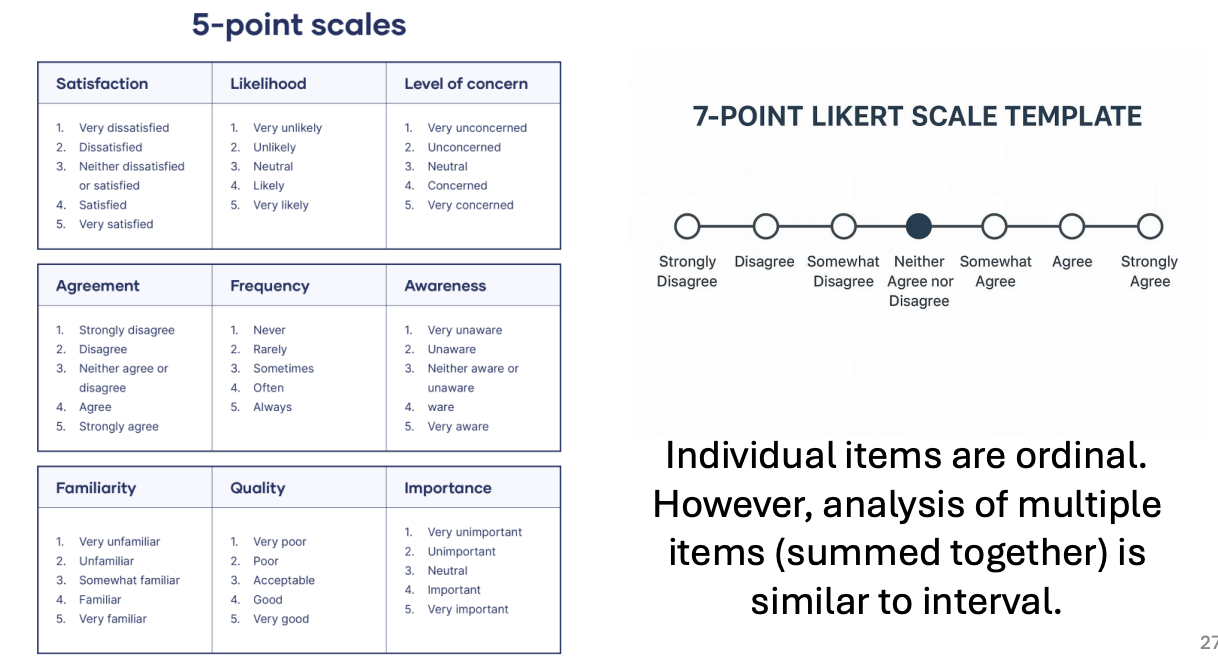
data is ordinal (where rank matters)
e.g. agreement (strong disagree, disagree, etc)
Summing multiple items, totals more often works better with means
Finding medians
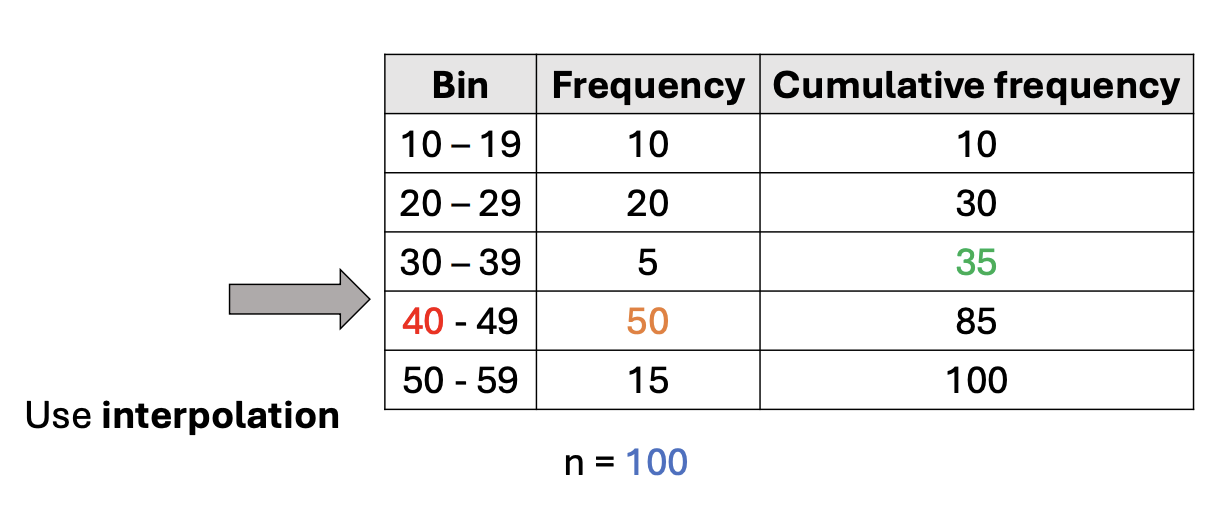
Interpolation
Median = Lower limit of interval + (𝑛/2 – prior cumulative f) / f class width Median = 39.5 + ((100/2 – 35)/50) 10 = 42.5
For repeating scores
relook
Mode
Strict definition: most common score in the distribution (than neighbouring values; highest frequency)
Informal def: Score that is more common than nearby scores
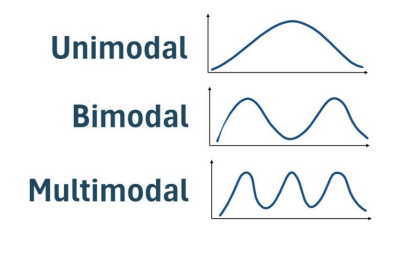
There can be one mode or several modes (multimodal)
e.g. in grades
unimodal vs bimodal vs multimodal
Bimodal is still considered symmetrical
Best for nominal (the most common) data
1, 2, 3, 4, 4, 4, 4, 6
find the mean, median and mode
mean:
Median:
Mode: 4
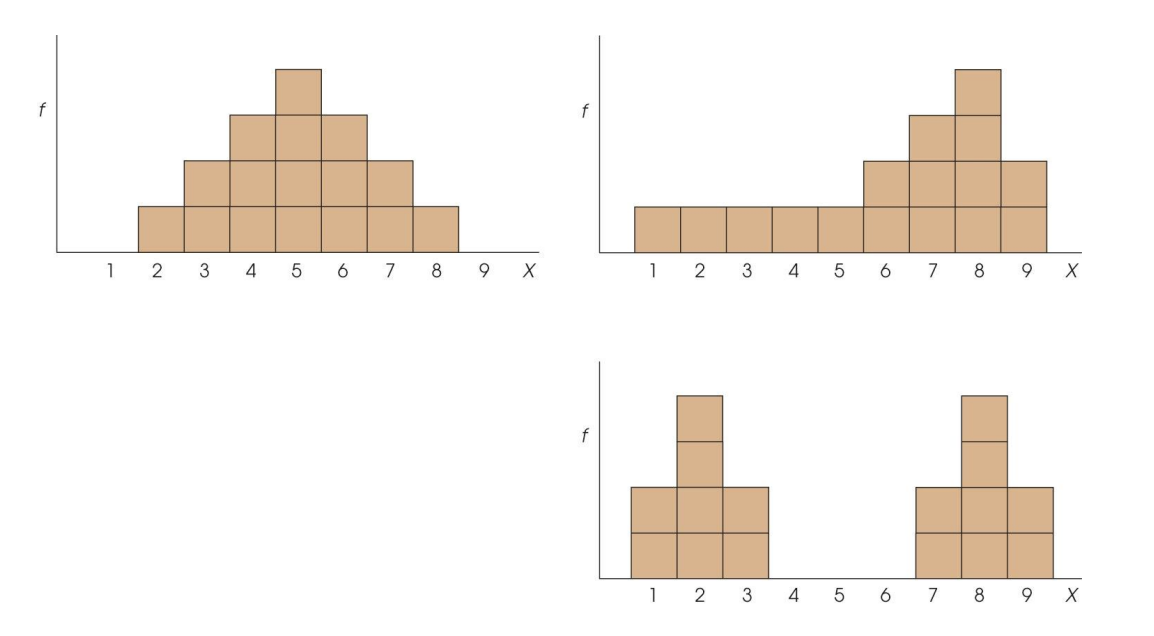
which measure would you use in each case
first: mean
Second: median (skewed)
Third: bimodal
Means can also be used for bimodal (often an exagerating)
Normal distrubution all measures
mean= median = mode
The case of missing data or strongly unreliable data
what do you do? what do you replace it with
Possible things individuals will do
replace with mean/media/mode/remove entirely
Cause: maybe an error in the recording device or unusual response patterns
reminder: to state it happened and expect to get criticized for it
e.g. exam grades
removed entirely
A median is the midpoint between the highest and lowest scores (i.e. the range of the population).
TRUE or FALSE
Of the three measures of central tendency, which is the only one which MUST correspond to actual score in the data?
A distribution has both median < mean and mode < mean. What type of distribution is it?
A median is the midpoint between the highest and lowest scores (i.e. the range of the population).
TRUE or FALSE
The number of score - not the middle range + there may be repeats
Of the three measures of central tendency, which is the only one which MUST correspond to actual score in the data?
mode (median and mean may change due to outlier = may not be representative)
A distribution has both median < mean and mode < mean. What type of distribution is it?
Positively skewed
Variability
quantitative measure of the differences between scores in a distribution and the degree to which they cluster/are spread out
Three measures: Standard deviations, variance
Deviation: how far score differs from the mean
Variance: the avg of the squared deviations
Standard diviation: the square root of the variance
Difference in sample variable and population variance
sample variation underestimates population variance
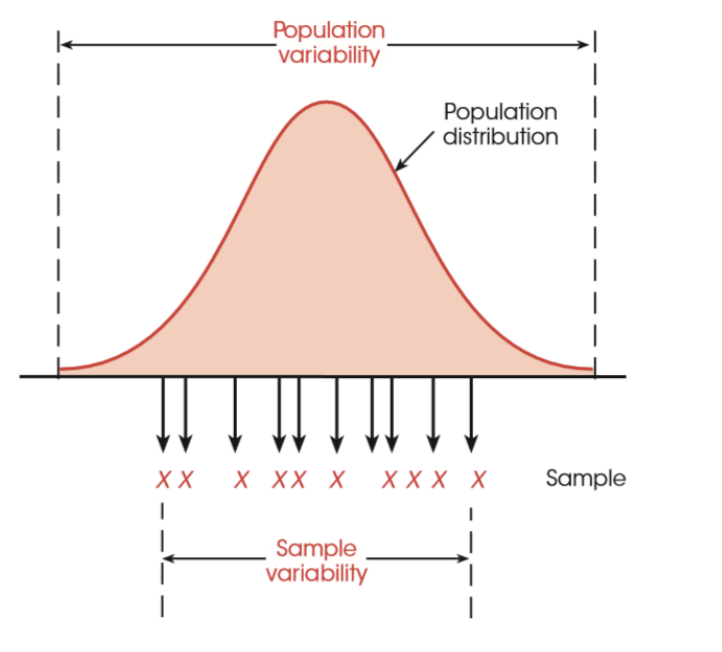
Standard Deviation (SD)
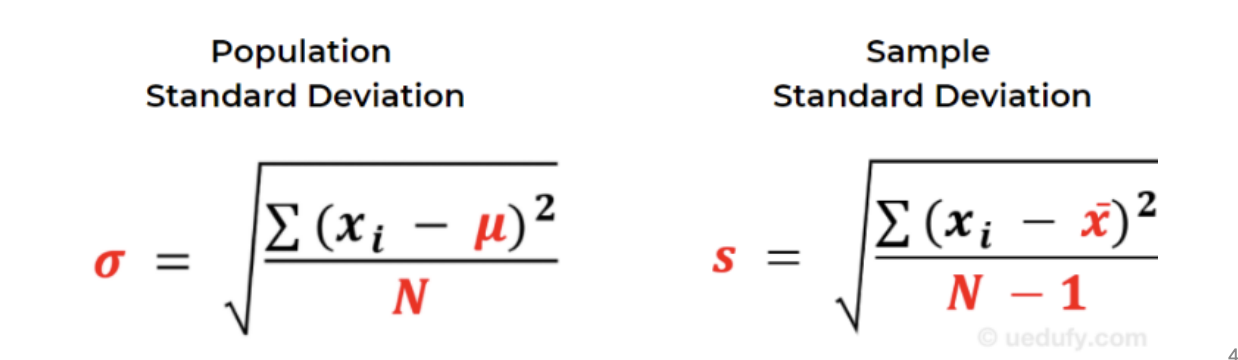
equation for sample and for population
Squared: to work with positive values
N - 1 used instead to correct the idea that the variability is going to be less than the actual population
Mu = mean
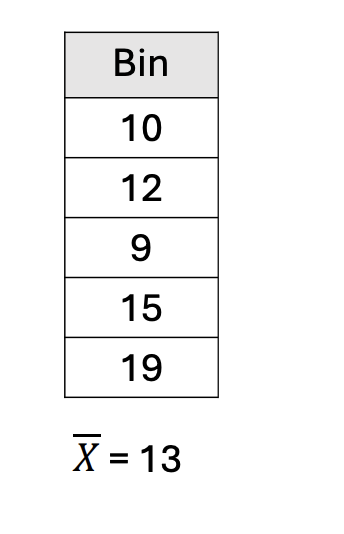
Practice
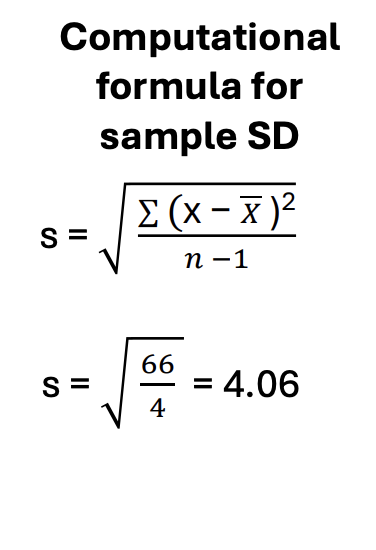
Standard deviation - when the mean is not whole in sample SD
what equation is used
mean not whole is tedious to calculate
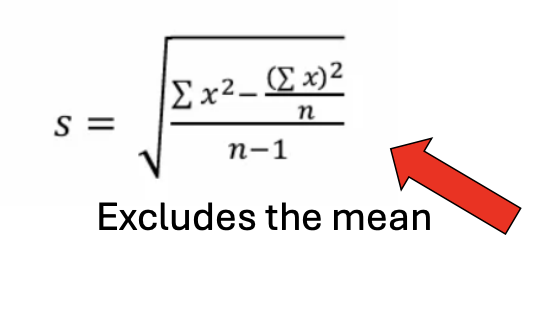
The sum of squares
Sum of squares = the numerator of the equation for SD
For populations:
Definitional: SS = (X - µ)2
Computational: SS = X 2 – (X) 2 N
For samples:
Definitional: SS = (X - M) 2
Computational: SS = X 2 – (X) 2 n
Purpose of n-1
because the sample are less variable, used as an error variance, related to degrees of freedom
Summary of SD
• A line outward from the mean • Adding a constant to all scores affects the SD in the same way • Multiplying all scores by a constant affects the SD in the same way
Why is variability bad in results?
hard to reliably detect if there are effects
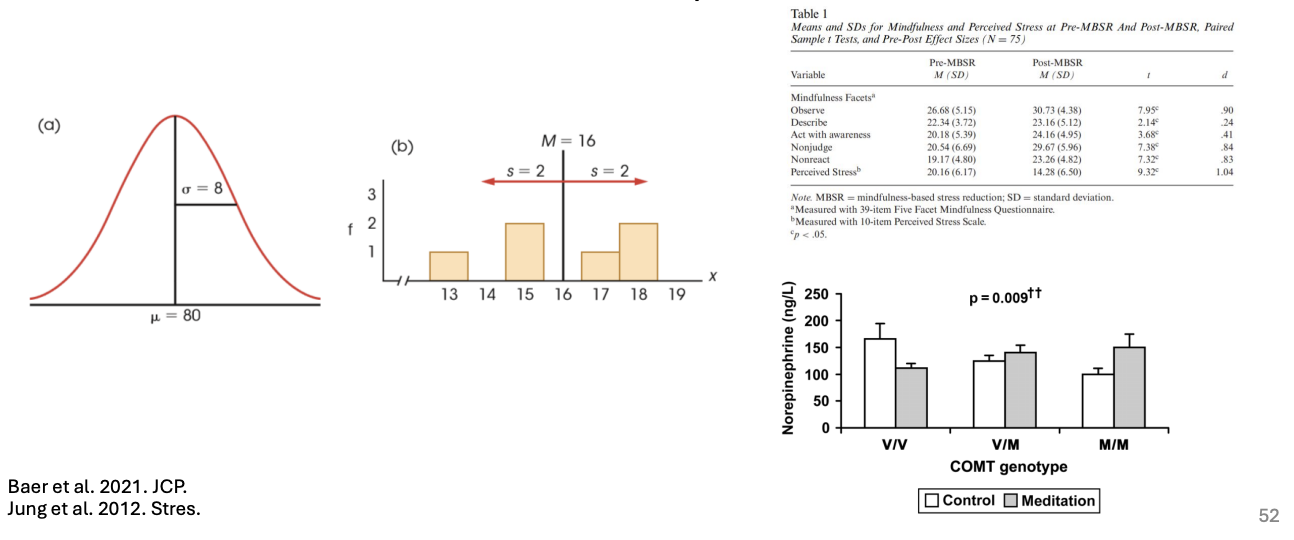
Data visualization
mean with variability measure
Variance
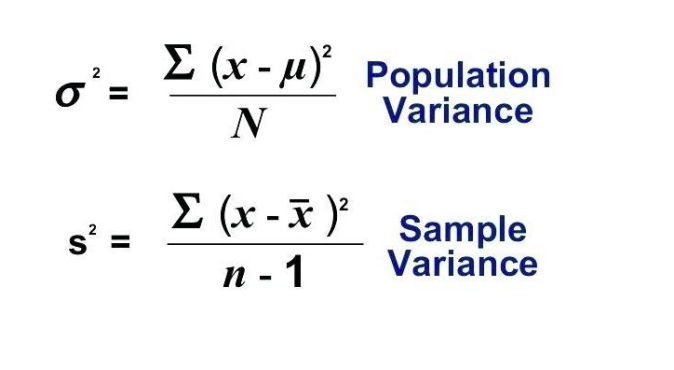
variance = SD²
If you add a constant to all scores in the population, how do the mean and standard deviation change?
If you multiply all scores in the population, how does the standard deviation change?
Comment on the two following distributions:
M = 1000, SD = 100 vs. M = 300, SD = 100
If you add a constant to all scores in the population, how do the mean and standard deviation change?
Mean changed by constant value
SD changes by the same amount
If you multiply all scores in the population, how does the standard deviation change?
Comment on the two following distributions:
M = 1000, SD = 100 vs. M = 300, SD = 100
SD is very high compared to M = less likely a normal distribution
Coefficient of variation (CV)
CV = population standard deviation/mean
SD as a percentage of the mean
Higher value = the distribution is not normal
is COV is high.= positive skew
Data transformation
Distribution is not normals = raw scores problematics = other options
Transform data (e.g. take the log; easier to appreciate the value)
or alternative methods
Comparisons - how to approach potential difference in diff samples
Relative performance - comparisons in SD
e.g. samir 76 is very high from the standard deviation (very high standing in the cohort)
e.g. Rheanna 76 is within tht eSD (middle standing within the cohort)
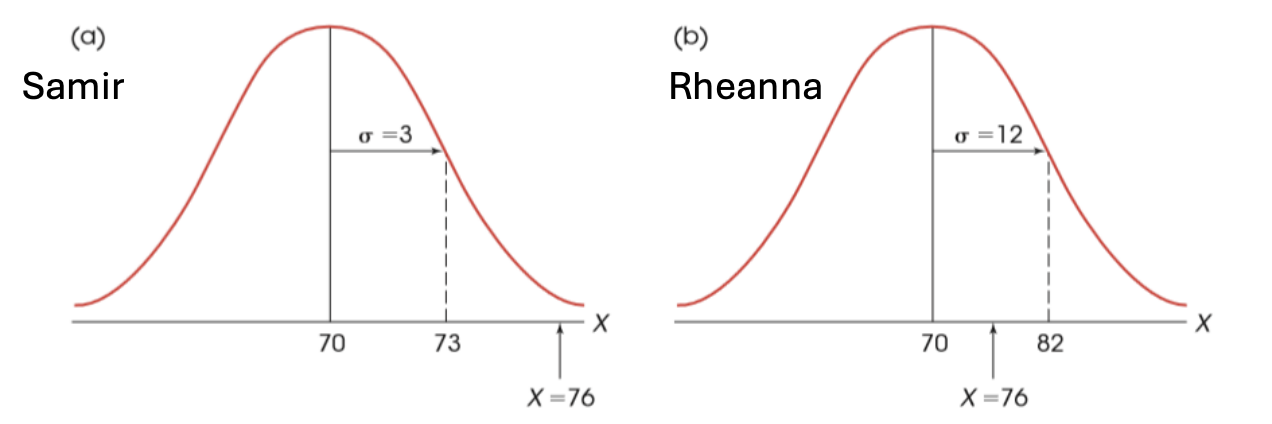
Z-score method
standardizing distributions to make scores in each comparable
Same mean = 0 and same SD = 1
Compare ranking
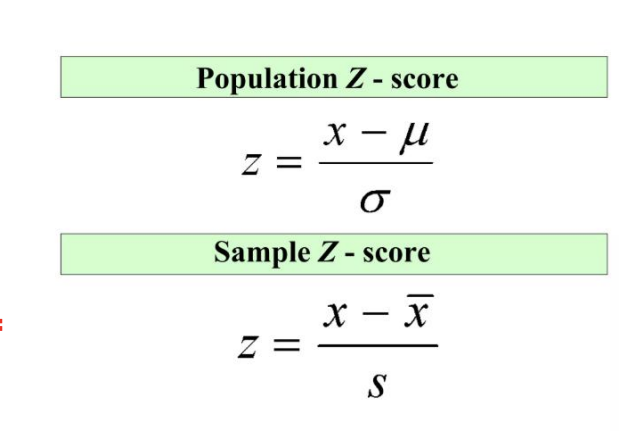
The Z score approach
A Z score is effectively the deviation of a score from the mean in terms of SD units
e.g. Samir is 2 SDs away, very high outlier
e.g. Rheanna is 0.5 Sds away, not unnormal
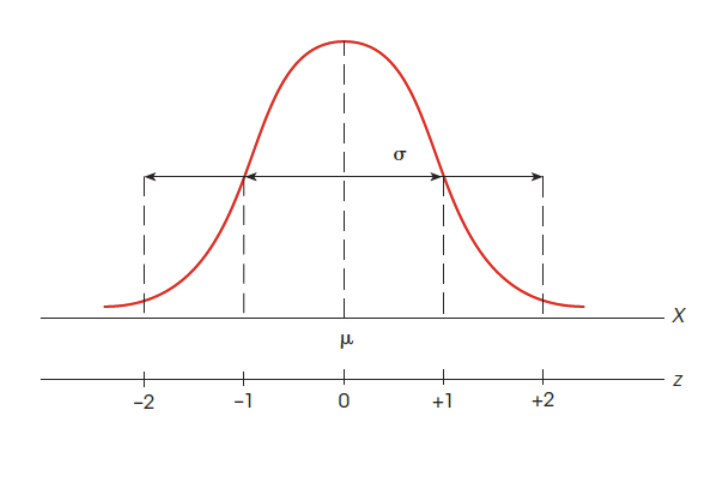
Z score distribution
mean = 0
SD = 1
Sign: + or - refers direction - matter in calculations for the z score
Numerical value: the magnitude
Does transformation change the distribution shape
Transformation does not change distribution shape
Does transformation change the shape of distributions?
In a population with a mean of μ = 65, a score of X = 59 corresponds to z = −2.00. What is the standard deviation for the population?
In a population distribution, a score of X = 54 corresponds to z = +2.00 and a score of X = 42 corresponds to z = −1.00. What are the values for the mean and the standard deviation for the population?
Does transformation change the shape of distributions?
No
In a population with a mean of μ = 65, a score of X = 59 corresponds to z = −2.00. What is the standard deviation for the population?
In a population distribution, a score of X = 54 corresponds to z = +2.00 and a score of X = 42 corresponds to z = −1.00. What are the values for the mean and the standard deviation for the population?