Quantitative Methods Midterms
1/76
There's no tags or description
Looks like no tags are added yet.
Name | Mastery | Learn | Test | Matching | Spaced |
|---|
No study sessions yet.
77 Terms
Research
a systematic and unbiased way of solving a problem through generating verifiable data
Research
a systematic and organized process of inquiry that aims to discover, interpret, and develop knowledge or understanding of a particular subject or phenomenon.
Research
is a fundamental tool used across various areas and sectors to advance knowledge, solve problems, innovate, and make informed decisions.
Why Research?
Expand knowledge
Solve problems
inform decision-making
improve practices
innovate
address societal challenges
foster critical thinking
Research in Various Discipline
business
humanities
natural and applied science
social science
How to do research?
Develop and select a topic
- Develop Research Questions
- Identify Keywords
- Find Background Information
- Refine a Topic.
Locate information
Evaluate and analyze information
Write, organize, and communicate information.
Cite sources.
How to do research?
Experiments
Surveys
Interviews
Case studies
Observations
Characteristics of a Good Research
Rigorous
Controlled
Accurate
Clear
Concise
Valid
Verifiable
Sequential
Precise
Original
Coherent
Generalizable
Organized collection and Analysis of Numerical Data
quantitative methods rely on these to investigate specific research questions and test hypotheses.
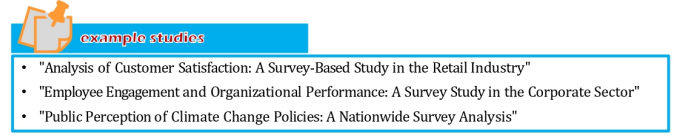
Survey
gathers data from a group of people through questionnaires or interviews, focusing on numerical information like ratings or Likert scale responses
this data collection method helps understand people’s opinions or experiences in a structured way.
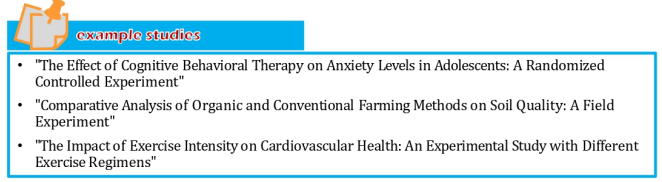
Experiment
involve changing variables to see how they affect other variables, aiming to determine cause-and-effect relationships.
usually assign participants randomly to experimental and control groups for a fair comparison
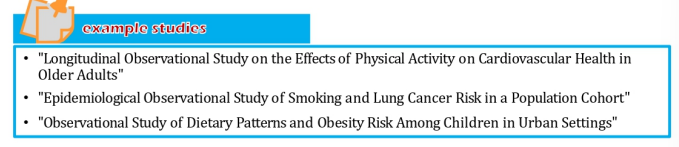
Observational Studies
entail watching a documenting behaviors or events without altering variables, and can occur in either natural settings (naturalistic observation) or controlled settings (controlled observation).
these studies aims to understand the phenomena as they naturally occur, without external influence
Secondary Data Analysis
analyze data already gathered by others or organizations
this approach offers valuable insights and helps answer research questions without needing to collect fresh data.
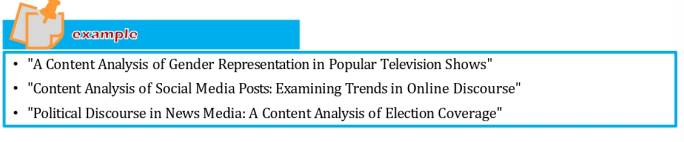
Content Analysis
about studying written, visual, or audio information to find patterns and themes.
it is often used in media and communication studies for qualitative analysis.
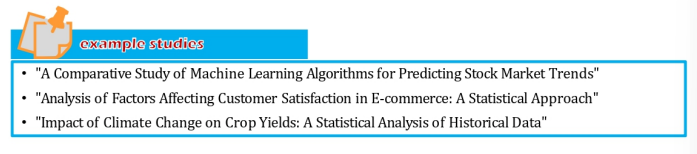
Statistical Analysis
uses math methods to study and explain data.
they look at numbers like averages, comparisons, and patterns to understand things better.
Research Design
refers to the overall plan or structure that guides the research process
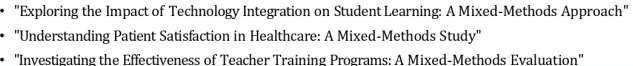
Mixed-methods Design
combines both quantitative methods within the same study to gain more comprehensive understanding of the research topic.
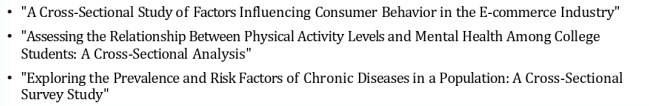
Cross-Sectional Design
involves studying different groups of participants at the same time point to compare variables or characteristics.
Experimental Design
involves manipulating an independent variable to observe its effects on a dependent variable while controlling for other variables.
it is used to establish cause-and-effect relationships.
Quasi-Experimental Design
similar to experimental design but lacks random assignment to groups, making it less robust in establishing causality.
Descriptive Design
this design aims to describe the characteristics or behaviors of a population or phenomenon.
it does not involve manipulation or control of variables.
Longitudinal Design
involves studying the same group of participants over an extended period to observe changes or trends over time

Correlational Design
this design examines the relationship between variables without manipulating them.
it identifies associations but does not imply causation.
Data Sources and Collection
refer to places or methods from which researchers gather information or data for their study.
Informed Consent
participants should be fully informed about the purpose of the study, their role, potential risks and benefits, confidentiality measures, and their right to withdraw at any time without repercussions.
Privacy and Confidentiality
data collected should be kept confidential and anonymized whenever possible to protect participants’ identities.
researchers must take measures to secure data storage and transmission
Voluntary Participation
participation in the study should be voluntary and participants should not feel coerced or pressured to take part.
they should have the option to decline participation or withdraw from the study at any stage.
Minimization of Harm
researchers should minimize any potential harm or discomfort to participants, both physical and psychological.
this includes avoiding sensitive or intrusive questions and providing support or referrals if participants experience distress.
Respect for Diversity
researchers should respect participants’ cultural, social, and personal differences, ensuring that data collection methods are sensitive and appropriate for all participants.
Beneficence
researchers should strive to maximize benefits and minimize harm to participants and society as a whole.
this includes ensuring that the research contributes to knowledge advancement and has practical applications or benefits.
Compliance with Regulations
researchers should adhere to ethical guidelines and regulations set by institutional review boards (IRBs), professional associations and legal frameworks governing research involving human subjects.
General Guide on how to Design a Data Collection Method
Project Initialization
define the project, scope, objectives, and deliverables. Identify key stakeholders and establish project governance.
Planning
develop a detailed project plan, including timelines, resource allocation, budget, risk management strategies, and communication plans.
Execution
implement the project plan by carrying out the activities outlined, such as conducting research gathering data, developing products, or delivering services.
Monitoring and Control
track project progress, monitor performance metrics, manage risks, and make necessary adjustments to ensure the project stays on track.
Quality Assurance
ensure that project deliverables meet quality standards and fulfill the requirements outlined in the project plan.
Risk Mangement
identify potential risks, assess their impact and livelihood, develop risk mitigation strategies, and monitor risks throughout the project lifecycle.
Communication
maintain regular communication with stakeholders, provide updates on project progress, address issues, and concerns, and facilitate collaboration among team members.
Closure
complete all project deliverables, obtain approvals and sign-offs from stakeholders, conduct project reviews or evaluations, document lessons learned, and formally close our the project.
Population
is the entire group that you want to draw conclusions about.
Sample
is the specific group that you will collect data from.
Population
according to Bhandari (2020)
the entire group under the study for drawing conclusion
Sample
according to Bhandari (2020)
is a specific subset from which data is collected.
Sampling Method
to draw valid conclusion s from your results, you have to carefully decide how you will select a sample that is representative of the group as a whole.
Probability sampling
a sampling method that involves randomly selecting a sample, or a part of the population that you want to research.
also sometimes called random sampling.
to qualify as being random, each research unit must have an equal change of being selected.
Simple Random Sampling
every member of the population has an equal change of being selected/
Systematic Sampling
a method where you select every nth member from a list or sequential arrangement of the population.
Stratified Sampling
involves dividing the population into subpopulations that may differ in important ways.
Cluster Sampling
involves dividing the population into subgroups, but each subgroup should have similar characteristics to the whole sample
Non-probability Sampling
is a sampling method that uses non-random criteria like the availability, geographical proximity, or expert knowledge of the individuals you want to research in order to answer a research question.
is used when the population parameters are either unknown or not possible to individually identify.
Convenience Sampling
simply includes the individuals who happen to be most accessible to the researcher.
also called as availability sampling
Voluntary Response Sampling
mainly based on ease of access.
The researcher puts out a request for members of a population to join the sample, and people decide whether or not to be in the sample
Purposive Sampling
involves the researcher using their expertise to select a sample that is most useful to the purpose of the research.
intentionally selecting participants based on their characteristics, knowledge, experiences, or some other criteria
Snowball Sampling
used to recruit participants via other participants
Quota Sampling
relies on the non-random selection of a predetermined number or proportion of units
Tables and Graphs
visual representations used to represent and summarize data in a concise and structured format, aiding in understanding patterns, trends, and relationships within the dataset.
Graphical Data Summarization
in research, it involves presenting complex data in visual format to communicate key findings and insights effectively.
Graphs, tables, charts, and diagrams
are commonly used to summarize data in research papers, reports and presentations
Summary Tables
are structured representation of data that provide a concise overview of essential information, including summary statistics like means, medians, standard deviation, counts, and percentages.
Bar Charts
ideal for comparing categorical data or showing changes over time.
represents data with rectangular bars, where the length or height of each bar corresponds to the value being presented.
Line Charts
often used to show trends over time or relationships between variables.
connect data points with straight lines, making it easy to visualize patterns or changes.
frequency polygon
Pie Charts
useful for displaying the composition of a whole such as proportions or percentages of a total.
divides a circle into slices, with each slice representing a category and its size proportional to the value it represents
Variables and Categories
summary tables typically list the variables or factors being analyzed along the rows and columns
Statistical Tests or Measures
this could include p-values, effect sizes, confidence intervals, or correlation coefficients, depending on the analysis conducted.
Footnotes or Annotations
summary tables may include footnotes or annotations to provide additional context, explanations, or references for specific findings or statistical measures presented in the table.
Histograms
are graphical representations of the distribution or numerical data.
they divide the data into intervals, or bins, and display the frequency or relative frequency of observations falling into each interval with bars.
useful for understanding the shape, central tendency, and spread of dataset.
Polygraphs
also known as line graphs or line charts
represent data points connected by lines.
commonly used to illustrate trends or relationships between variables over time or across different conditions.
effective for showing changes in patterns in data.
Scatter Plots
used to show relationships between two continuous variables.
plot individual data points on two-dimensional graph, with one variable on each axis, allowing researchers to identify patterns or correlations.
Best Practices for Graphical Summarization of Data
Understand your audience
Simplify and Focus
Choose Appropriate Visualizations
Label clearly and consistently
Provide context and interpretation
Ensure accuracy and integrity
User color thoughfully
Consider interactive features
Test and iterate
Document and share methodology
Range, Variance and Standard Deviation
are statistical measures that describe the dispersion or variability of a dataset.
they provide insights into how spread out the values in the dataset are from the mean (average) value.
Range
the ____ is the difference between the maximum and minimum values in a dataset
it provides a simple measure of the spread or variability of the data
formula: maximum value - minimum value
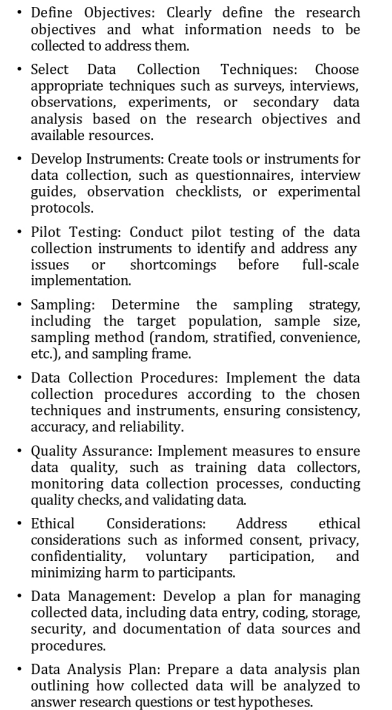
Mean or Average
is the sum of all values in a dataset divided by the number of values. It represents the central value of the data.
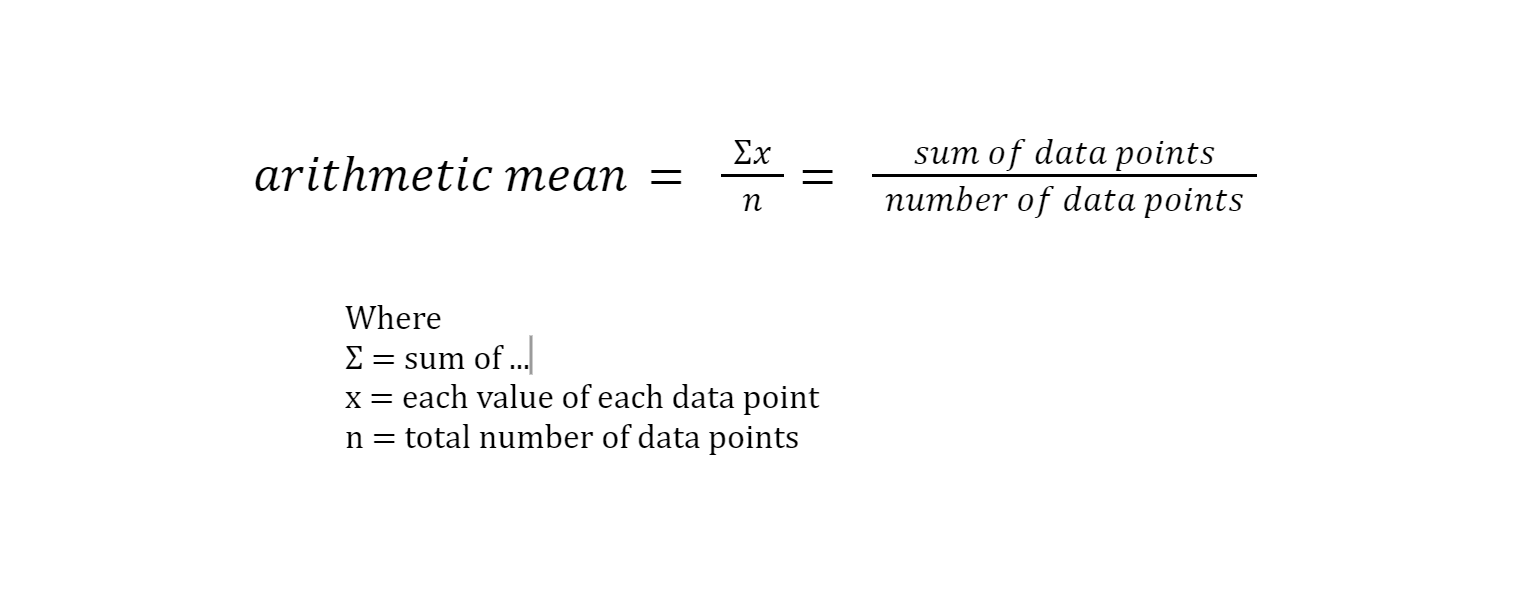
Variance
measures the average squared deviation of each data point from the mean.
it quantifies the spread or dispersion of the data points around the mean.
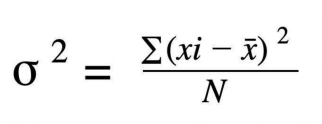
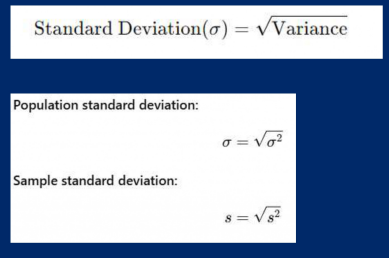
Standard Deviation
is the square root of the variance.
provides a measure of the dispersion of data points around the mean, with the same units as the original data.
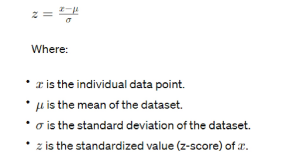
Standardization or Z-Score
also known as z-score transformation
is a technique used to rescale data so that it has a mean of 0 and a standard deviation of 1. This allows comparison of scores from different datasets.
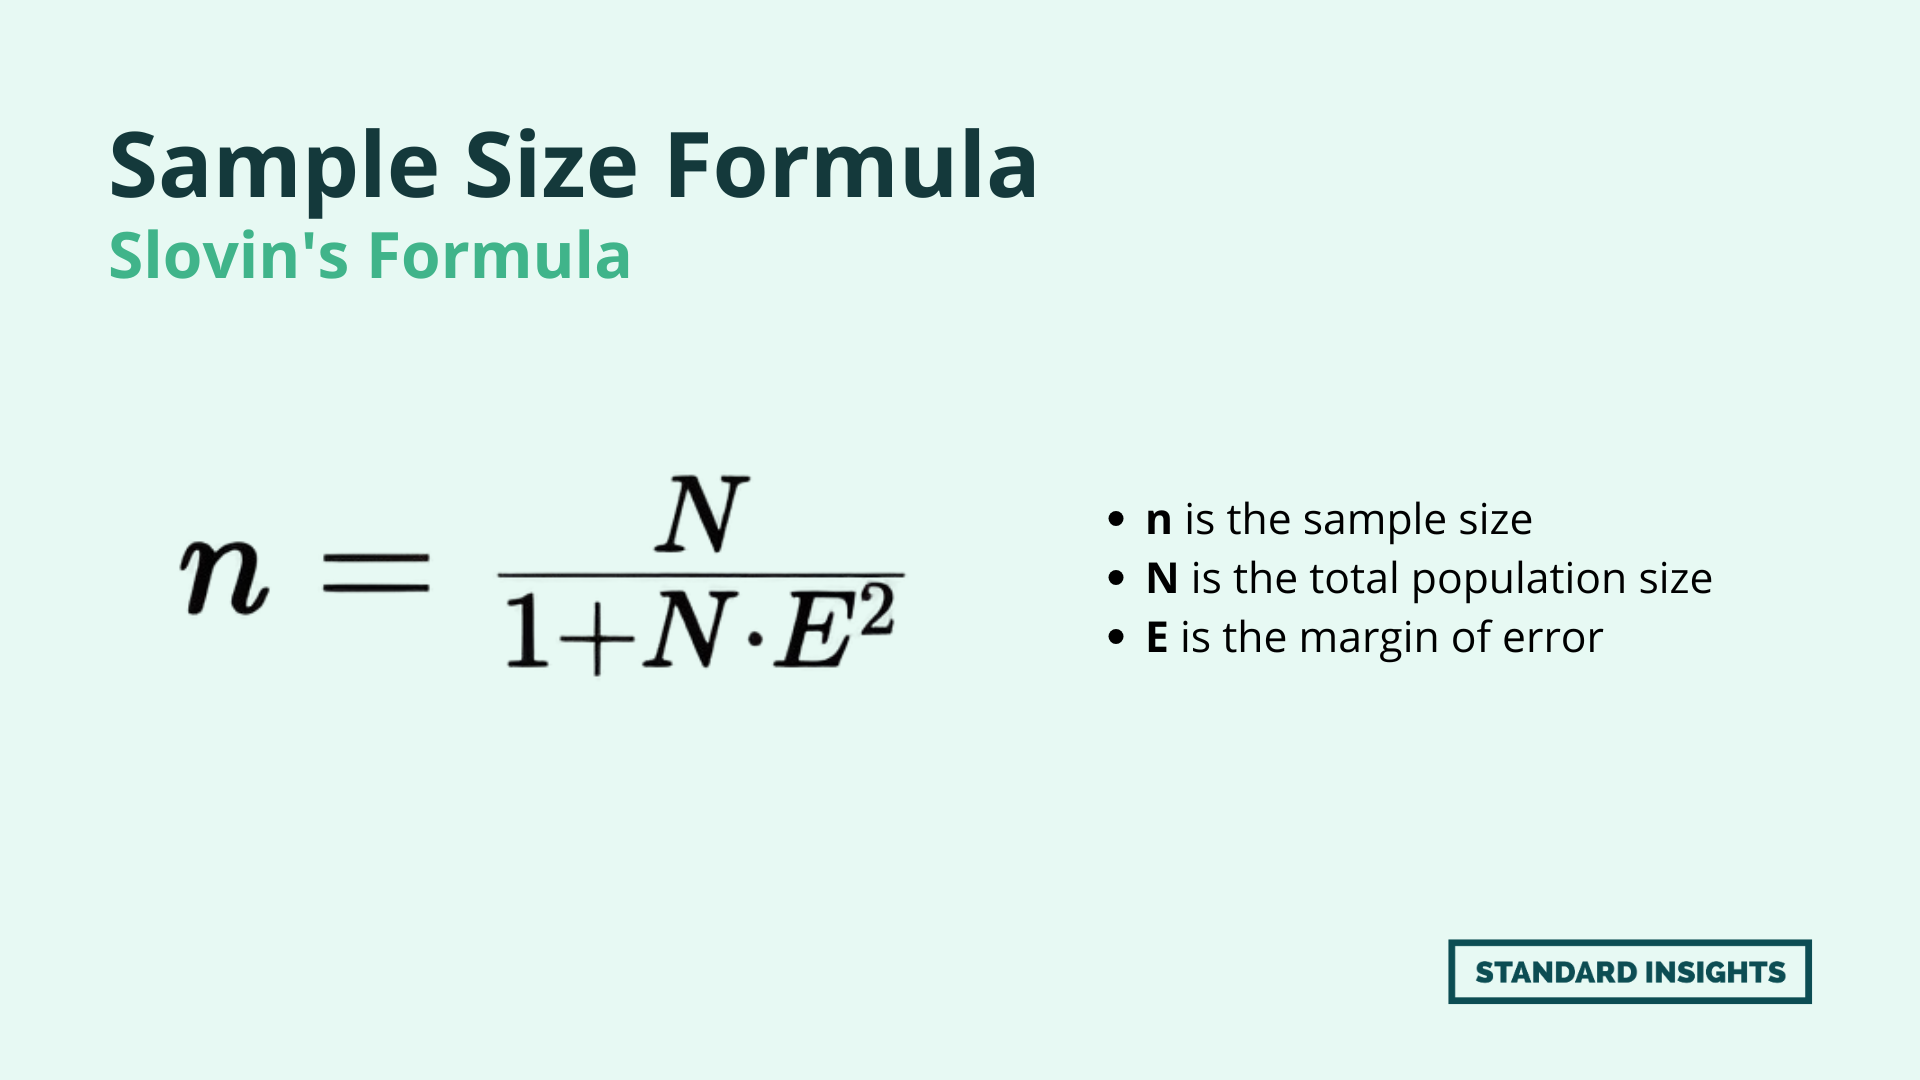
Slovin’s Formula
also known as sample size formula.
is a statistical formula used to determine the sample size needed for a survey or study, given a specific margin of error and population size.