Psych Stats Exam 2
1/47
There's no tags or description
Looks like no tags are added yet.
Name | Mastery | Learn | Test | Matching | Spaced |
|---|
No study sessions yet.
48 Terms
Descriptive Statistics
set of statistical tools used to summarize, describe, and present data in a
meaningful way
Mean
The sum of all data points divided by the number of data points. It gives a
central value of the data.
Median
The middle value when data points are arranged in ascending or descending order
Mode
The most frequently occurring value(s) in a dataset
Range
The difference between the maximum and minimum values in the dataset
Variance
The average squared deviation from the mean. It measures how much the data points differ from the meaning
Standard Deviation
The square root of the variance. It provides a measure of the average
distance of each data point from the mean
Null Hypothesis
Definition: states that there is no effect or no difference. It is a statement
of no change, no effect, or no relationship.
Purpose: It serves as the default or starting assumption that the researcher seeks to assess
Alternative Hypothesis
Definition: states that there is an effect, a difference, or a relationship. It is what you want to prove.
Purpose: It represents the opposite of the null hypothesis and is accepted if the null hypothesis is rejected.
Significance Level
A significance level (alpha, often 0.05) is chosen to determine the
threshold for rejecting the null hypothesis
One-tailed Test
Tests for the possibility of the relationship in one specific direction
Two-tailed Test
Tests for the possibility of the relationship in both directions
Chi-Square Test of Independence
Purpose: To determine if there is a significant association between two categorical variables
Degrees of Freedom
the number of values in the final calculation of a statistic that are free to vary and will not change the test results
Alpha Value (a)
Definition: The alpha value is the threshold for significance in a hypothesis test. Commonly used alpha values are 0.05 and 0.01 in social sciences.
Purpose: It sets the standard for how strong the evidence must be to reject the null hypothesis.
P-value
the probability of obtaining test results at least as extreme as the
observed results, assuming the null hypothesis is true. It measures the evidence against the null hypothesis
p>a= NOT SIGNIFICANT
p<a= SIGNIFICANT
Type I error
Occurs when the null hypothesis is true, but we incorrectly reject it. Also known as a "false positive" or "false alarm." We conclude that there is an effect or difference when there is not.
Type II Error
occurs when the null hypothesis is false, but we fail to reject it. Also known as a "false negative" or "miss." We conclude that there is no effect or difference when there is
Phi- Coefficient
is a measure of association for two binary categorical variables. The Phi coefficient ranges from -1 to 1, where 0 indicates no association, and values close to -1 or 1 indicate a strong association
Cramer’s V
a measure of association for two nominal variables, and it is a
generalization of the Phi coefficient. ranges from 0 to 1, where 0 indicates no association, and values closer to 1 indicate a stronger association
Independent Samples T-test
Compares the means of two independent groups
Categorical independent variable, continuous dependent variable
Need to be independent of each other
Positive Correlation
Indicates that as one variable increases, the other variable also increases
Negative Correlation
Indicates that as one variable increases, the other variable decreases
Correlation Strength
Values close to +1 or -1 indicate a strong relationship between
the variables. Values close to 0 indicate a weak relationship between the
variables
Regression
a statistical method used to examine the relationships between variables. It helps
understanding how the dependent variable changes as one or more independent variables change
Internal Validity
The extent to which one variable is responsible for the change in another
External Validity
The extent to which the results of a study can be generalized. As internal validity increases, this validity decreases
3 Claims
Frequency, association, and causal
Criteria for Causal Claim
covariance, temporal precedence, and internal validity
conceptual variable
a variable that represents an abstract concept or idea; no direct way to measure the variable
Operational Variable
specifies how a conceptual variable will be measured or manipulated in a study.
Construct validity
how well the variables in a study are measured or manipulated
Statistical Validity
how well the numbers support the claim
Belmont Report 3 guiding principles
respect for persons, beneficence (has to be beneficial for society), and justice
APA Ethics
like belmont report, but added principle of fidelity and responsibility, and the principle of integrity
Questionable Research Practices
underreporting null results, p-hacking (messing with data to find significant result), and harking (changing hypothesis after study)
Theory Testing Mode
tests a theory, does not generalize, external validity is not important
Generalizability mode
representative of the population, applying to the population, external validity is important
Meta-analysis
statistically averages many studies’ findings to quantify if an effect exists
Good Research Practices
pre-registration and open science
Unethical Research Studies
Tuskegee Syphillis Study and Milgram’s obedience experiment
Threats to internal validity
confounds, selection effects, and order effects
Independent-groups design
pretest/posttest design
posttest only
random assignment or matched groups
Within groups Design
repeated measures design
concurrent measures design
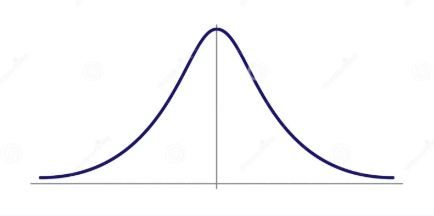
Normal Distribution
mean, median, and mode located at the center

Frequency
number of times a category response occurs
Relative Frequency
proportion of times a response occurs in a category
Z-score
How many standard deviations is a data point from the mean