5 Laboratory Operation
1/53
There's no tags or description
Looks like no tags are added yet.
Name | Mastery | Learn | Test | Matching | Spaced | Call with Kai |
|---|
No study sessions yet.
54 Terms
How many grams of sodium hydroxide (NaOH) are required to prepare 150.0 mL of a 5.0% weight/volume (w/v) solution?
1.5g
4.0g
7.5g
15.0g
7.5 g
(Percentage (as gram) x volume needed)/ 100mL
(5×150)/100
How many milliliters of glacial acetic acid are needed to prepare 2.0 L of 10.0% v/v acetic acid?
10.0 mL
20.0 mL
100.0 mL
200.0 mL
200.0 mL
1L = 1000mL
(10.0×2000mL)/100
biuret reagent requires preparation of a stock solution containing 9.6 g of copper II sulfate (CuSO4) per liter. How many grams of QuSO4 • 5H2O are needed to prepare 1.0 L of the stock solution?
Atomic weights: H = 1.0; Cu = 63.6; O = 16.0; S = 32.1
5.4 g
6.1 g
15.0 g
17.0 g
15.0 g
MW = molecular weight
%CuSO4 = MW CuSO4/ MW CuSO4 × 5H2O x 100
%CuSO4 = (159.7/249.7) x 100 = 63.96%
CuSO4 (g) x 5H2O = 9.6g/0.6396
How many milliliters of nitric acid (HNO3) (purity 68.0%, specific gravity 1.42) are needed to prepare 1.0 L of a 2.0 N solution?
Atomic weights: H = 1.0; N = 14.0; O = 16.0
130.5 mL
The MW of HNO, is 63.0 g. Because the valance of the acid is 1 (1 mole of hydrogen is produced per mole of acid, the equivalent weight is also 63.0g. The mass needed is calculated by multiplying the normality (2.0N) by the equivalent weight (63.0 g) and volume
(1.0 L); therefore, 126.0 g of acid are required.
Because the purity is 68,0% and the specific gravity 1.42, the amount of HNO3 in grams per milliter is 0.68 × 1.42 g/mL or 0.9656g/mL. The volume required is calculated by dividing the mass needed (126.0 g) by the grams per milliter.
mL HNO3 = 126.0g / 0.9656g/mL = 126.0 g x 1.0 mL/0.9656 g = 130.5 mL
Convert 10.0 milligrams per deciliter (mg/dL) calcium (atomic weight = 40.1) to the International System of Units (SI).
2.5
The SI unit is the recommended method of reporting clinical laboratory results. The Sl unit for all electrolytes is millimoles per liter (mmol/L). To convert from milligrams per deciliter to mmol/L, multiply by 10 to convert to milligrams per liter, then divide by the atomic mass expressed in milligrams.
10.0 mg/dL × 10.0 dL/1.0L = 100.0 mg/L
100.0 mg/L × 1.0 mmol/40.1 mg = 2.5 mmol/L
Convert 2.0 milliequivalents per liter (mEq/L) magnesium (atomic weight = 24.3) to mg/dL.
2.4 mg/dL
To convert from mEa/L to mg/dL, first calculate the miliequivalent weight (equivalent weight expressed in milligrams), which is the atomic mass divided by the valence. Because magnesium is divalent, each mole has the charge equivalent of 2 moles of hydrogen.
Then, multiply the mEa/L by the milliequivalent weight to convert to milligrams per liter (mg/L). Next, divide by 10 to convert mg/L to mg/dL.
Milliequivalent weight Mg = 24.3 ÷ 2 = 12.15 mg/mEq
2.0 mEq/L × 12.15 mg/mEq = 24.3 mg/L
24.3 mg/L x 1.0 L/10.0 dL= 2.4 mg/dL
How many milliliters of a 2000.0 mg/dL glucose stock solution are needed to prepare 100.0 mL of a 150.0 mg/dL glucose working standard?
7.5 mL
To calculate the volume of stock solution needed, divide the concentration of working standard by the concentration of stock standard, and then multiply by the volume of working standard that is needed.
C1V1=C2V2
where C1 = concentration of stock standard
V1 = volume of stock standard
C2 = concentration of working standard
V2= volume of working standard
2000.0 mg/dL × V1 = 150.0 mg/dL × 100.0 mL
V1 = (150.0 ÷ 2000.0) x 100.0 mL
V1= 7.5 mL
What is the pH of a solution of HNO3, if the hydrogen ion (H+) concentration is 2.5 × 10^-2 M?
1.6
Fora strong acid, the pH is equal to the negative logarithm of the Ht concentration.
PH = -Log H+
pH =-Log 0.025
pH= 1.6
Calculate the pH of a solution of 1.5 × 10^-5 molar (M) ammonium hydroxide (NH4OH)
9.2
First, calculate the pOH of the solution.
pOH = -Log (OH-]
pOH = - Log 1.5 × 10^-5 =4.82
pH = 14-pOH
pH= 14-4.8 = 9.2
How many significant figures should be reported when the pH of a 0.060 M solution of nitric acid is calculated?
A. 1
B. 2
C. 3
D. 4
B. 2
What is the pH of a 0.05 M solution of acetic acid? Ka = 1.75 × 10⁻⁵, pKa = 4.76
A. 1.7
B. 3.0
C. 4.3
D. 4.6
B. 3.0
1.75x10^-5= [H+] x [Ac]/5.0 x 10-2
Since [H*]=[Ac]
X²= (1.75 × 10-5)x (5.0 x 102) = 8.75 × 10⁻⁷
x= √(8.75 × 10)= (H*]= 9.35 × 10^-4M
pH=-Log 9.35 x 10^-4M = 3.0
Alternatively, pH=1/2 (pKa -Log HA)
pH= ½ (4.76 - Log 5.0 x 10^-2)
=¼(4.76+1.30)
= 3.0
What is the pH of a buffer containing 40.0 mmol/L NaHC2O4 and 4.0 mmol/L H2C2O4? (pKa = 1.25)
A. 1.35
B. 2.25
C. 5.75
D. 6.12
B. 2.25
The Henderson-Hasselbalch equation can be used to determine the pH of a buffer containing a weak acid and a salt of the acid.
pH= pKa+ log salt/acid
= 1.25 + log 40.0 mmol/L/4.0 mmol/L
= 1.25 + log 10
= 2.25
A solvent needed for high-performance liquid chromatography (HPLC) requires a 20.0 mmol/L phosphoric acid buffer, pH 3.50, made by mixing potassium dihydrogen phosphate (KH2PO4) and phosphoric acid (H3PO4). How many grams of KH2PO4 are required to make 1.0 L of this buffer? Formula weights: KH2PO4 = 136.1; H3PO4 = 98.0; pKa H3PO4 = 2.12
2
When zeros appear by themselves to the left of the decimal point, they are not significant. When they are to the left of the decimal point and are preceded or followed by a number, they are significant. Zeros after the decimal point preceding a number are not significant. However, they are significant if they follow another number (either before or after the decimal point) or are between two numbers. Therefore, 0.060 M has only two significant figures (the underlined digits).
In laboratory practice, most analytes are reported with two significant figures. Routine analytes that are exceptions are pH, which includes three significant figures, and analytes with whole numbers above 100, such as sodium, cholesterol, triglycerides, and glucose.
A procedure for cholesterol is calibrated with a serum-based cholesterol standard that was determined by the Abell-Kendall method to be 200.0 mg/dL. Assuming the same volume of sample and reagent are used, calculate the cholesterol concentration in the patient's sample from the following results.
Standard Concentration /Absorbance of Reagent Blank / Absorbance of Standard/
Absorbance of Patient Serum
200 mg/dL/ 0.00 /0.860/ 0.740
A. 123 mg/dL
B. 172 mg/dL
C. 232 mg/dL
D. 314 mg/dL
B. 172 mg/dL
Cu= A u/As x Cs where Cu=concentration of unknown, Au = absorbance of unknown, As = absorbance of standard, and Cs = concentration of standard.
Cu = 0.740/0.860 x 200 mg/dL
= 172 mg/dL
A glycerol kinase method for triglyceride calls for a serum blank in which normal saline is substituted for lipase in order to measure endogenous glycerol. Given the following results, and assuming the same volume of sample and reagent are used for each test, calculate the triglyceride concentration in the patient's sample.
Std Concentration : 125mg/dL
Absorbance of RB: 0.000
Abs of Std: 0.62
Abs of Pt Serum: 0.750
Abs of Serum Blank: 0.100
A. 119 mg/dL
B. 131 mg/dL
C. 156 mg/dL
D. 180 mg/dL
B. 131 mg/dL
The serum blank absorbance is subtracted from the result for the patient's serum before applying the ratiometric formula to calculate concentration.
Cu=([Au-ASB]/As) x Cs
where
ASB= absorbance of serum blank = (0.750-0.100)/0.620 x 125 mg/dL
= 131 mg/dL
When referring to quality control (QC) results, what parameter usually determines the acceptable range?
A. The 95% confidence interval for the mean
B. The range that includes 50% of the results
C. The central 68% of results
D. The range encompassed by ±2.5 standard deviations
A. The 95% confidence interval for the mean
Which of the following quality control (QC) rules would be broken 1 out of 20 times by chance alone?
A. 12s
B. 22s
C. 13s
D. 14s
A. 1 2s
Which of the following conditions is cause for rejecting an analytical run?
A. Two consecutive controls greater than 2 s above or below the mean
B. Tree consecutive controls greater than 1 s above the mean
C. Four controls steadily increasing in value but less than ±1 s from the mean
D. One control above +1 s and the other below -1 s from the mean
A. Two consecutive controls greater than 2 s above or below the mean
One of two controls within a run is above +2s and the other control is below -2s from the mean. What do these results indicate?
A. Poor precision has led to random error (RE)
B. A systematic error (SE) is present
C. Proportional error is present
D. QC material is contaminated
A. Poor precision has led to random error (RE)
Two consecutive controls are both beyond -2s from the mean. How frequently would this occur on the basis of chance alone?
A. 1:100
B. 5:100
C. 1:400
D. 1:1,600
D. 1:1,600
The term R4S means that:
A. Four consecutive controls are greater than ±1 standard deviation from the mean
B. Two controls in the same run are greater than 4s units apart
C. Two consecutive controls in the same run are each greater than ±4s from the mean
D. There is a shift above the mean for four consecutive controls
B. Two controls in the same run are greater than 4s units apart
A trend in QC results is most likely caused by:
A. Deterioration of the reagent
B. Miscalibration of the instrument
C. Improper dilution of standards
D. Electronic noise
A. Deterioration of the reagent
In most circumstances, when two controls within a run are both greater than ±2s from the mean, what action should be taken first?
A. Recalibrate, then repeat controls followed by selected patient samples if quality control is acceptable
B. Repeat the controls before taking any corrective action
C. Change the reagent lot, then recalibrate
D. Prepare fresh standards and recalibrate
A. Recalibrate, then repeat controls followed by selected patient samples if quality control is acceptable
When establishing QC limits, which of the following practices is inappropriate?
A. Using last month's QC data to determine current target limits
B. Exclusion of any QC results greater than ±2s from the mean
C. Using control results from all shifts on which the assay is performed
D. Using limits determined by reference laboratories using the same method
B. Exclusion of any QC results greater than ±2s from the mean
Which of the following assays has the poorest precision?
Analyte / Mean (mmol/L) / Std Deviation
A. Ca / 2.5 / 0.3
B. K / 4.0 / 0/4
C. Na / 140 / 4.0
D. Cl / 100 / 2.5
A. Ca / 2.5 / 0.3
Although calcium has the lowest s, it represents the assay with poorest precision. Relative precision between different analytes or different levels of the same analyte must be evaluated by the CV because standard deviation is dependent on sample concentrations. CV= (s x 100)/Mean. This normalizes standard deviation to a mean of 100. The CV for calcium in the example is 12.0%.
Given the following data, calculate the coefficient
of variation for glucose.
Analyte / Mean / Std Deviation
Glucose / 76mg/dL / 2.3
A. 3.0%
B. 4.6%
C. 7.6%
D. 33.0%
A. 3.0%
%CV (coefficient variation) = (s/X) x 100
(2.3/76) x 100 = 3.0%
Which of the following plots is best for detecting all types of QC errors?
A. Levy-Jennings
B. Tonks-Youden
C. Cusum
D. Linear regression
A. Levy-Jennings
The Levy-Jennings plot is a graph of all QC results with concentration plotted on the y-axis and run number on the x-axis. The mean is at the center of the y-axis, and concentrations corresponding to -2 and +2s (or other specified control limits) are highlighted. Results are evaluated for multirule violations across both levels and runs. Corrective action for shifts and trends can be taken before QC rules are broken.
Which of the following plots is best for comparison of precision and accuracy among laboratories?
A. Levy-Jennings
B. Tonks-Youden
C. Cusum
D. Linear regression
B. Tonks-Youden
The Tonks-Youden plot is used for interlaboratory comparison of monthly means. The method mean for level 1 is at the center of the y-axis and mean for level 2 at the center of the x-axis. Lines are drawn from the means of both levels across the graph, dividing it into four equal quadrants. If a laboratory's monthly means both plot in the lower left or upper right quadrants, then SE exists in its method.
Which plot will give the earliest indication of a shift or trend?
A. Levy-Jennings
B. Tonks-Youden
C. Cusum
D. Histogram
C. Cusum
CUSUM points are the algebraic sum of the difference between each QC result and the mean.
The y-axis is the sum of differences and the x-axis is the run number. The center of the y-axis is 0. Because QC results follow a random distribution, the points should distribute about the zero line. Results are out of control when the slope exceeds 45 degrees or a decision limit (e.g., +-2.7s) is exceeded.
All of the following are requirements for a QC
material except.
A. Long-term stability
B. The matrix is similar to the specimens being tested
C. The concentration of analytes reflects the clinical range
D. Analyte concentration must be independent of the method of assay
D. Analyte concentration must be independent of the method of assay
Quality control materials are stable, made of the same components as the specimen, cover the dynamic linear range of the assay, and can be used for multiple analytes. The target mean for QC samples is determined from replicate assays by the user's method, not the "true" concentration of the analyte. Out-of-control results are linked to analytic performance rather than to the inherent accuracy of the method.
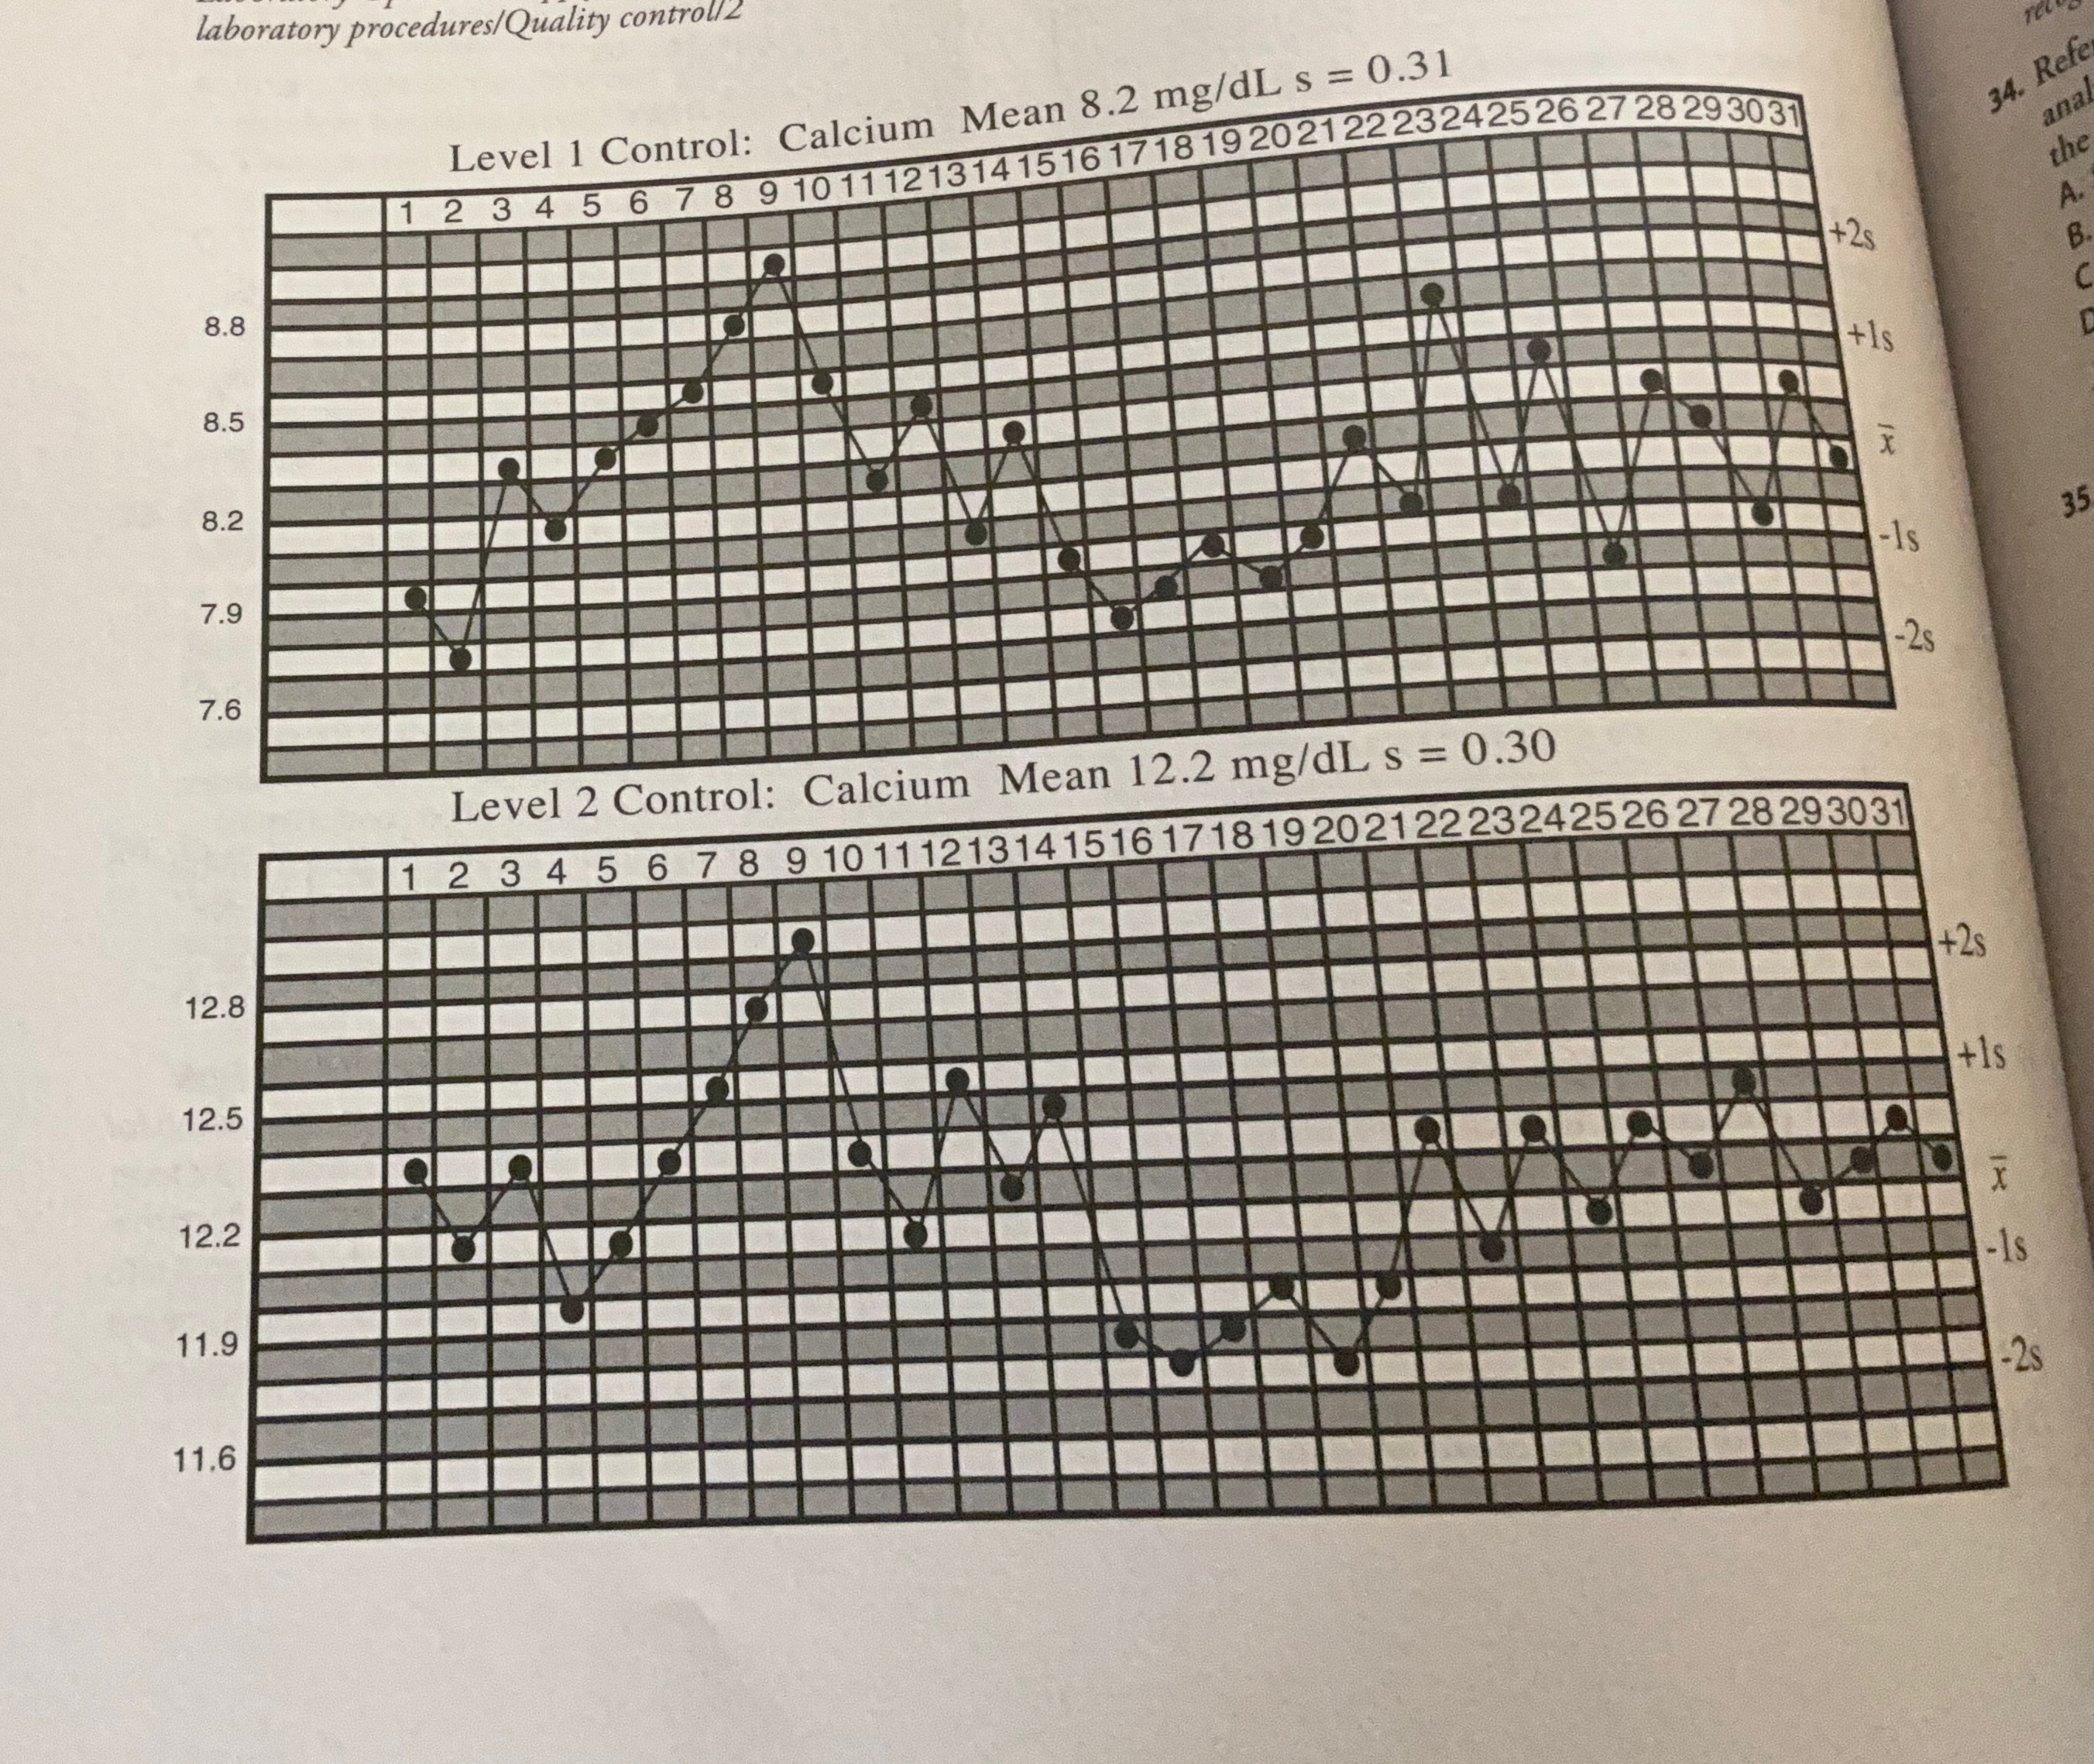
Examine the Levy-Jennings chart at the bottom of the previous page and identify the QC problem that occurred during the first half of the month.
A. Shift
B. Trend
C. Random error
D. Kurtosis
B. Trend
A trend is characterized by six consecutive decreasing or increasing control results. The value for both controls becomes progressively higher from day 4 to day 9. Trends are caused by changes to the test system that increase over time, such as deterioration of reagents or calibrators, progressive changes in temperature, evaporation, light exposure, and bacterial contamination. A trend is a type of SE because all results are affected. Conversely, RE affects some results (but not others) in an unpredictable manner. Control rules affected by RE are 1 3s and R 4s
Referring to the Levy-Jennings chart, what is the first day in the month when the run should be rejected and patient results should be repeated?
A. Day 6
B. Day 7
C. Day 8
D. Day 9
C. Day 8
Although the trend is apparent across QC levels by day 7, the patient results would not be rejected until day 8 when the 4 1s rule is broken. An advantage to plotting control data is that trends can be identified before results are out of control and patient data must be rejected. In this case, corrective steps should have been implemented by day 7 to avoid the delay and expense associated with having to repeat the analysis of patient samples. Because no action was taken on day 7 or 8, the 2 2s rule was broken on day 9.
Referring to the Levy-Jennings chart, what analytical error is present during the second half of the month?
A. Shift
B. Trend
C. Random error
D. Kurtosis
A. Shift
A shift is characterized by six consecutive points lying on the same side of the mean. This occurs from day 15 to day 20. Shifts are caused by a change in the assay conditions that affect the accuracy of all results, such as a change in the concentration of the calibrator; change in reagent; a new lot of reagent that differs in composition; or improper temperature setting, wavelength, or sample volume. The term kurtosis refers to the degree of flatness or sharpness in the peak of a set of values having a Gaussian distribution.
What is the first day in the second half of the month that patient results would be rejected?
A. Day 16
B. Day 17
C. Day 18
D. Day 19
B. Day 17
The 4 1s rule is broken across QC levels on day 17. This means that four consecutive controls are greater than +/ 1s from the mean. QC rules that are sensitive to SE are applied across both runs and levels to increase the probability of error detection. These are 2 2s, 4 1s, and 10x.
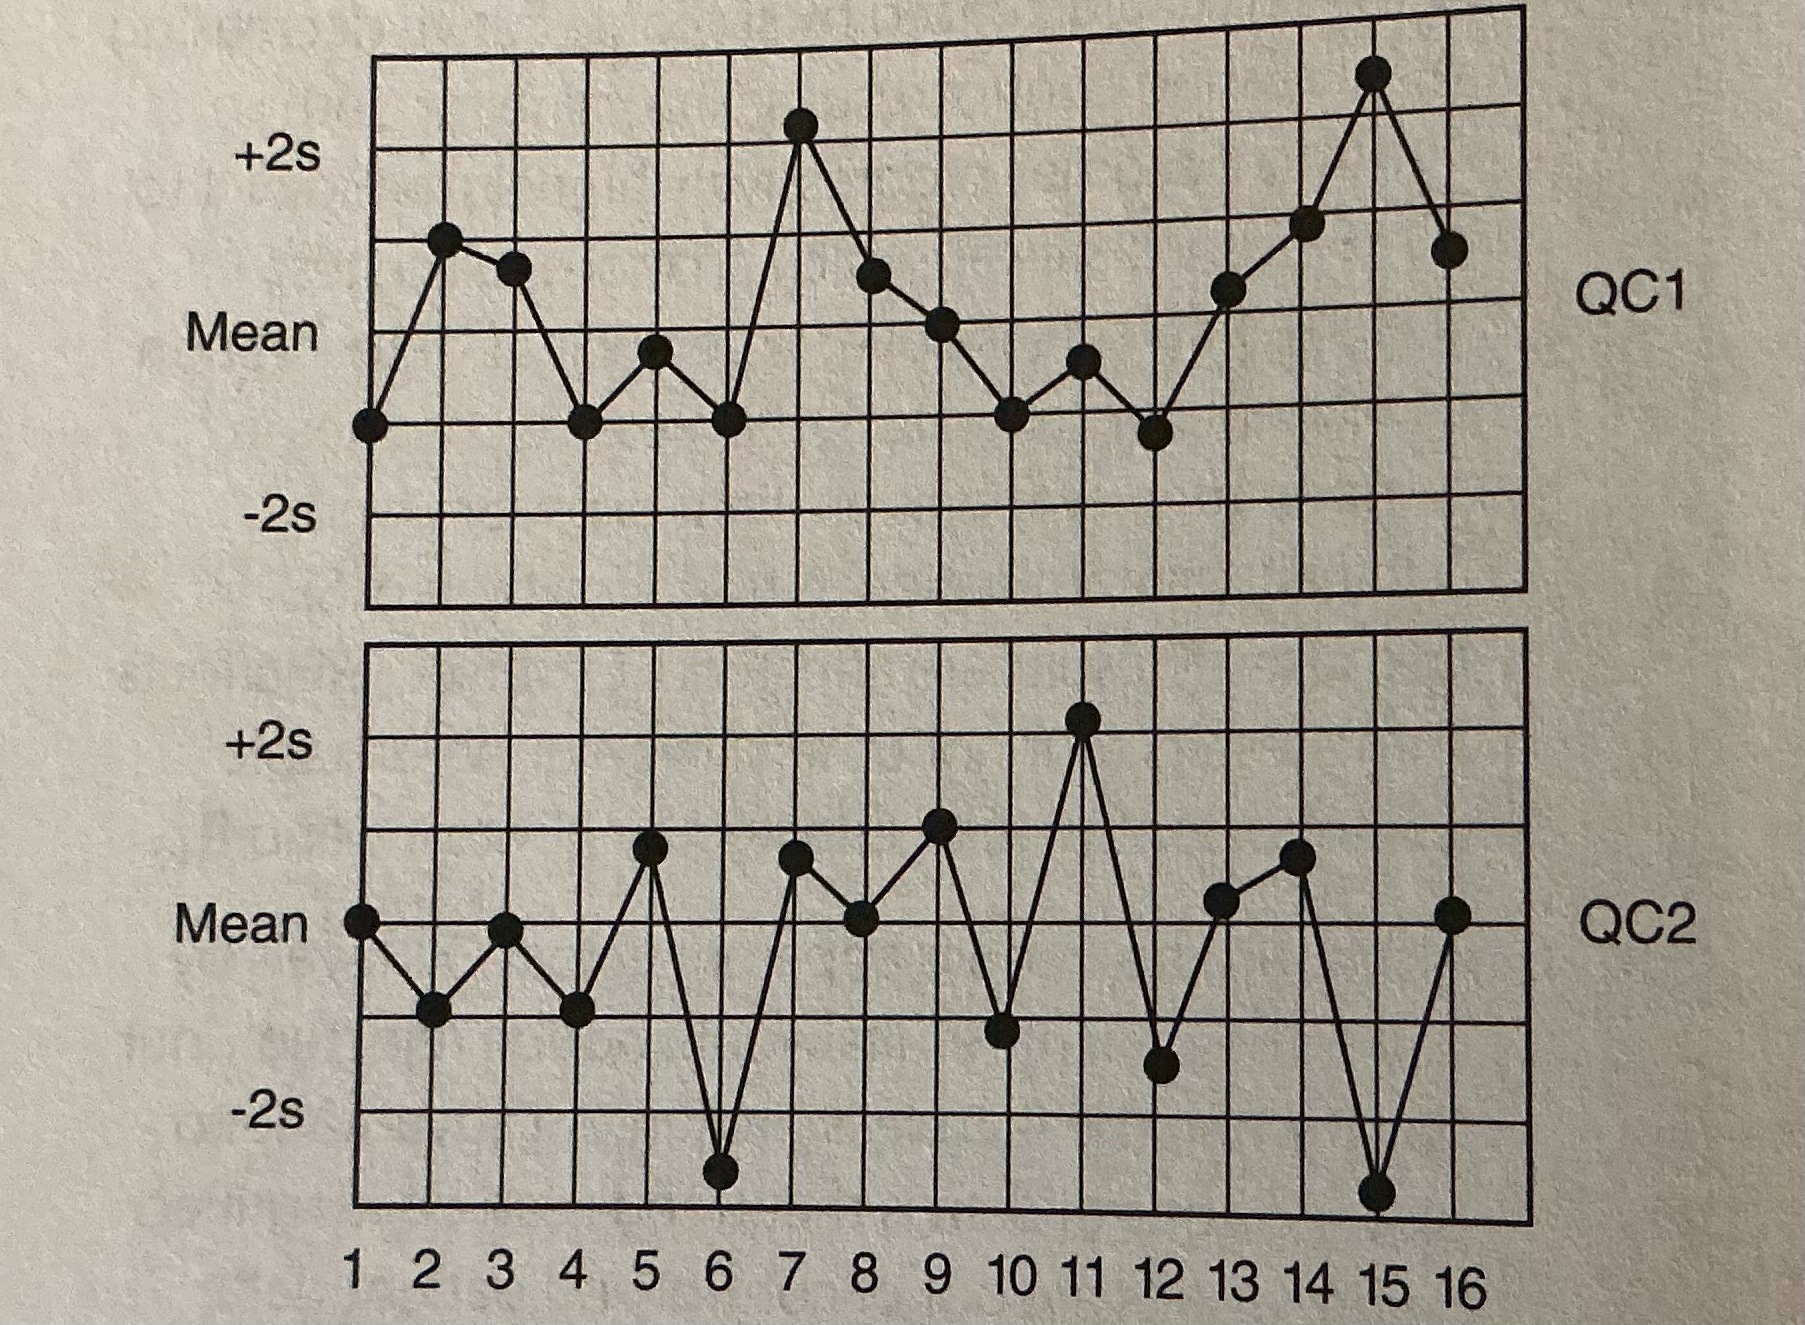
Given the following QC chart, identify the day in which a violation of the R4s QC rule occurs.
A. Day 3
B. Day 8
C. Day 10
D. Day 15
What is the minimum requirement for performing QC for a total protein assay?
A. One level assayed every 8 hours
B. Two levels assayed within 8 hours
C. Two levels assayed within 24 hours
D. Three levels assayed within 24 hours
C. Two levels assayed within 24 hours
The minimum requirement by federal regulations (subpart K of the Clinical Laboratory improvement Act, 1988 [CLIA 1988]) for frequency of QC for a general chemistry analyte is two levels of control assayed every 24 hours, provided the manufacturer's QC requirements are no greater. Some laboratories prefer to assay two control levels every 8 hours to increase the opportunity for error detection. Two controls every 8 hours are required for blood gases, automated hematology, and point-of-care glucose testing to comply with College of American Pathology requirements. Three levels of control every 24 hours should be used for analytes that have significantly different CVs at low, normal, and high concentrations. These include blood gases, therapeutic drugs, and hormones.
Which of the following statistical tests is used to compare the means of two methods?
A. Student's t test
B. F distribution
C. Correlation coefficient (r)
D. Linear regression anal
A. Student's t test
Student's t test is the ratio of mean difference to the standard error of the mean difference (bias/RE) and tests for a significant difference in means. The F test is the ratio of variances and determines if one method is significantly less precise. The correlation coefficient is a measure of the association between two variables and should be high in any method comparison. An r value less than 0.90 in method comparisons usually occurs when the range of results is too narrow.
Two freezing point osmometers are compared by running 40 paired patient samples one time on each instrument, and the following results are obtained:
Instrument / Mean / SD
Osmometer A /280 mOsm/kg /3.1
Osmometer B /294 mOsm/kg /2.8
If the critical value for F = 2.8, then what conclusion can be drawn regarding the precision of the two instruments?
A. There is no statistically significant difference in precision
B. Osmometer A demonstrates better precision that is statistically significant
C. Osmometer B demonstrates better precision that is statistically significant
D. Precision cannot be evaluated statistically when single measurements are made on samples
A. There is no statistically significant difference in precision
The F test determines whether there is a statistically significant difference in the variance of the two sampling distributions. Assuming the samples are collected and stored in the same way and the analysis is done by a person who is familiar with the instruments, then differences in variance can be attributed to a difference in instrument precision.
The F test is calculated by dividing the variance (s1)² of the instrument having the higher standard deviation by the variance (s2)² of the instrument having the smaller standard deviation.
F = (S1)² + (S2)² = (3.1)²/ (2.8)² =9.61/ 7.84 = 1.22
If the value of F is smaller than the critical value at the 0.10 level of significance, then the hypothesis (there is no significant difference in the variance of the two instruments) is accepted. The 0.10 significance level is used for one-tailed statistical tests.
Two methods for total cholesterol are compared by running 40 paired patient samples in duplicate on each instrument. The following results are obtained:
Instrument / Mean / SD
Method x (reference method) /235 mg/dL /3.8
Method y (candidate method)/ 246 mg/dL /3.4
Assuming the samples are collected and stored in the same way and the analysis done by a technologist who is familiar with both methods, what is the bias of method y?
A. 0.4
B. 7.2
C. 10.6
D. 11.0
D
Bias is defined as the difference between the means of the two methods and is calculated by using the
formula: bias = y-x. The bias is an estimate of SE.
The student's t test is used to determine if bias is statistically significant. The t statistic is the ratio of bias to the standard error of the mean difference.
The greater the bias, the higher the t score.
When the magnitude of error increases with increasing sample concentration, it is called:
A. Constant error
B. Proportional error
C. Random error
D. Bias
B. Proportional error
Proportional error (slope or percent error) results in greater absolute error (deviation from the target value) at higher sample concentration. Constant error refers to a difference between the target value and the result, which is independent of sample concentration. For example, if both level 1 and level 2 controls for laboratory A average 5 mg/dL below the cumulative mean reported by all other laboratories using the same method, then laboratory A has a constant error of -5 mg/dL for that method.
Both proportional and constant error contribute to method bias.
Which explanation is the best interpretation of the following BUN bias plot?
A. The new method consistently overestimates the BUN by a constant concentration
B. The new method is greater than the reference method but not by a statistically significant margin
C. The new method is lower than the reference method by 5 mg/dL
D. The new method is lower than the reference and the magnitude is concentration dependent.
Serum samples collected from hospitalized patients over a 2 week period are split into two aliquots and analyzed for prostate specific antigen (PSA) by two methods. Each sample was assayed by both methods within 30 minutes of collection by a technologist familiar with both methods. The reference method is method × (upper reference limit = 4.0 µg/L). Linear regression analysis was performed by the least-squares method, and results are as follows:
Linear Regression/ Correlation Coefficient (r)/ Std Error of Estimates (sy/x)
ŷ = 2.10 + 1.01x / 0.984 /0.23
Which statement best characterizes the relationship between the methods?
A. There is a significant bias caused by constant error
B. There is a significant proportional error
C. There is no disagreement between the methods because the correlation coefficient approaches 1.0
D. There is no systematic error, but the random error of the new method is unacceptable
A. There is a significant bias caused by constant error
The linear regression analysis is the most usetul statistic to compare paired patient results because it estimates the magnitude of specific errors. The y-intercept of the regression line is a measure of constant error, and the slope is a measure of proportional error. Together, these represent the bias or SE of the new method. The correlation coefficient is influenced by the range of the sample and RE. Two methods that measure the same analyte will have a high correlation coefficient, provided the concentrations are measured over a wide range, and this statistic should not be used to judge the acceptability of the new method. The standard error of estimate is a measure of the closeness of data points to the regression line and is an expression of RE.
In addition to the number of true negatives (TN), which of the following measurements is needed to calculate specificity?
A. True positives
B. Prevalence
C. False negatives
D. False positives
D. False positives
%specificity = (TN x 100)/ TN+FP
In addition to the number of True Positive (TP), which of the following measurements is needed to calculate sensitivity?
A. True positives
B. Prevalence
C. False negatives
D. False positives
C. False negatives
% Sensitivity = (TP x 100)/ TP + FN
What measurement in addition to true negatives and prevalence is required to calculate the predictive value of a negative test result (PVN)?
A. False negatives
B. Variance
C. True positives
D. False positives
A. False negatives
%PVN = (TN x 100)/ (TN + FN)
A laboratory is establishing a reference range for a new analyte and wants the range to be determined by the regional population of adults age 18 and older. The analyte concentration is known to be independent of race and gender. Which is the most appropriate process to follow?
A. Determine the mean and standard deviation of the analyte from 40 healthy adults and calculate the ±2s limit
B. Measure the analyte in 120 healthy adults and calculate the central 95th percentile
C. Measure the analyte in 120 healthy adults and use the lowest and highest as the reference range
limits
D. Measure the analyte in 60 healthy adults and 60 adults with conditions that affect the analyte concentration; calculate the concentration of least overlap
B. Measure the analyte in 120 healthy adults and calculate the central 95th percentile
Because the concentration of an analyte may not be normally distributed in a population, the reference range should not be determined from the standard deviation. It is more appropriate to determine the central 95th percentile (the range that encompasses 95% of the results). A minimum of 120 samples is needed for statistical significance. Results are rank ordered from lowest to highest. The third result is the lowest value and the 118th is the highest value in the reference range. The laboratory can verify a preexisting reference range (e.g., as determined by the manufacturer's study) by testing at least 20 healthy persons. If no more than 10% fall outside the range, it can be considered valid for the patient population.
When comparing the laboratory's monthly mean to its peer group to determine if bias is present, what statistic is most appropriate?
A. F test
B. Linear regression analysis
C. Correlation coefficient
D. Standard deviation index
D. Standard deviation index
Which of the following methods is most useful in order to detect sample misidentification?
A. Cumulative summation
B. Critical limit
C. Delta limit
D. Significant change limit
C. Delta limit
Cumulative summation is a statistical method used in quality assurance to detect a trend in QC results.
Critical limits are used to define when medical intervention is likely needed to prevent injury or death. The significant change limit is the difference in test results that is medically significant, or that which cannot be attributed to the sum of normal physiological and analytical variation.
The delta limit (delta check) determines whether the difference between two measurements usually 24 to 48 hours apart exceeds the expected. Although this can result from an abrupt change in the patient's status, other causes are sample misidentification, contamination, and RE. Delta limits are expressed in percent and vary depending on analyte stability.
Which of the following total quality management tools can be used to calculate the analytical error rate for an analyte in the clinical laboratory?
A. LEAN
B. Six sigma
C. ISO 9000
D. Laboratory information system
B. Six sigma
All four of the answer choices are TQM tools used in the clinical laboratory to improve performance.
Six sigma is a measurement of the frequency of product defects. In clinical laboratories, it refers to the frequency of an erroneous result. At the six-sigma level, the analytical process has such small variance that an error of six times the standard deviation would still be within acceptable limits for total allowable error. For example, a six-sigma process for an analyte produces a significant error in test result only 3.4 out of 1 million times the test is performed Conversely, a method performing at the three-sigma level would give 66,807 errors per million.
In which circumstances is a validation study (versus performing routine quality control) required?
A. Instrument recalibration
B. Source lamp or ion selective electrode change
C. Change in reagent lot
D. Change in calibrator lot
C. Change in reagent lot
All of the listed conditions except a change in the reagent lot number can be validated by assaying two levels of control material after the procedure.
A change in reagent lot number may alter the test system more dramatically, especially when the reagent was subjected to storage and shipping conditions that alter its performance. Therefore, both controls and patient samples should be analyzed and the results compared with the reagent in current use by utizing criteria determined by the total allowable error for the analyte.
Which statement below best describes the QC requirements for clinical laboratories? A. QC must be performed for all laboratory tests
B. QC for nonwaived tests must include at least one level of control every 24 hours
C. Equivalent quality control (eQC) is permitted for single device and point-of-care tests
D. An individualized quality control plan (IQCP) can be used if approved by the lab's accrediting agency
D. An individualized quality control plan (IQCP) can be used if approved by the lab's accrediting agency
QC is not required for diagnostic tests that are classified as waived tests under CLIA 1988 unless specified by the manufacturer or deemed accrediting agency. Subpart K specifies use of at least two levels of controls per 24 hours for all nonwaived tests (except for coagulation testing, which requires two levels every 8 hours, and blood gases, which requires three levels within 24 hours. eQC cannot be used to satisfy the requirements in subpart Kas of January 1,2016. An IQCP, if approved, permits laboratories to perform conventional QC with less frequency than required in subpart K
What two parameters must be addressed in the risk assessment of an IQCP?
A. Risk of testing error and severity of harm when test failure occurs
B. Sigma level of the test and coefficient of variation index (CVI)
C. Bias and uncertainty of the test result
D. Analytical sensitivity and specificity
A. Risk of testing error and severity of harm when test failure occurs
IQPs must determine the risk of testing error to include preanalytical, analytical, and postanalytical: errors and risk of harm resulting from such errors. These are applied to a matrix that is used to determine if the OC plan is at least equivalent to the CLIA standard.
Generally, the laboratory must demonstrate that the frequency of device failure is unlikely and the severity of harm is mild when testing failure occurs.
A laboratory's test for calcium has a bias of 0.5 mg/dL when compared with its peer group for proficiency testing. The CLIA total allowable error for serum or plasma calcium is ±1.0 mg/dL. The laboratory's standard deviation for this test is 0.25 mg/dL. What is the laboratory's sigma?
A. 50
B. 2
C. 1
D. 0.25
B. 2
Sigma is calculated by subtracting bias from TEa (as defined by CLIA 1988) and dividing the difference (which signifies the RE that can be tolerated) by the laboratory's standard deviation. The result determines the probability (odds) of reporting a laboratory result that is beyond the CLIA error limit. A laboratory test functioning at 2 sigma is expected to produce 308,537 errors per million tests (called defects per million opportunities [DPMO]). In this example, almost one in three laboratory results would be above or below 1.0 mg/dL of the expected value.
Conversely, a test performing at 4 sigma would produce 6,210 erroneous results per million, and one functioning at 6 sigma would have just 3.4 outside the CLIA limit for acceptable performance.
Which best describes the appropriate way to use QC decision limits for a test?
A. Always use the 22s rule with or without others to determine rejection
B. If QC is performed twice per day, use a combination of 22s, 13s, and 41s
C. If QC is performed more than twice per day, use only the 22s rule
D. Choose rules and number of controls based on the sigma performance of the test
D. Choose rules and number of controls based on the sigma performance of the test
Tests that have very high reproducibility and low SE (bias) do not require as stringent Q limits as those that do not. Using the 4 1s, and R 4s rules in such cases will result in rejecting tests that could have been reported because they fall within the CLIA range for allowable analytical error. In general, tests that perform above 5 sigma should not be rejected unless the 13, rule has been violated. In other words, results less than 3s from the mean are still within acceptable limits of error. For tests performing above 5 sigma, two controls measured every 1000 samples and at least once per day are adequate for detection of clinically significant errors, but tests performing at 5 sigma or less require more frequent controls. For tests performing at 5 sigma, it is advisable to include the 2 2s, and R 4s, rules using 2 controls per run and at least once per day, and for tests performing at 4 sigma or below the 4 1s, rule should be added using 2 controls per run and 2 runs per day.
For tests performing below 4 sigma use all of the conventional Westgard rules using 4 controls per run and 2 runs per day.