4.1.7 The distribution of income and wealth: poverty and inequality
1/38
There's no tags or description
Looks like no tags are added yet.
Name | Mastery | Learn | Test | Matching | Spaced |
|---|
No study sessions yet.
39 Terms
Income (def + eg)
money you receive over a period of time, flow concept, e.g. salary received by teacher, interest received of holding Gilt (UK gov bonds), dividends declared from owning the shares of Microsoft
Wealth (def + eg)
Assets, stock concept, valuable things you own at a particular point of time, e.g. qualification of a Master degree, Balance in Natwest, US 10 years treasury
Wealth inequality creates an … inequality of income
immediate
Inequality of income leads to … inequality over a ……
wealth, period of time
Wealth inequality is more serious than income inequality because ….. e.g. shares in companies or multiple rented out properties
the wealth is inherited between generations and the wealth itself can generate incomes
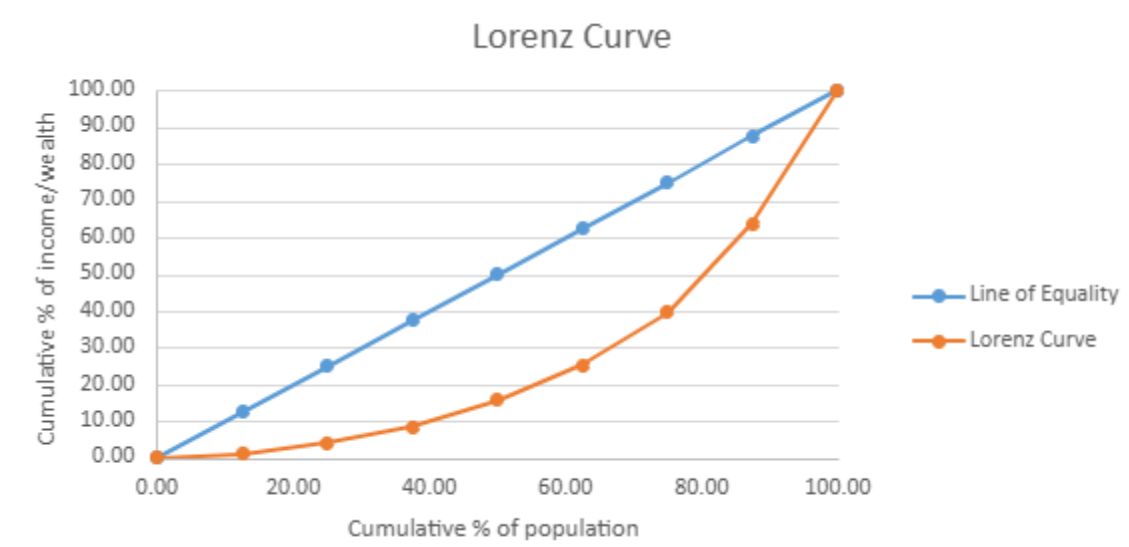
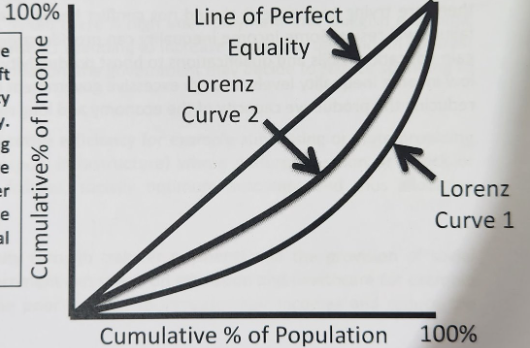
The Lorenz Curve purpose
Shows cumulative % of income on Y-axis and cumulative % of population on the X-axis
The Lorenz Curve graph
Blue line – Line of Equality, means everybody is earning the same income
Orange line – Lorenz Curve, a measure of income/wealth inequality
Gini Coefficient
In a world of perfect equality Gini Coefficient = 0
In a world of perfect inequality Gini Coefficient = 1
Costs of income inequality
Higher level of debt, costs to the gov, social costs, lower economic growth
Benefits of income inequality
Promote strong incentive to gain qualifications and skills, encourage enterprise, promotes a work and not welfare attitude
Positive impacts of the rising AI
democratisation of education and skills development, access to educational resources and personalised learning experiences → more people acquiring skills for higher-paying jobs → potentially reducing income inequality
Negative impact of the rising AI
acceleration of job automation, disproportionately affect lower-wage, less-skilled jobs → potentially increasing unemployment or pushing workers into lower-paying roles, pace of change may favour those with the skills to work alongside or develop AI tech
Causes of income inequality in a society
Age, education, one sector dominant and capital intensive production, globalisation and free movements of labour and trade, tech development, ownership of financial assets and property, corrupt governance
Absolute poverty
Household does not have sufficient income to sustain even a basic acceptable standard of living and to meet people’s essential, core needs
Thresholds vary between developed and developing countries
Extreme poverty measure now used by the World Bank is the % of population living on less than $1.90 a day (PPP) or £533 per year (exchange rate at 13/5/2024)
Relative poverty
Level of household income that is considerably lower than the median level of income within a country
Official UK relative poverty line is household disposable income (adjusted for household size) of less than 60% of median income
Causes of poverty
Low productivity, population growing faster than GDP, severe savings gap, absence of basic gov/public services, corruption, high levels of debt and high interest rates, civil war, absence of basic property rights
Microeconomic impacts of poverty
Decrease in CS, impact on Human capital, changes in savings and investment behaviour, increased vulnerability to economic shocks
Macroeconomic impacts of poverty
Reduced economic growth, fiscal pressure on gov, inequality and social unrest, decline in human development indicators (HDI), adverse effects on trade balance
Factors limiting the value of labour productivity in LICs
Low rates of urbanisation – externalities of high density
Weaknesses in human capital / “know-how” (Hausman)
Chronic critical infrastructure gaps
Gender inequalities
Debilitating impact of malnourishment
Limited economies of scale within key economic sectors
Heavy dependence on low value-added sectors
Policy to lower inequality - higher minimum wage
boosts work incentives and take-home pay
might cost some jobs and lead to higher prices
Policy to lower inequality - free provision of services
access to merit goods not based on ability to pay
universal access not as effective as targeted provision
Policy to lower inequality - higher rates of income tax
progressive taxes on the rich lower inequality and raise revenue
risk of a brain drain and increased tax avoidance
Policy to lower inequality - investment in training
helps to raise productivity, jobs and real wages
effective in the LR but risk of the free rider problem
Policy to lower inequality - subsidies for childcare
improve incentives for parent to look for and take work
effective, but quality of childcare needs improving
The triple lock was introduced to the UK … pension in … It was a guarantee that the …. pension would not lose value in … terms, and that it would increase at least in line with ….
state, 2010, state, real, inflation
Three-way guarantee, 2010 from triple lock which state pension would increase by the greatest of the following 3 measures
average earnings growth rate, prices (as measured by the Consumer Prices Index, CPI), 2.5%
Policy to redistribute income - transfer payments
child support assistance, unemployment benefits and payments to the disabled, prevent those unfortunate enough not to have the skills for work.
Allows a decent standard of living, increasing incomes for the poor and helping to close large income disparities
Policy to redistribute income - gov spending on essential goods and services
health care, education, water supplies
poorer members of the economy have access to essential goods and services increasing living standards
allows the poor a means to increase their skills, productivity and therefore incomes
Evaluation of gov spending and transfer payments to redistribute income
cost the gov large sums where funding would carry severe OC
if money borrowed → taxes increase
if regressive, indirect taxes (e.g. VAT) → increase
if gov funded → spending cut e.g. public transport
Poor will suffer
Policy to redistribute income - increase progressive tax
adjust progressive income tax, increase tax on workers with salaries in highest income tax bands using extra tax revenue to finance transfer payments + extra gov spending
Would reduce disposable incomes of rich and increase incomes at lower end for poor
Evaluation of increase progressive tax to redistribute income
Distorts incentives in the labour market → preventing entrepreneurial risk taking to the detriment of the economy
Shown by Laffer curve
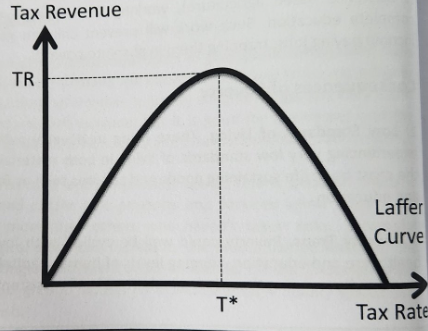
The Laffer curve
Raise income taxes on the rich → tax revenue fall as tax rates increase.
Workers lose incentive to work for higher incomes that will be heavily taxed.
The income effect becomes negative whereby workers work and earn less to reach a satisfactory target income reducing income tax revenue. Higher taxes promote tax evasion and/or tax avoidance by individuals whilst also incentivizing the highly skilled workers and entrepreneurs to emigrate to countries where tax rates are lower. Not only will this reduced expected tax revenue for governments to use in redistributing income but it could also dampen the productive potential of the economy as innovation and entrepreneurial spirit is limited and hours worked fall.

Policy to redistribute income - minimum wage
can directly boost incomes of poorest
producers burdened without impacting the gov’s fiscal position
set above Eq wage in labour market
With higher wages, those at lower end of income spectrum able to move out of relative poverty by improving material and non-material standards of living
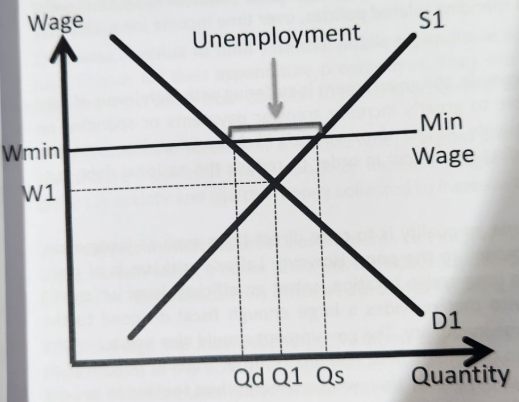
Evaluation of minimum wage to redistribute income
distorts efficient labour market outcomes
increase unemployment = harming those it is supposed to protect
low skills = difficult to find work at a higher wage rate bc low productivity
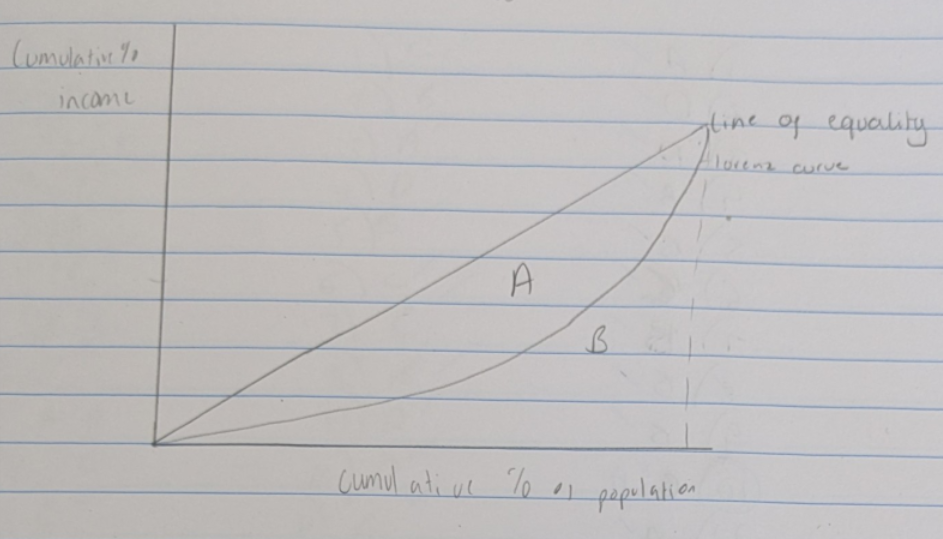
Effect of redistributive policies
Shift Lorenz curve left = reduction in income inequality
Gini coefficient would move closer to 0 - smaller distance between the Lorenz curve and line of perfect equality
General eval of policies to redistribute income
Inequality depends on level of income tax
Income tax set too high = working less, moving country
in SR may be quick rise in tax revenue
Income tax set too low = no guarantee that enough revenue generated to fund transfer payments + gov spending
If regressive tax rise LR to fund spending = income inequality may rise
Incentives
Laffer - … taxation is needed to set an … level which still promotes work and … … activity but also that provides a large enough … dividend to the government which can be used to reduce income inequality.
Gov should also beware of the incentives as it may promote a welfare …and dependency rather than workers themselves seeking to get out of … poverty by finding work. LR impact on government finances and on the productive potential of the economy.
Progressive, efficient, risk taking, fiscal, mentality, relative
Does income inequality have to come down?
Income inequality → impacts gov finances to help the poor and social costs
Normative consideration = gov perceives Gini to be too high, trying to reduce it should not conflict heavily with economic efficiency or else gov failure will result
Some income inequality = incentive to gain education and skills
Targeting low income inequality levels through excessive gov intervention = remove incentive to gain skills, reducing productive capacity of economy and LR growth rates
Marginal revenue product (MRP)
Additional revenue a firm earns from employing one more worker