Unit 2 - Agricultural Production, Pollutants, and BMP
 Call Kai
 Learn
Learn Practice Test
 Spaced Repetition
 Match
Match Flashcards
 Knowt Play
1/69

There's no tags or description
Looks like no tags are added yet.
Name | Mastery | Learn | Test | Matching | Spaced | Call with Kai | Chat |
|---|
No analytics yet
Send a link to your students to track their progress
70 Terms
Population growth is the _______.
largest factor for food demand
More people = more demand for food production

97% of world’s population increase is in ______.
Asia, Africa, and Latin America
Food supply problems in fast growing areas
Factors influencing Food Demand
population growth
increased wealth/incomes
Higher incomes means _______ .
increased demand for higher quality foods such as meats and dairy products
More energy to produce animal meat, loss of energy as you go up food chain
1 lb of chicken requires 2 lbs of grain, 1 lb of beef requires 7 lbs of grain
40% of world grain production goes into livestock feed
Definition of Hunger in reference to the Basal Metabolic Rate (BMR)
Minimum amount of energy to power human body maintenance, not including energy for activity
Under 1.2 BMR food intake/day is undernourished
840 million undernourished worldwide
Most of world’s hungry live in southeast Asia, Africa (south of Sahara) and Andean region of South America
Causes of Hunger
Uneven distribution of food and poverty
Uneven distribution of food
Global food production from farms, ranches and fisheries is enough to provide world’s population with 3,800 calories/day
Countries with limited natural resources / technology for food production face widening gap between food needs and food production – rely on imports
High-quality diets are less energy efficient:
- If all grains were rationed across countries evenly, without any livestock feed diversions, it would feed 6+ billion
- Diet with 15% animal products, rationed evenly would feed 4 billion
- Diet with 30% animal products would feed 2 billion
Uneven distribution of poverty
Poverty – wealthy eat relatively well in all countries, poor do not
Over 1 billion people live in absolute poverty, 2 billion more near poverty
Increases in food supply will not mean much if there are not various social and economic improvements to increase their (poor) ability to purchase food
Prospects for reducing world hunger → more land where?
By the 1950’s most of the better crop land was already in cultivation
Marginal farmable land was cleared, ditched, drained, modified for increased crop production
Since mid 1960’s total global acreage devoted to agriculture increased by only 8%, but population increased by 100+%, most in developing countries
Finite supply of good farmland
Production increases in 1970’s and 1980’s due to intensive management of marginal lands → helped fill the gap for land and population demands - Heavily subsidized irrigation (government financial support that lowers the cost of water and irrigation infrastructure) - not sustainable - depleting streams and aquifers
Prospects for reducing world hunger → agricultural production increase?
South America and Africa
Good undeveloped land for agriculture
Lack transportation infrastructure (Roads, Railways, Ports) to get products to markets
No close markets
Two most populous nations (China and India), no good farmland left
Loss of good farmland
Urban development
Erosion
Desertification = land becomes desert-like due to water not being managed correctly
Salinization = sea level rise & irrigation water adding salt content to soil
Prospects for reducing world hunger → Yield increases?
Improving yield per acre
Corn yields on farms quadrupled from 1940-1985 in US
1. Mechanized equipment
2. Soil conservation practices
3. Fertilizers
Wheat, rice, barley, rye, peanuts and sorghum also increased
Great Britan tripled wheat production from 1940-1984.
Plant breeding, seed stock, fertilizers, equipment, herbicides (kill weeds), pesticides, etc.,
Yield ceiling- no more gains/acre (you can only get so much from the land)
Environmental impact of unused (by crops) fertilizers, chemicals → runoff containing these chemicals
Methods for Reducing Post-Harvest Food Losses
Better methods of handling and protecting food between harvest and consumer plates → Much lost to rats, birds, insects and molds
Refrigeration and better storage containers
Discarding imperfectly looking food → 95 billion pounds of food thrown out /yr
Eating Lower on the Food Chain
1. Eat corn, wheat, oats, not beef
2. Could increase food supply 20-30%
3. Not going to happen, meat production in developing countries now exceeds industrialized countries
The plant essential nutrients hydrogen, oxygen, and carbon come _________.
from the atmosphere
Primary macronutrients
Needed in relatively large amounts for crop growth
nitrogen, phosphorus, and potassium (the big three → typically what limits crop yields)

Secondary Macronutrients
Needed in relatively large amounts for crop growth but are required in smaller amounts than primary nutrients
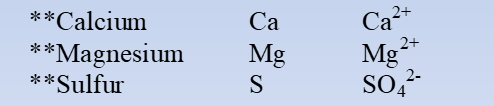
calcium, magnesium, and sulfur
Factors Affecting Nutrient Use Efficiency
Climate, precipitation, temperature (frost) etc.,
Soil type - influences water movements and soil retention - sandy (not a lot of plant available water), clayey and organic both hold more soil moisture
Crop type and variety - corn, soybeans, etc.,
Nutrient application
- rate, timing, placement, source
Cultural practices - standard tillage, rip, conservation tillage (minimizes soil disturbance), no-till (no soil disturbance)
Cation Exchange Capacity (CEC)
Sum of exchangeable cations that a soil can adsorb (cmol/Kg). Typically increases with increasing clay and organic matter content.
Most soils’ have a slight negative charge → cations stick to soil particles

Nutrient Retention and Mobility
cations will be held in the soil
anions cannot stick to the soil surface (like charges repel) and are highly mobile

Soil pH
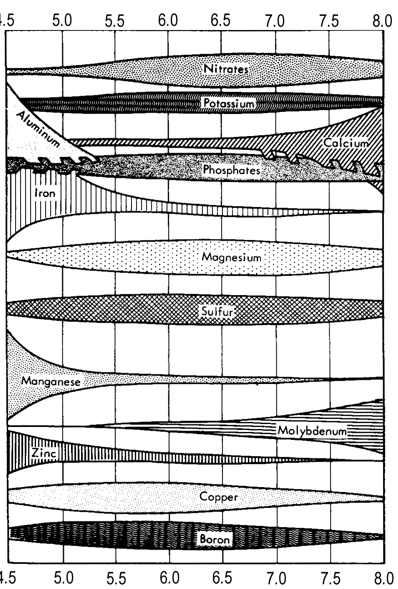
Changes in pH affect nutrient availability → a neutral pH and slightly acidic pH maximizes the availability of the majority of essential nutrients
Can limit root growth under extremely acidic conditions
Can affect the microbial population in the soil
Pollutants in NC’s Surface waters
Sediment → soil particles that wash off → consider the worst water pollutant by the EPA
Nutrients → Phosphorus and nitrogen
Bacteria → Potential bacteria that cause diseases
Pesticides
Low Dissolved Oxygen → Oxygen levels too low to support aquatic life
In Freshwater systems (ponds, lakes, streams), _______.
Phosphorus causes algae blooms
Levels of phosphorus are as little as 0.03 ppm
In Saltwater systems (estuary, sounds) _______.
Nitrogen causes algae blooms
Levels of nitrogen causing blooms are 0.1 to 1 ppm
Nitrogen
Generally the most limiting nutrient for plant growth → needed in high quantities for plants
78% of all nitrogen is gas and unavailable to plants
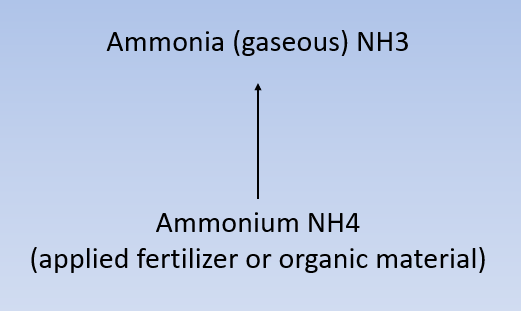
Ammonia (NH3) and nitrate (NO3-) are nitrogen sources for the soil

Volatilization of N
Loss of applied N fertilizer to the atmosphere- NH3 via atmospheric
deposition downwind of source, can cause contribute significant amounts
of N to surface waters
Nitrification
Changing Ammonium to Nitrate
Nitrate is an anion (negatively charged) and very mobile in most soils.
It can leach into the groundwater system, move with GW and discharge
Into surface waters. Nitrification requires aerobic conditions.

Immobilization/Plant Uptake
Incorporation of NH4 and/or NO3 into plants, microorganisms
Soil organic material
Nitrogen in organic matter that is bound/mixed in with mineral soil
Nitrate Loss to Drainage Waters from Cultivated N.C. Coastal Plain Soils
moderately drained soils = loose more pounds of N per acre per year due to higher infiltration rates than poorly drained soils (N will actually get to plants)

Surface Runoff vs Subsurface Leaching Nitrogen Losses
Most nitrogen is transported to surface waters via subsurface flow (groundwater system) in the NO3-N form. Some organic matter may attach to sediment and
can be delivered to surface waters via erosion and overland flow.
most loss is due to GW leeching not surface runoff

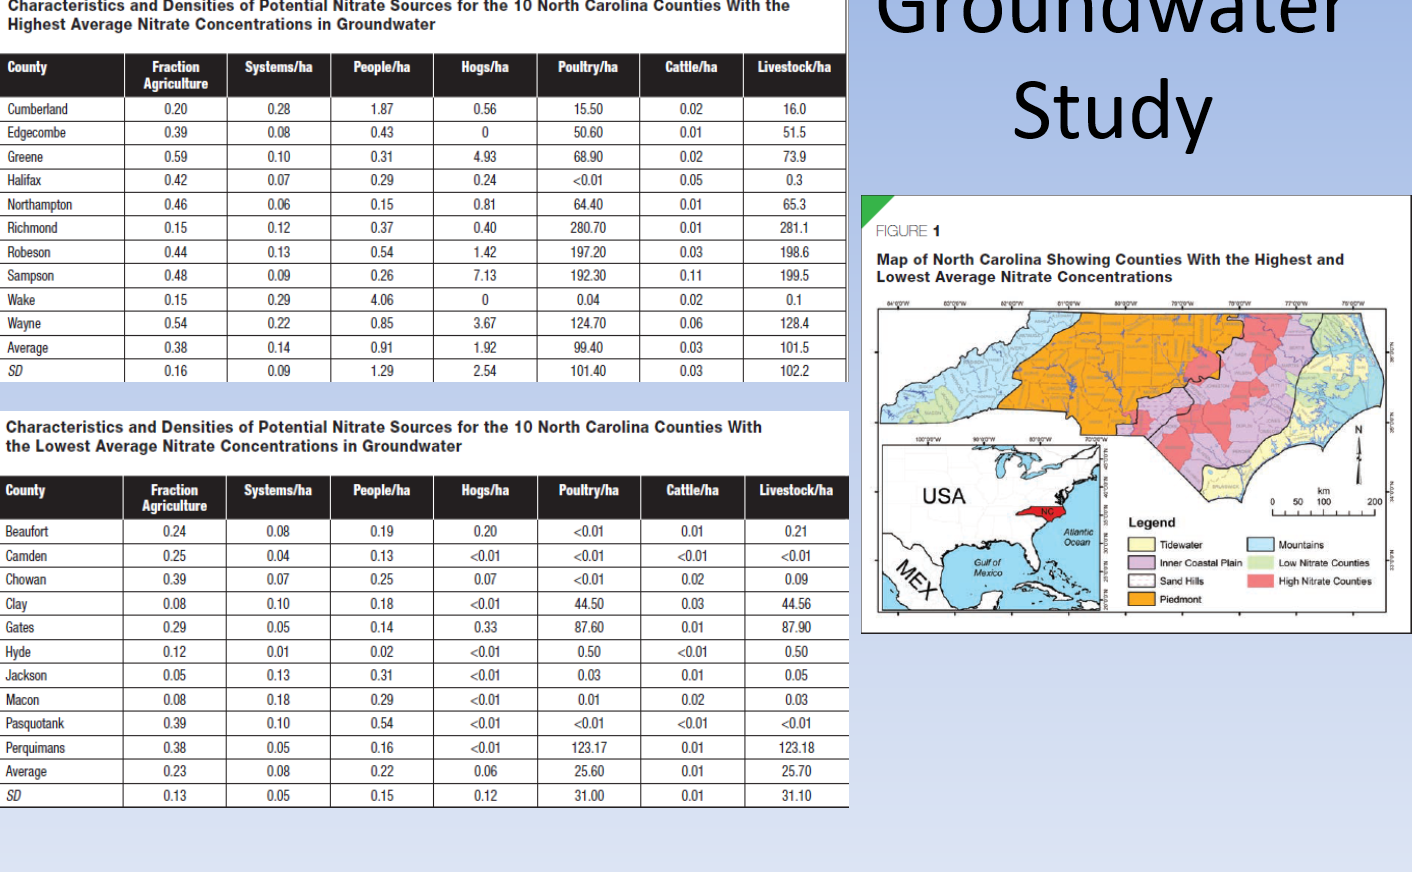
Differences in land-use and soil types can _________.
influence the amount of nitrate in GW
Phosphorus moves ________.
differently than nitrogen
How much phosphorus is lost depends on?
Crop
Tillage
Slope
Soil Texture
Soil Test P = how much P is in soil to begin with
Type of Applied P
BMPs that limit loss
Rainfall
Phosphorus movement
P will sorb/temporarily stick to the soil → extracted by plants (diffused from high to low concentrations)
P is mainly lost through overland flow (runoff)
Practices that reduce erosion reduces P-attached sediment loss
If all exchange sites in the soil are filled with P → will just leech through
Soluble P → was sticking to an iron oxide → oxidized → releases P
Water and sometimes P will move → goes through GW system

Soil Test Interpretation
When the PI exceeds 50 → no need to add more → will give no yield increase

Phosphorus
loss Primarily overland (surface)
Attached to soil
Soluble forms
Sometimes leaches when phosphorus levels are very high
Nitrogen
Primarily leaches (subsurface)
- Nitrate-nitrogen → anion → repels soil particles → lost
Sometimes flows overland (Mostly as organic nitrogen)
Water Erosion
Natural process of soil movement from higher areas to lower areas by action of water flowing downhill.
When precipitation rates are greater than infiltration rates, overland flow occurs, Increasing potential for erosion.
Activities which result in loss of vegetative cover over soil and disturbance of soil surface increase risk of erosion.
Steep slopes, high runoff velocities also increase risk of erosion
Water erosion results from:
1)Detachment- soil detached when rain drops impact exposed soil
2)Transport- flowing water carries soil particles
3)Deposition – water velocity slows and soil particles settle
Sediment
A major water quality problem – EPA says the greatest pollutant in U.S.
Prevents light penetration (increases turbidity)
Coats aquatic vegetation
Clogs fish gills
Deposition can reduce reservoir life and for navigable channels dredging may be necessary
Many chemical species sorb (heavy metals, phosphorous, etc) to sediment and are often transported with sediment.
BMPs for erosion
Grassed waterway = water hits the grass → grass holds the bank in place
Sediment basin = sediment will fall out in basin (traps it before it leaves the farm; placed in the lowest part of the farm)
Conservation Tilling = during the off-season leave up old crops
Riprarian Buffer and Fencing = Used to keep cows and livestock out of waterways → will eat the vegetation along the banks and their hooves can disrupt the soil
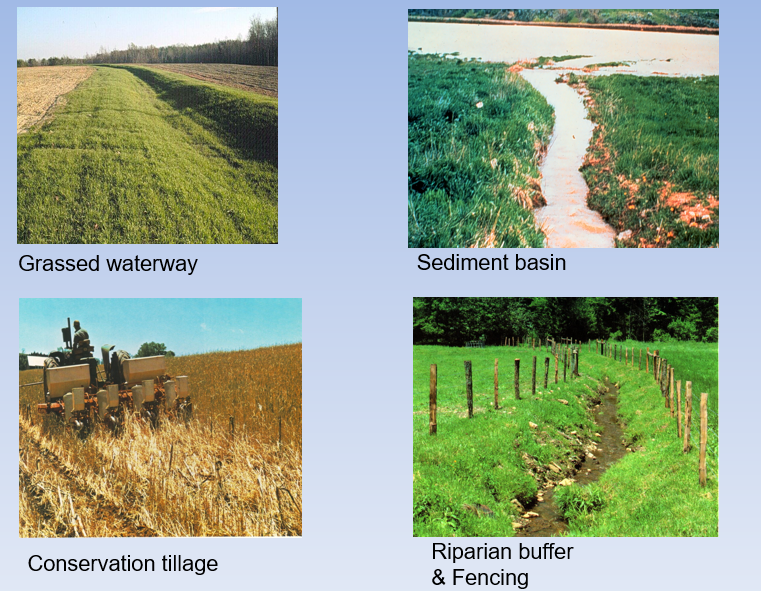
Agricultural Best Management Practices reduce transport of pollutants to surface and Groundwater by:
1) Minimizing availability of pollutants
2) Slowing the transport and/or delivery of the pollutant
3) Remediating or intercepting the pollutant before or after it is delivered to the water resource through chemical or biological transformation
Where Do Agricultural BMPs Control Nutrient and Sediment?
At the source → nutrient management
During transport → cover crops and controlled drainage
At the water’s edge or in the water → buffers and controlled drainage
Nutrient Management
Development, implementation and periodic maintenance of a plan to apply nutrients at rates necessary to:
Achieve realistic crop yields = only put a fertilizer amount that matches the crop yields
Improve timing of nutrient applications = only put fertilizer out when crops need it during their life cycle
Increase nutrient use efficiency (reducing susceptibility to loss)
Main elements of Nutrient Management
Source - fertilizers, manure, Legumes (often use as a fertilizer source for the next crop as it can take N2 from the atmosphere), etc.
Timing - apply in accordance with crop needs
Placement - availability, uptake, loss potent.
Amounts - soil potential (RYE - Realistic Yield Expectations and N factor)
For nutrient management, site assessment and Recommended Site Specific Practices ________.
vary by the site
Published soil surveys are a part of _______.
nutrient management plans
include aerial photographs with overlays of the different
soil series in the area
Help understand soil types of the land
Provide important information about soil properties such as depth to water table, permeability, and texture.
Great resources for many different applications concerning
land use.

For a Nitrogen management plan, the LBS. N per acre is determined by:
RYE (Realistic Yield Expectations) x N Factor

Cover Crops
Planted after harvest → Uptake left over from previous crops and prevent loss during typical fallow periods. Also, provide ground cover, may help improve soil structure, OM content, and help reduce erosion (therefore reducing P, sediment, and chemical transport).
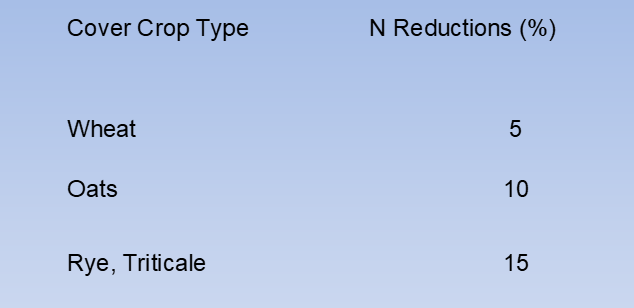
Controlled Drainage
Water management practice that utilizes water control structures such as a flash board riser to adjust (raise or lower) the drainage outlet elevation, thereby adjusting the water level elevation of the area draining to the water control structure and outlet.
Flash boards dam the water → forces water levels in the field to the ground surface to get to the ditch and leave
Changes the hydraulic gradient
Dissolved oxygen will drop due to organic matter causing anaerobic conditions and then bacteria will break down nitrogen (denitrification) → N2 goes to the atmosphere
Improves downstream water quality by holding back the water with fertilizers and pesticides

Controlled Drainage Design Specifications
Used in geographic regions where the land is flat (typical slopes of ~0.5%) Tidewater regions of NC, and lower coastal plain
Structure size depends on drainage area.
Pipe diameter is directly related to the watershed size, riser height is
dependent upon the depth of the ditch/channel.
Bigger structures will have concrete/cement holding it in place
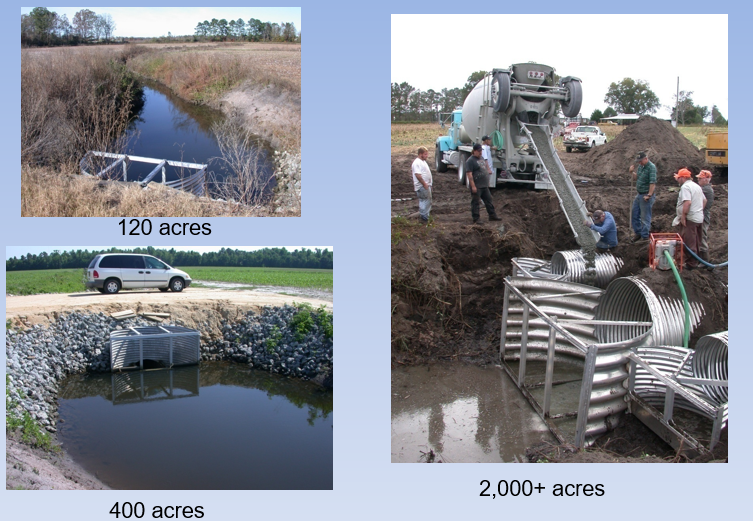
Outflow Monitoring on Controlled Drainage devices
Notches can be carved into the flashboards to function as weirs. With automated water level loggers, discharge can be calculated over time. Water level is manually checked using the stream stage gage.
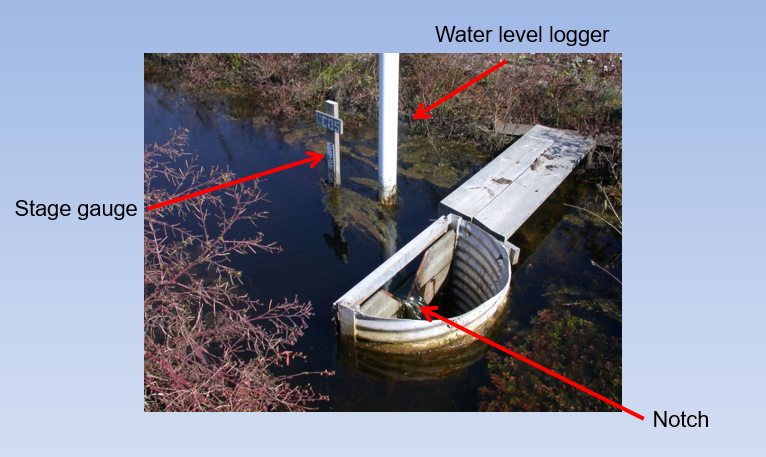
Controlled Drainage Benefits
Reduces outflow by an average of 20-30%, but is greatly influenced by soil type, rainfall, type of drainage system and management intensity
Provides a higher water table in the fields, promoting denitrification- NO3-N concentrations 10-20% lower (relative to conventional drainage) have been demonstrated.
Combined effects of reduced outflow and reduced concentrations equate to an overall 45% N load reduction.
Phosphorus transport reduced by 35% relative to conventional drainage
Successful management of controlled drainage focuses on: 1) optimum production efficiency and nutrient utilization by crop and 2) maximum water quality benefits

Summary of Controlled Drainage
•Reduces the amount (volume) of water leaving the farm (N and P)
•Denitrifies the nitrogen at the ditch edge (N).
•Increases crop growth (N and P).
–Greater yields mean that more nitrogen and phosphorus is used by the crop.
Buffers
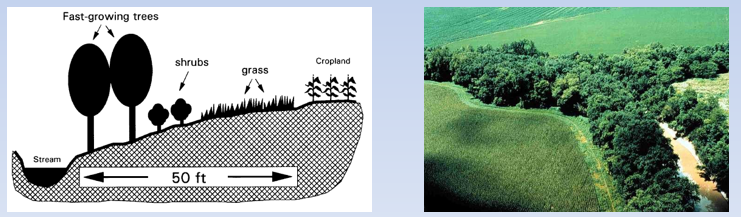
Vegetated areas adjacent to waterways, drainage canals, lakes, etc., that serve to reduce nutrient, sediment and other pollutant transport from uplands to surface waters → Combination grass, shrub and forested buffers work well
Forested- woody vegetation, mostly trees adjacent to streams; deep tree roots can take up runoff
Shrub- wax myrtles, elderberry, small, slow growing trees
Grass- groundcover to stabilize soil, encourage sheet flow, reduces erosion
Riparian Buffer Zones
Requires 50 feet of riparian area be protected on waterways in the Neuse and Tar-Pamlico Basin.
Zone 1 = If you have a forest management plan you can legally harvest trees for timber
Zone 2 = You can thin trees in this zone

Buffer Effectiveness
The potential for buffers to reduce nitrogen loadings to streams is greatly dependent upon the groundwater depth and flow path relative to the riparian vegetation root zones.
Groundwater well below → not as effective
Groundwater closer to the root zone → more effective

Phosphorous Removal in Buffers
Phosphorus contributions to stream reduced due to sediment settling out in the buffer. The vegetation slows the rate of overland flow, and the sediment falls and becomes buried in buffer. Also, some P may be Immobilized by microorganisms or used by plants if they are released from soil.
As buffer width increases, sediment reduction % increases. However, increasing the buffer widths in coastal plains from 14 to 28’ does not provide as much incremental (% difference) benefits as in the piedmont.
The piedmont region has sleeper slopes → surface runoff moves at a high velocity and carries a heavier sediment load

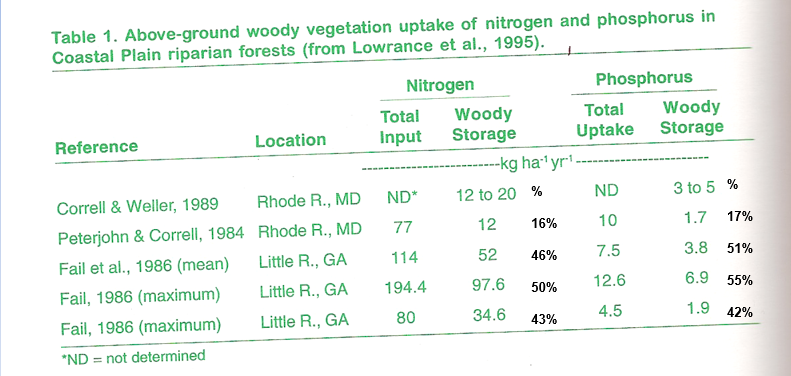
For Riparian Vegetation Storage of Nutrients, _______.
tree uptake and storage of nitrogen and phosphorus can be significant. However, nitrogen reduction potential is greatest via the denitrification pathway.
Buffer Width and Phosphorus Removal
As buffer width increases, phosphorus deliver to waterways decreases.
After 15 ft, the benefits of additional buffer width declines.
1 on y-axis → everything leaves a creek

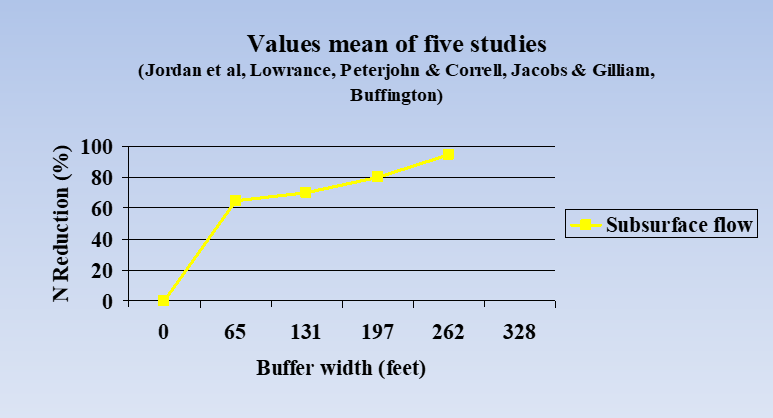
Nitrogen Reduction Through Riparian Buffers (Subsurface)
After 65 ft, starts to taper off in the increase of %
Stream Restoration
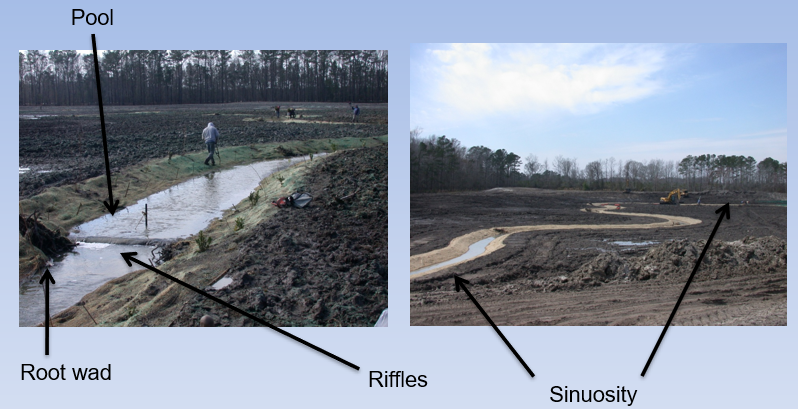
Converting modified streams back to a more natural appearance/characteristics
more meandering, planting vegetation, root wads for habitat and erosion control
Natural characteristics to restore: 1) Stream sinuosity (meander) 2) Flood plain connectivity - overbank flow from stream to
floodplain area adjacent to stream with wetland vegetation
3) Aquatic habitat - structures in stream channel such as
uprooted trees that provide shelter for aquatic organisms
4) Ripple and pool complexes - stream bed features that provide
areas of relatively deep water (pools) and small water fall like
features that oxygenate the water

Stream Restoration Construction
Stabilizing the stream bank with turf mats and root clusters
Root wads for habitat and erosion control
Pool - deeper area of water
Riffle - area where water flow is turbulent and water becomes oxygenated
Sinuosity- meandering or snaking of stream
Root wads in the stream provide stream bank stability and aquatic habitat
Wetland Criteria
Wetland hydrology - The land must be saturated to the surface or be flooded (moving water) or ponded (stagnant water) during the growing season such that the wetness has an overriding effect on vegetation and soils.
Wetland soils - Formed under conditions of saturation, flooding, or ponding that lasted long enough during the growing season to develop anaerobic conditions in the upper part. Ex. Leaf, Rains, Pantego
Wetland vegetation - Plants that grow and reproduce in soils that
are waterlogged and reduced. Ex. Cypress, Rush, Spartina and Water Tupelo
Wetland Restoration
The return of a wetland from a disturbed or altered condition by human activity to a previously existing condition.
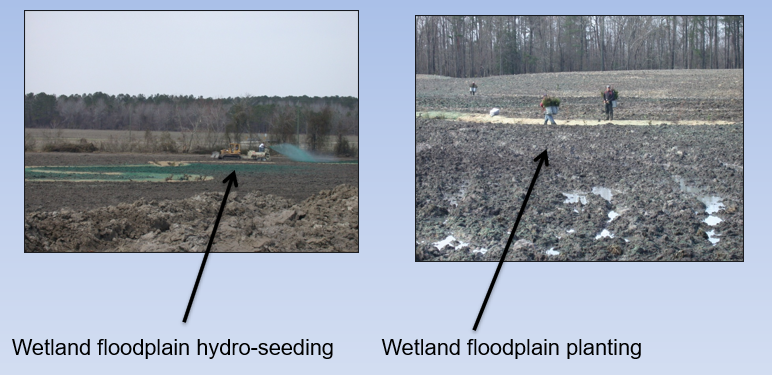
Restoring wetland hydrology through Wetland floodplain excavation → removing soil to get closer to water table and thus restore wetland hydrology
Wetland planting → hydroseeding (wetland seed is mixed with water, fiber, nutrients and dye and sprayed onto the area on interest) and floodplain planting (people physically plant stuff in the soil)
After a wetland restoration, _______ is performed.
water quality monitoring
Nitrogen, Phosphorus, and Sediment analysis from automated and manual water samples
Bacteria analysis on manual water samples

BMP control pollutants when _______.
You have selected the correct BMPs
BMPs have been put in the most critical areas of a watershed or river basin
- Critical areas are the watershed areas that generate the greatest proportion of pollution
Most of the critical areas have been treated with BMPs
BMPs are managed and maintained
BMP Recommendations - Lower Coastal Plain
Controlled drainage with 3-6 ft vegetated buffers along field ditches, nutrient management
Riparian buffers along larger streams (25 ft of woody vegetation)
BMP recommendations - Middle and Upper Coastal Plain
On average contributes most nitrogen/area
Deeper ditches that intercept shallow subsurface flows have elevated N concentrations, shallow ditches lower concentrations
Riparian buffers (25 ft + some grass), controlled drainage (flat fields), nutrient management and in-stream wetlands
BMP Recommendations - Piedmont
Steeper slopes and more clayey soils increase risk of erosion relative to coastal plain.
Planting on terraces, contour farming, conservation tillage, grassed waterways and field borders can also reduce erosion but not necessarily N transport. Therefore, riparian buffers (50 ft) recommended with 25 ft of grass and 25 ft of forest.
May need a level spreader to prevent gullies and provide sheet flow into buffer.
BMP Recommendations - Mountains
Mostly pasture land - buffers (25 – 50 ft) with fencing to prevent cattle from degrading streams