Chapter 15 - Monopolistic Competition and Product Differentiation

0.0(0)
studied byStudied by 1 person
learnLearn
examPractice Test
spaced repetitionSpaced Repetition
heart puzzleMatch
flashcardsFlashcards
Card Sorting

1/14

encourage image

There's no tags or description

Looks like no tags are added yet.

Study Analytics
Name
Mastery
Learn
Test
Matching
Spaced

No study sessions yet.

15 Terms

1
New cards

Super Snacking Services is a typical monopolistically competitive firm. Initially, the market is in the long-run equilibrium, and then there is an increase in the market demand for snacks. In the short run, the price of snacks will _________, and the market output of snacks will ________.

(A) fall; fall

(B) remain unchanged; remain unchanged

(C) rise; rise

(D) rise; fall

rise; rise

2
New cards

How could firms in a perfectly competitive market move their market towards a monopolistically competitive market?

(A) Attempt to price fix

(B) Attempt to create a cartel

(C) Attempt to conduct game theory

(D) Attempt to create a brand for their product

Attempt to create a brand for their product

3
New cards

(Figure: Monopolistic Competition in the Market for Designer Clothing) Use Figure: Monopolistic Competition in the Market for Designer Clothing. The figure illustrates a firm in the ______; in the _______, the demand and marginal revenue curves will shift to the _________.

A graph plots Price, cost, marginal revenue in the vertical axis versus Quantity in the horizontal axis. The vertical axis has two markings from bottom to top, A T C subscript M and P subscript M. The horizontal axis has a marking, Q subscript M. The rectangular region between price A T C subscript M and P subscript M, to the left of quantity Q subscript M is shaded and labeled, “Profit.” A line labeled, “M R,” starts close to the top of the vertical axis and ends above the horizontal axis, just beyond the tick mark on the axis. A line labeled, “D,” starts at a point to the right and above the starting point of the previous line and ends above the right end of the horizontal axis. This line passes through (Q subscript M, P subscript M). A curve labeled, “M C,” is a concave up increasing curve that intersects the M R line at Q subscript M. An almost concave up curve labeled, “A T C,” has its decreasing portion passing through (Q subscript M, A T C subscript M). It intersects the M C curve and line D.

(A) long run; short run; right

(B) short run; long run; left

(C) short run; long run; right

(D) long run, short run; left

short run; long run; left

4
New cards

Which of the following events could possibly shift the supply curve to the left and raise prices in many markets in our economy?

(A) the Eversource rate hikes

(B) All 3 of the possible answers listed here could shift the supply curve to the left

(C) The potential railroad strike

(D) The political unrest in China

All 3 of the possible answers listed here could shift the supply curve to the left

5
New cards

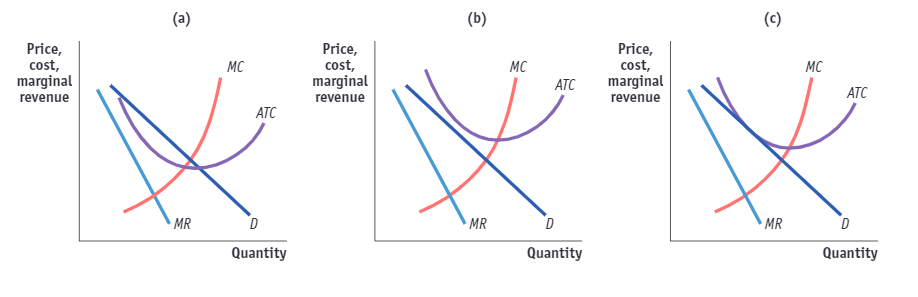
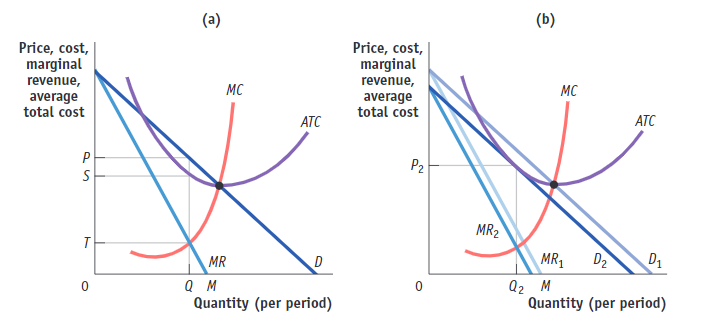
(Figure: The Market for Designer Boots in Monopolistic Competition II). Use Figure: The Market for Designer Boots in Monopolistic Competition II. Which panel(s) in the figure show(s) a monopolistic competitor in the long run equilibrium?

Three graphs, a, b, and c, plot Price, cost in the vertical axis versus Quantity per period in the horizontal axis. In graph a, there are two markings, labeled F and G from the top, on the vertical axis and one marking on the horizontal axis. A line labeled, M R, starts close to the top of the vertical axis and ends on the horizontal axis. A line labeled, D, starts at a point to the right and above the starting point of the previous line and ends on the right end of the horizontal axis. This line passes through the intersection of the tick mark on the horizontal axis and the marking F on the vertical axis. The intersection point is labeled L. A curve labeled, M C, is a concave up increasing curve that intersects the M R line at point N, which is directly above the tick mark on the horizontal axis. The M C curve intersects the D line at point O. A curve labeled, A T C, is a U-shaped concave up increasing curve that passes through the intersection of the tick mark on the horizontal axis and the marking G on the vertical axis. The A T C curve touches M R line at point M and intersects the D line at points K and P. The points marked on the D line from top to bottom are as follows: K, L, O, and P. In graph b, there is one marking, labeled H, on the vertical axis and one marking on the horizontal axis. A line labeled, M R, starts close to the top of the vertical axis and ends on the horizontal axis. A line labeled, D, starts at a point to the right and above the starting point of the previous line and ends on the right end of the horizontal axis. This line passes through the intersection of the tick mark on the horizontal axis and the marking H on the vertical axis. The intersection point is labeled Q. A curve labeled, M C, is a concave up increasing curve that intersects the M R line at point S, which is directly above the tick mark on the horizontal axis. The M C curve intersects the D line at point T. A curve labeled, A T C, is a U-shaped concave up increasing curve that passes through the intersection point Q. The A T C curve intersects the M C curve at point R. In graph c, there are two markings, labeled I and J from the top, on the vertical axis and one marking on the horizontal axis. A line labeled, M R, starts close to the top of the vertical axis and ends on the horizontal axis. A line labeled, D, starts at a point to the right and above the starting point of the previous line and ends on the right end of the horizontal axis. This line passes through the intersection of the tick mark on the horizontal axis and the marking J on the vertical axis. The intersection point is labeled V. A curve labeled, M C, is a concave up increasing curve that intersects the M R line at point X, which is directly above the tick mark on the horizontal axis. The M C curve intersects the D line at point W. A curve labeled, A T C, is a U-shaped concave up increasing curve that passes through the intersection of the tick mark on the horizontal axis and the marking I on the vertical axis. The intersection point is labeled T. The A T C curve intersects the M C curve at point U.

(A) panels (a), (b), and (c)

(B) panel (c) only

(C) panel (b) only

(D) panel (a) only

panel (c) only

6
New cards

When we compare the long run conditions of a Perfectly competitive firm to the long run conditions of a Monopolistically competitive firm we see that the Perfectly competitive firm is

(A) less productive and cost efficient than the Monopolistically Competitive firm

(B) less productively efficient and more cost efficient than the Monopolistically Competitive firm

(C) more productively efficient and less cost efficient than the Monopolistically Competitive firm

(D) more productively efficient and cost efficient than the Monopolistically Competitive firm

more productively efficient and cost efficient than the Monopolistically Competitive firm

7
New cards

Florists in the town of Minerva, Illinois, operate in a monopolistically competitive market. The price in long-run equilibrium for a flower shop is _______, and output is ________, than would be the case for a perfectly competitive firm with an identical production function and cost curves

(A) higher; higher

(B) higher; lower

(C) lower; lower

(D) lower; higher

higher; lower

8
New cards

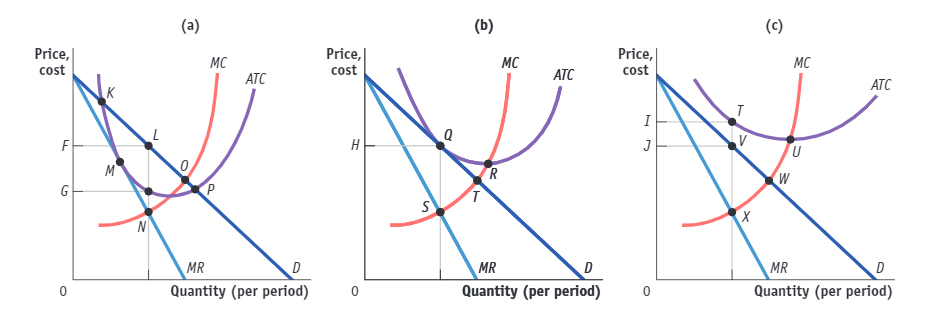
(Figure: The Market for Designer Boots in Monopolistic Competition). Use Figure: The Market for Designer Boots in Monopolistic Competition. A positive economic profit will be earned if the profit-maximizing price is _____ in panel _________.

Three graphs, a, b, and c, plot Price, cost in the vertical axis versus Quantity per period in the horizontal axis. In graph a, there are two markings, labeled F and G from the top, on the vertical axis and one marking on the horizontal axis. A line labeled, M R, starts close to the top of the vertical axis and ends on the horizontal axis. A line labeled, D, starts at a point to the right and above the starting point of the previous line and ends on the right end of the horizontal axis. This line passes through the intersection of the tick mark on the horizontal axis and the marking F on the vertical axis. The intersection point is labeled L. A curve labeled, M C, is a concave up increasing curve that intersects the M R line at point N, which is directly above the tick mark on the horizontal axis. The M C curve intersects the D line at point O. A curve labeled, A T C, is a U-shaped concave up increasing curve that passes through the intersection of the tick mark on the horizontal axis and the marking G on the vertical axis. The A T C curve touches M R line at point M and intersects the D line at points K and P. The points marked on the D line from top to bottom are as follows: K, L, O, and P. In graph b, there is one marking, labeled H, on the vertical axis and one marking on the horizontal axis. A line labeled, M R, starts close to the top of the vertical axis and ends on the horizontal axis. A line labeled, D, starts at a point to the right and above the starting point of the previous line and ends on the right end of the horizontal axis. This line passes through the intersection of the tick mark on the horizontal axis and the marking H on the vertical axis. The intersection point is labeled Q. A curve labeled, M C, is a concave up increasing curve that intersects the M R line at point S, which is directly above the tick mark on the horizontal axis. The M C curve intersects the D line at point T. A curve labeled, A T C, is a U-shaped concave up increasing curve that passes through the intersection point Q. The A T C curve intersects the M C curve at point R. In graph c, there are two markings, labeled I and J from the top, on the vertical axis and one marking on the horizontal axis. A line labeled, M R, starts close to the top of the vertical axis and ends on the horizontal axis. A line labeled, D, starts at a point to the right and above the starting point of the previous line and ends on the right end of the horizontal axis. This line passes through the intersection of the tick mark on the horizontal axis and the marking J on the vertical axis. The intersection point is labeled V. A curve labeled, M C, is a concave up increasing curve that intersects the M R line at point X, which is directly above the tick mark on the horizontal axis. The M C curve intersects the D line at point W. A curve labeled, A T C, is a U-shaped concave up increasing curve that passes through the intersection of the tick mark on the horizontal axis and the marking I on the vertical axis. The intersection point is labeled T. The A T C curve intersects the M C curve at point U.

(A) G; (a)

(B) I; (c)

(C) F; (a)

(D) H; (b)

F; (a)

9
New cards

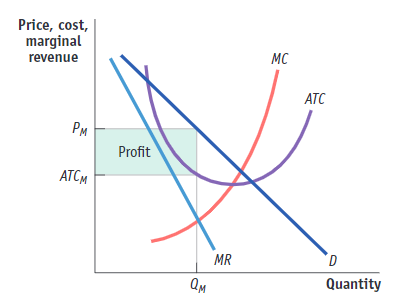
(Figure: Monopolistic Competition in the Market for Couture Clothing). Use Figure: Monopolistic Competition in the Market for Couture Clothing. If the firm shown in the figure maximizes its returns, it will:

A graph plots Price, M R, M C, A T C in the vertical axis versus Quantity in the horizontal axis. A line labeled, “M R,” starts close to the top of the vertical axis and ends at the horizontal axis, close to its mid-point. A line labeled, “Demand,” starts at a point to the right and above the starting point of the previous line and ends at the right end of the horizontal axis. A curve labeled, “M C,” is a concave up increasing curve that intersects the M R line and demand line. An almost concave up curve labeled, “A T C,” has its decreasing portion intersecting the M R line and its increasing portion intersecting the M C curve and A T C curve.

(A) break even

(B) earn a positive economic profit

(C) incur a loss

(D) incur a loss equal to its MR

earn a positive economic profit

10
New cards

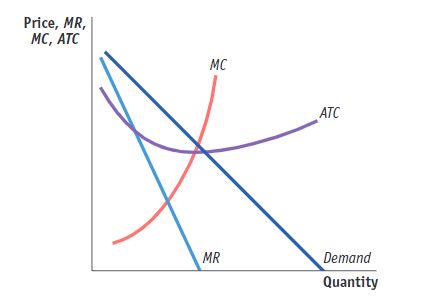
(Figure: Short Run and Long Run Profit in Monopolistic Competition). Use Figure: Short Run and Long Run Profit in Monopolistic Competition. In monopolistic competition, long-run equilibrium is characterized by:

Two graphs, labeled a and b, plot Price, cost, marginal revenue, average total cost, in the vertical axis versus Quantity, per period, in the horizontal axis. In graph, “a,” The vertical axis has 3 markings from bottom to top, T, S, and P. The horizontal axis has 2 markings from left to right, Q and M. Two lines, M R and D start at a point on the horizontal axis above price P. Line M R passes through (Q, T) and ends at (M, 0). Line D passes through (Q, P) and ends at a point to the right of (M, 0) on the horizontal axis. A curve labeled, “M C,” is a concave up increasing curve that intersects the M R line at (Q, T). An almost concave up curve labeled, “A T C,” has its decreasing portion passing through (Q, S). It intersects the M C curve and line D at a point. In graph, “b,” The vertical axis has a marking, P subscript 2. The horizontal axis has 2 markings from left to right, Q subscript 2 and M. Two lines, M R subscript 1 and D subscript 1 start at a point on the horizontal axis above price P subscript 2. Line M R subscript 1 ends at (M, 0). Line D subscript 1 ends at a point to the right of (M, 0) on the horizontal axis. Two more lines, M R subscript 2 and D subscript 1 start at a point on the horizontal axis above price P subscript 2 and below the starting point of the other 2 lines. Line M R subscript 2 ends at a point between (Q subscript 2, 0) and (M, 0). Line D subscript 2 ends at a point to the right of (M, 0) and to the left of the ending point of line D subscript 1on the horizontal axis. Lines D subscript 1 and D subscript 2 are parallel. Lines M R subscript 1 and M R subscript 2 are parallel. A curve labeled, “M C,” is a concave up increasing curve that intersects the all the lines. An almost concave up curve labeled, “A T C,” has its decreasing portion passing through (Q subscript 2, P subscript 2). It intersects the M C curve and line D at a point.

(A) profit maximization, which occurs where P = MR = MC

(B) P = MR

(C) P < MR

(D) P > MR

P > MR

11
New cards

For a monopolistically competitive firm, marginal cost is __________ in long run equilibrium.

(A) greater than price

(B) related to price but not in a predictable way

(C) equal to price

(D) less than price

less than price

12
New cards

How could firms in a monopolistically competitive market move their market towards an oligopoly market?

(A) play game theory

(B) Attempt to create a branding for their product

(C) lower prices

(D) attempt to create some barriers to entry

attempt to create some barriers to entry

13
New cards

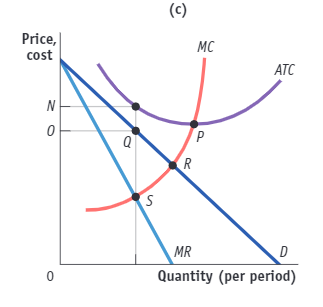
(Figure: Fast Food Profit in Monopolistic Competition III). Use Figure: Fast Food Profit in Monopolistic Competition III. The profit-maximizing quantity of output is determined by the intersection at point:

A graph, labeled c plots Price, cost in the vertical axis versus Quantity per period in the horizontal axis. There are two markings, labeled N and O from the top, on the vertical axis and one marking on the horizontal axis. A line labeled, M R, starts close to the top of the vertical axis and ends on the horizontal axis. A line labeled, D, starts at a point to the right and above the starting point of the previous line and ends on the right end of the horizontal axis. This line passes through the intersection of the tick mark on the horizontal axis and the marking O on the vertical axis. The intersection point is labeled Q. A curve labeled, M C, is a concave up increasing curve that intersects the M R line at point S, which is directly above the tick mark on the horizontal axis. The M C curve intersects the D line at point R. A curve labeled, A T C, is a U-shaped concave up increasing curve that passes through the intersection of the tick mark on the horizontal axis and the marking N on the vertical axis. The A T C curve intersects the M C curve at point P.

(A) P

(B) R

(C) S

(D) Q

S

14
New cards

(Figure: Perfect Competition and Monopolistic Competition in the Long Run). Use Figure: Perfect Competition and Monopolistic Competition in the Long Run. Which statement is False?

Two graphs, labeled a and b, plot Price, cost, marginal revenue in the vertical axis versus Quantity in the horizontal axis. Graph a is titled, “Long-Run Equilibrium in Perfect Competition,” and shows two curves and a line. The line is a horizontal from a value P subscript C equals M C subscript C on the vertical axis. The horizontal axis has a marking at Q subscript C. An almost concave up curve labeled, “A T C,” has its minimum at (Q subscript C, P subscript C). A curve labeled, “M C,” is a concave up increasing curve that intersects the line and A T C curve at (Q subscript C, P subscript C). Graph b is titled, “Long Run Equilibrium in Monopolistic Competition.” The vertical axis has 2 markings from bottom to top, M C subscript M and P subscript M. The horizontal axis has a marking at Q subscript M. Two lines, M R and D start at a point on the horizontal axis above price P subscript M. Line M R passes through (Q subscript M, M C subscript M) and ends above the horizontal axis, to the right of Q subscript C. Line D passes through (Q subscript M, P subscript M). A curve labeled, “M C,” is a concave up increasing curve that intersects the M R line at (Q subscript M, M C subscript M). An almost concave up curve labeled, “A T C,” has its decreasing portion passing through and intersecting line D at (Q subscript M, P subscript M).

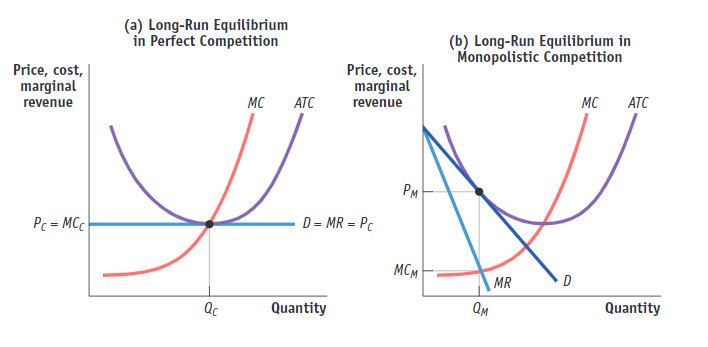
(A) Both panels show markets in which firms cover all of their implicit and explicit costs

(B) Firms in panel (a) cannot have profits in the long run, but those in panel (b) can

(C) Firm in the market shown in panel (a) produce identical products, whereas those in panel (b) produce similar but differentiated products.

(D) Both panels show markets that have many firms

Firms in panel (a) cannot have profits in the long run, but those in panel (b) can

15
New cards

Coors is a widely recognized brand name. During the World Series each year, this beer company has many of the most successful ads. Which statement is TRUE about advertising for Coors?

(A) It decreases the costs of supplying Coors

(B) It is designed to increase the demand for Coors

(C) It is designed to increase excess capacity

(D) It guarantees customers that Coors tastes better than do other beers.

It is designed to increase the demand for Coors