Momentum Trading Charts
1/98
There's no tags or description
Looks like no tags are added yet.
Name | Mastery | Learn | Test | Matching | Spaced |
|---|
No study sessions yet.
99 Terms
What 2 intraday patterns does this image represent?
Bull Flags and Flat Tops
What intraday pattern does this image represent?
Bull Flags
What intraday pattern does this image represent?
Bull Flags
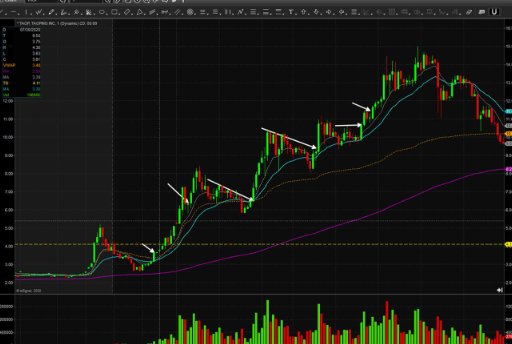
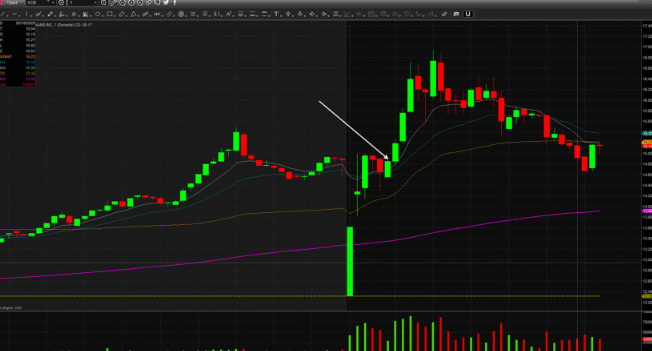
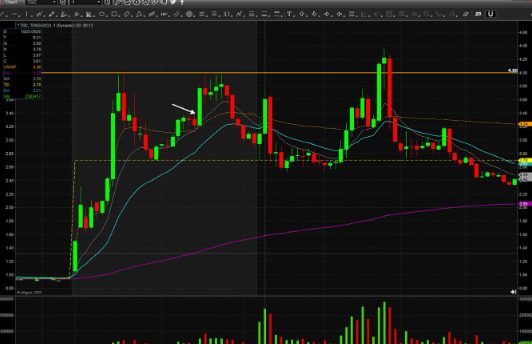
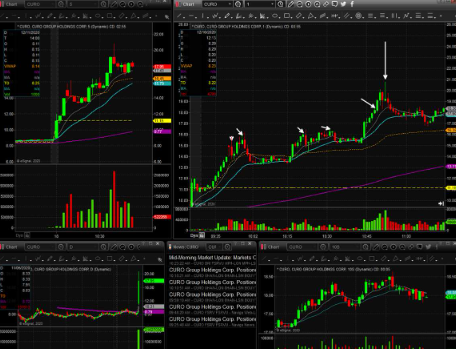
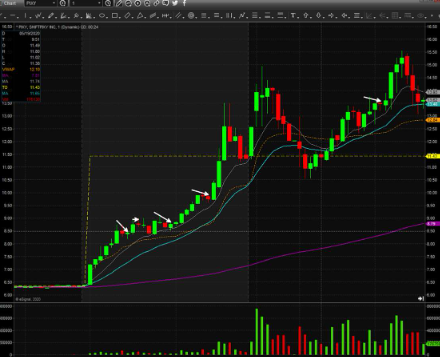
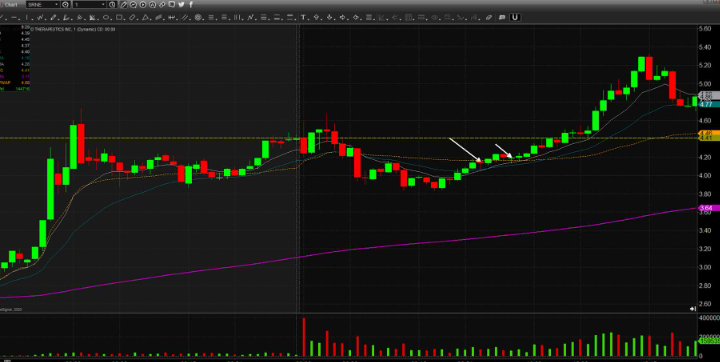
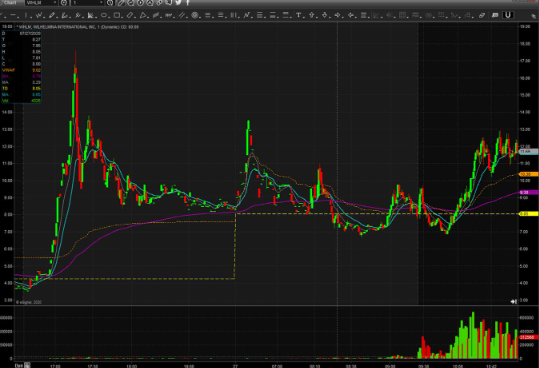
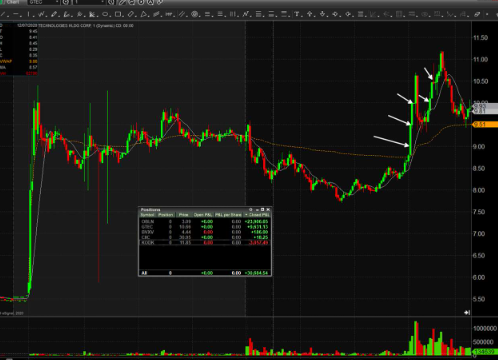
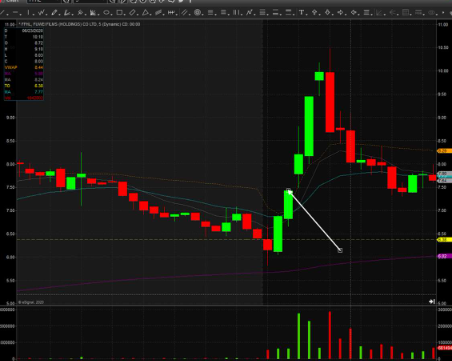
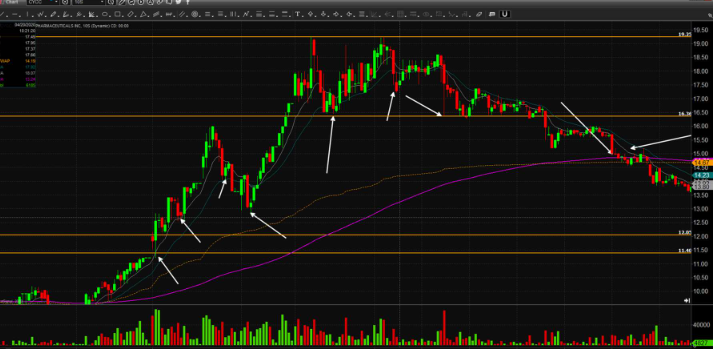
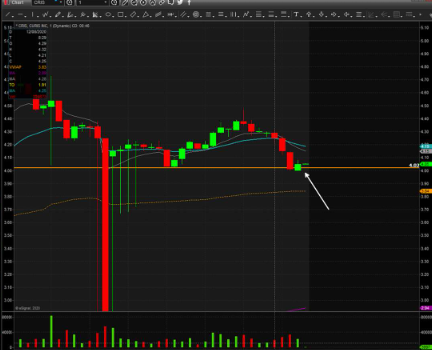
What 2 momentum setup does this image represent?
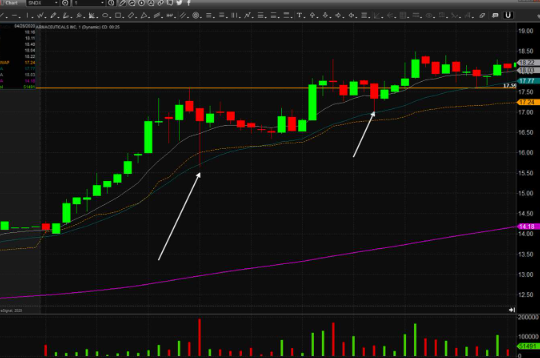
First Pullback after Break of VWAP
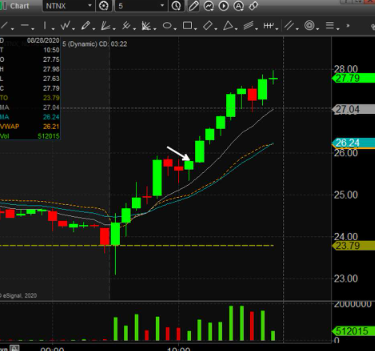
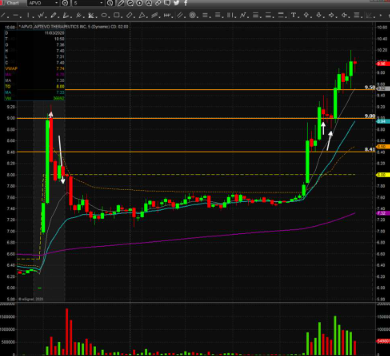
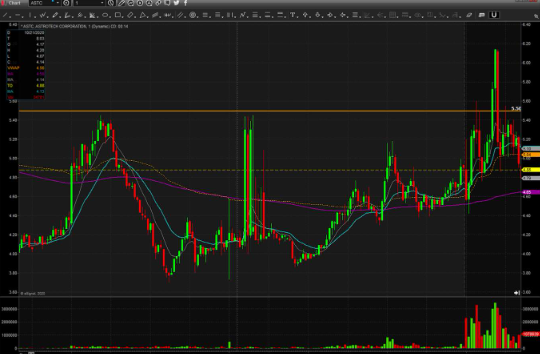
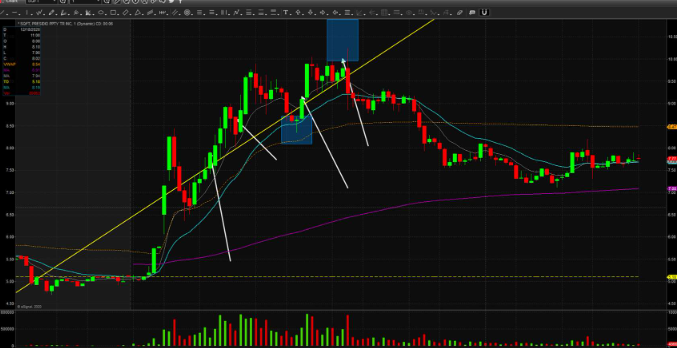
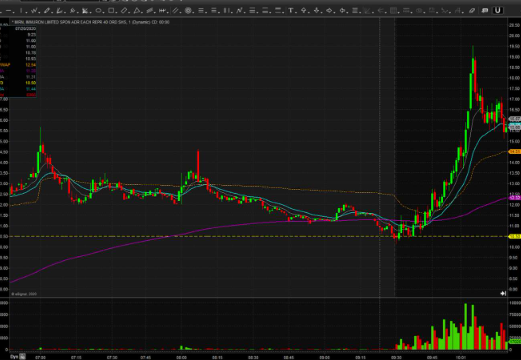
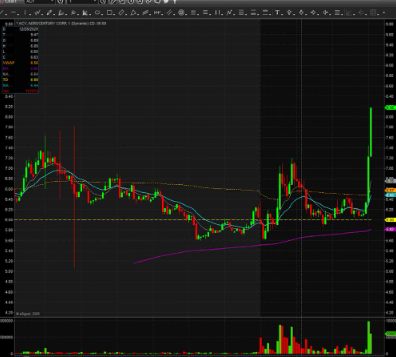
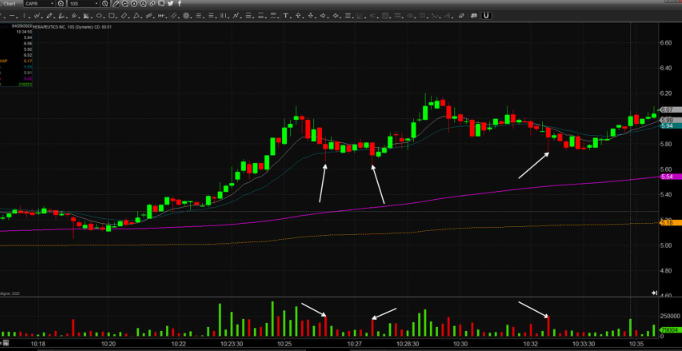
What momentum setup does this image represent?
First Pullbacks
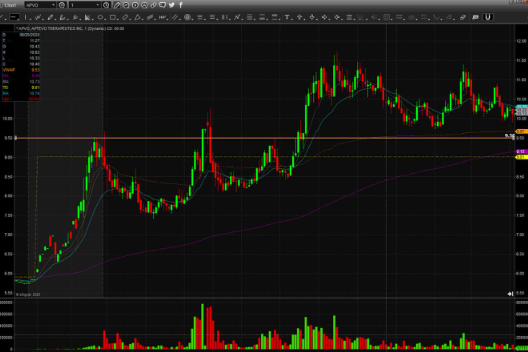
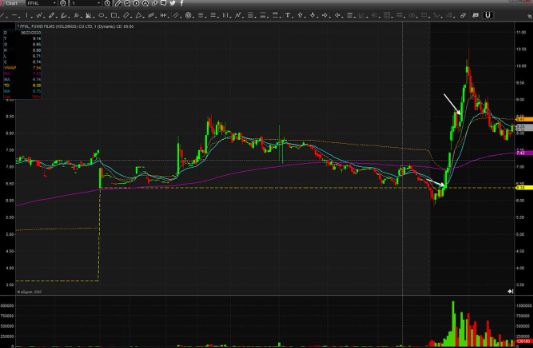
What momentum setup does this image represent? (Level)
Buying Pullbacks after Break of VWAP
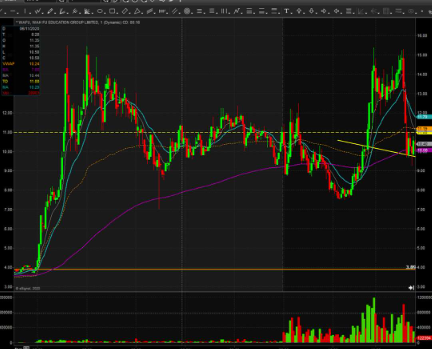
What 2 momentum setup does this image represent?
Buying the First Pullback after Break of VWAP
What momentum setup does this image represent?
Pullbacks
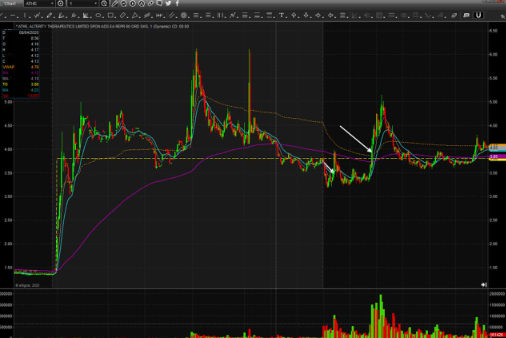
What 2 momentum setup does this image represent?
Buying Pullbacks after Break of VWAP
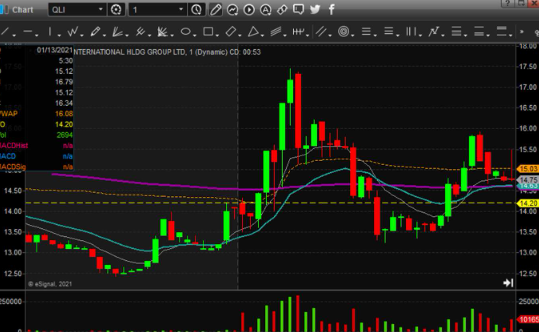
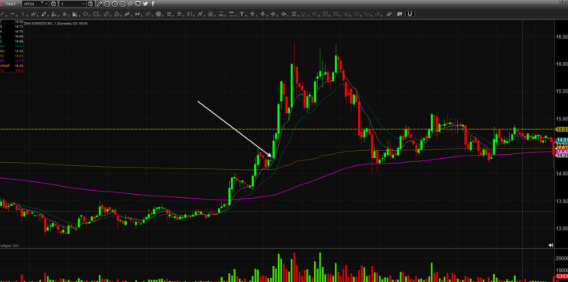
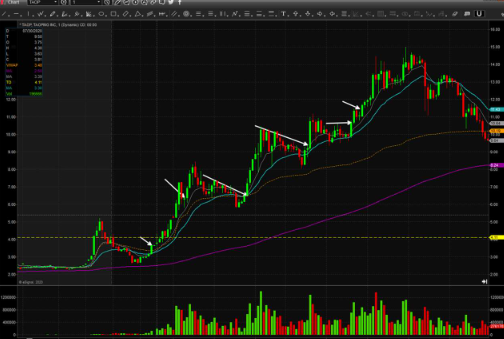
What 2 momentum setup does this image represent?
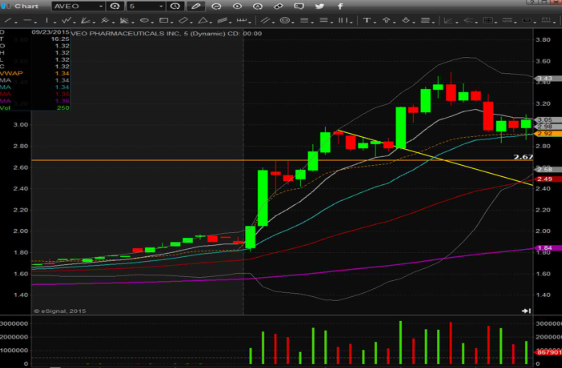
Afternoon Pullback after VWAP Breakout
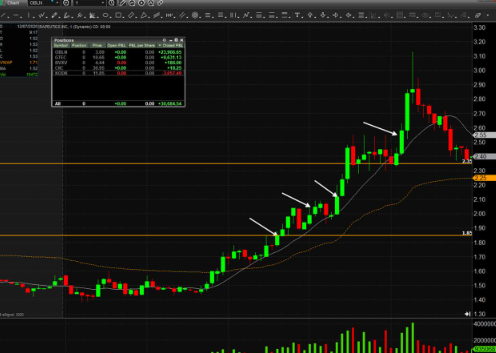
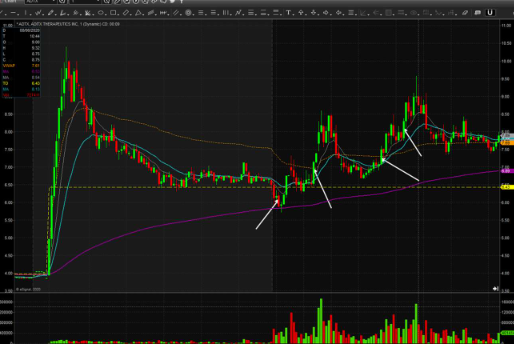
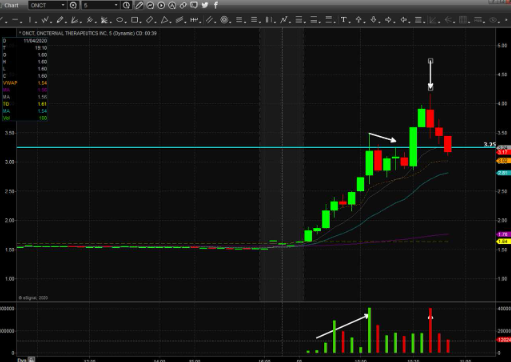
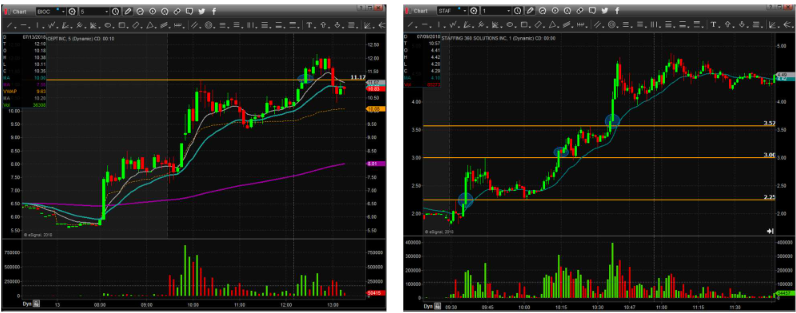
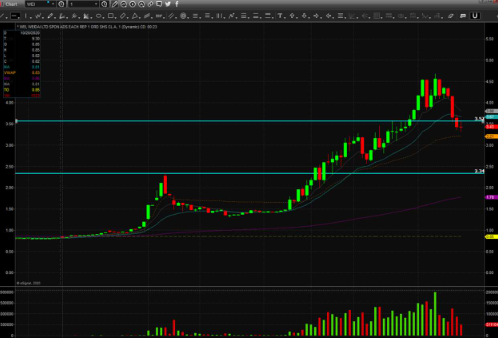
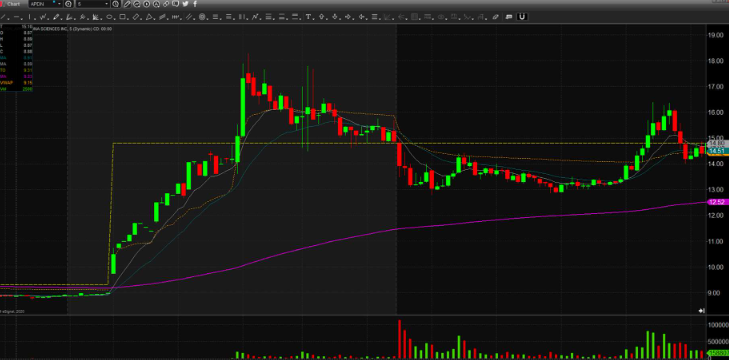
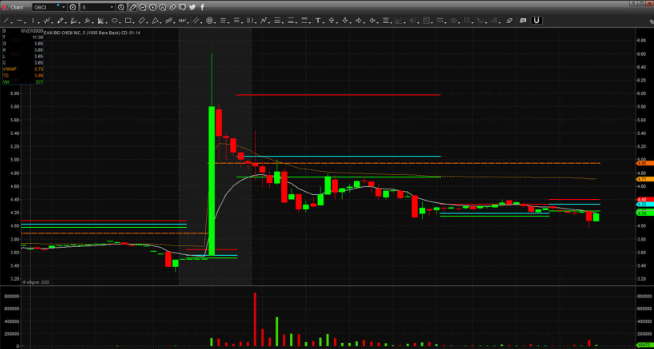
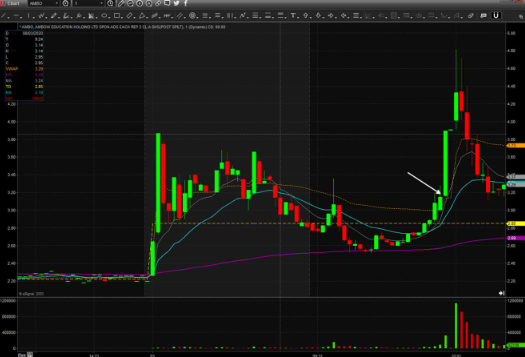
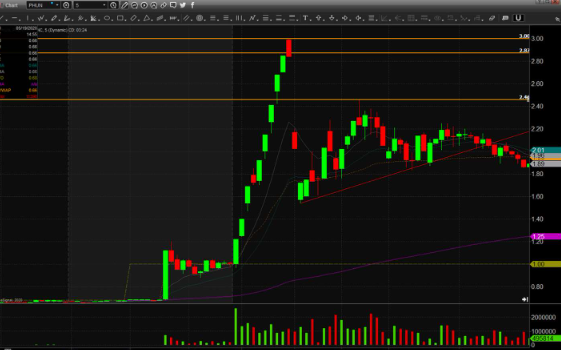
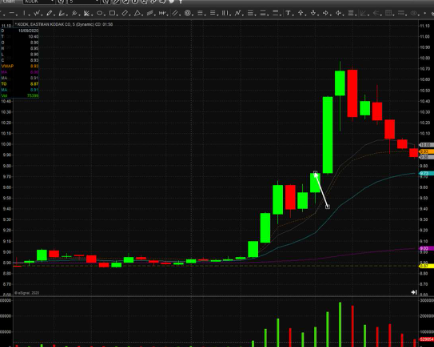
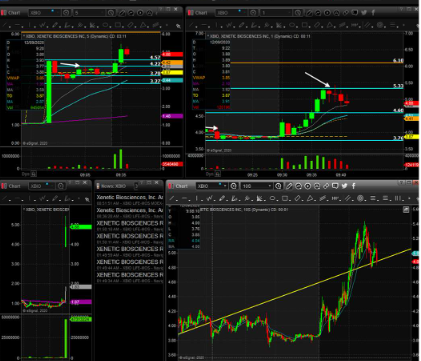
What momentum setup and intraday pattern does this image represent?
Pullbacks and Flat Top Breakout at 2.55
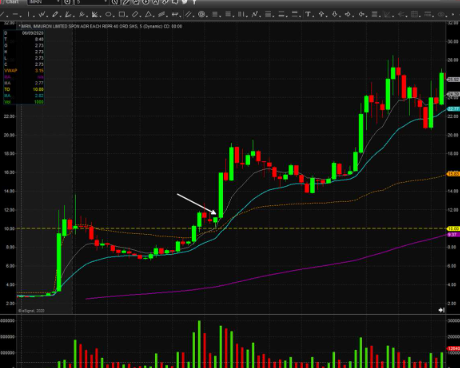
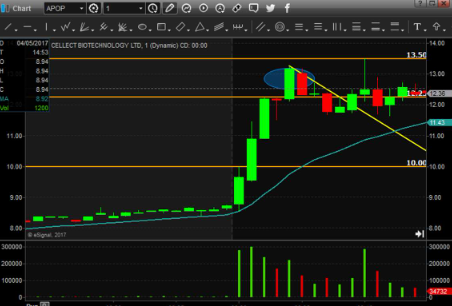
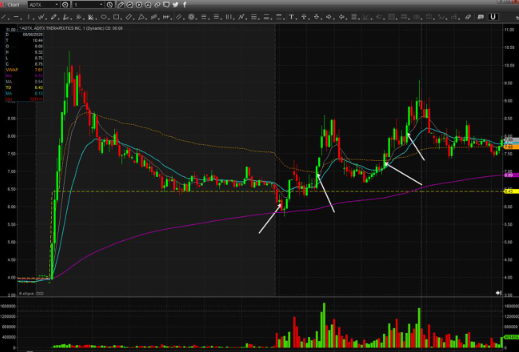
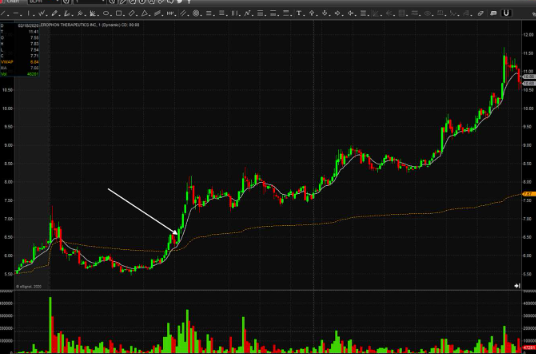
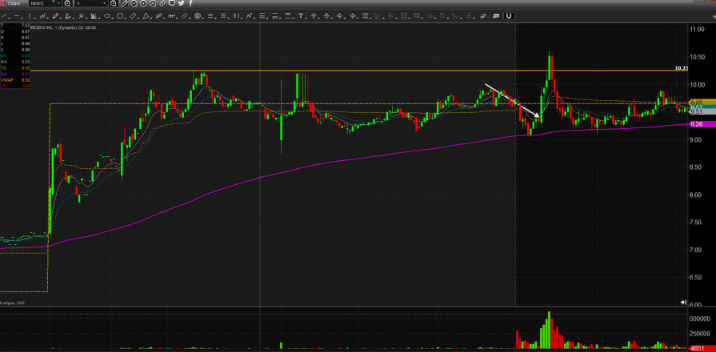
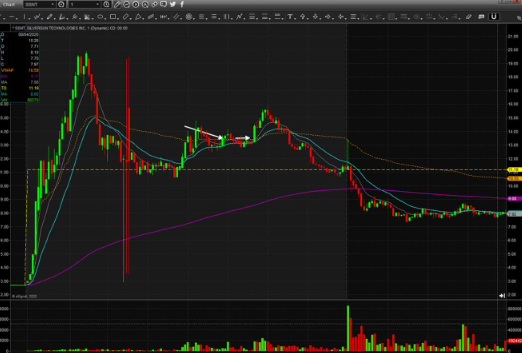
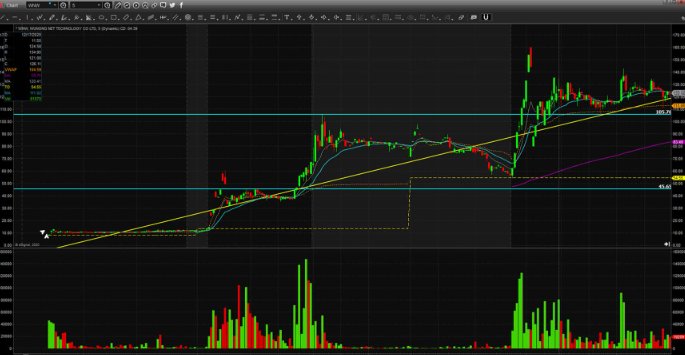
What intraday pattern and momentum setup does this image represent?
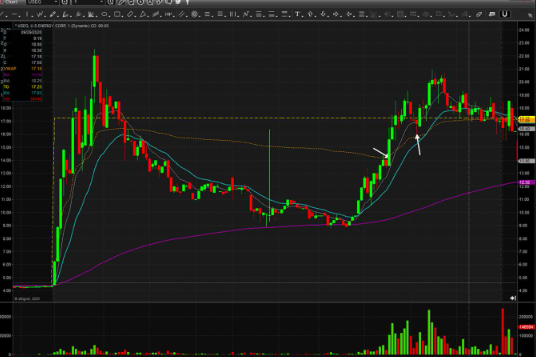
Inverted Head and Shoulders (Pullback after Breakout / Break of Pivot
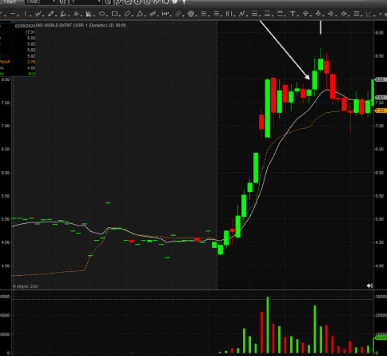
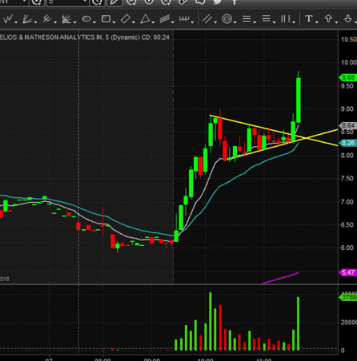
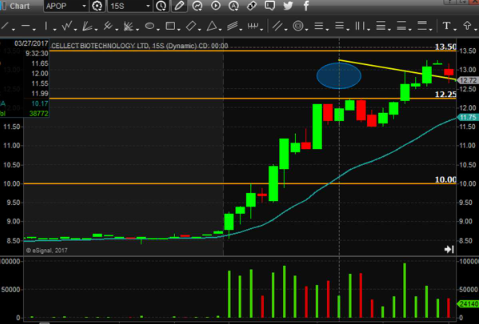
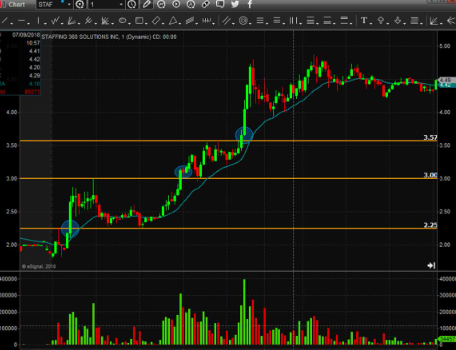
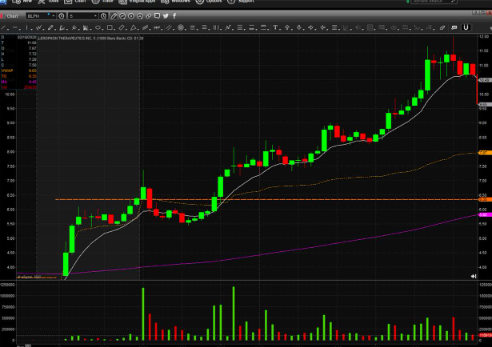
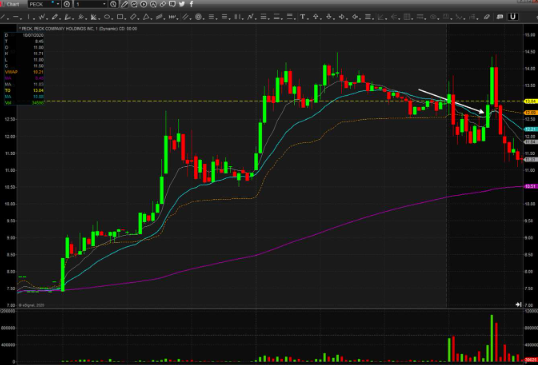
What intraday pattern and momentum setup does this image represent?
Inverted Head and Shoulders (Pullback after Breakout)
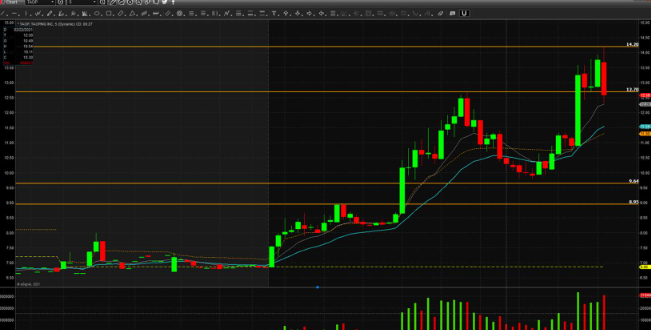
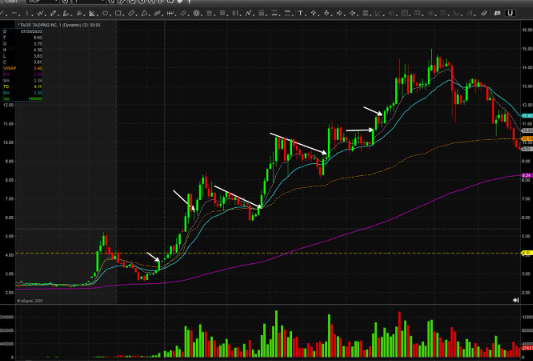
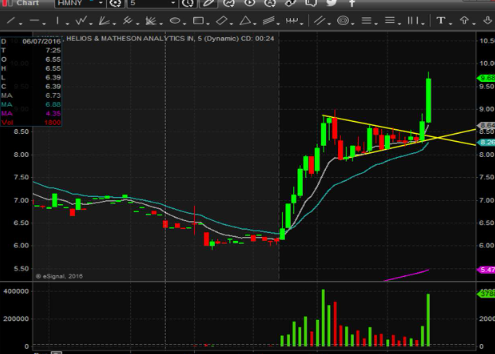
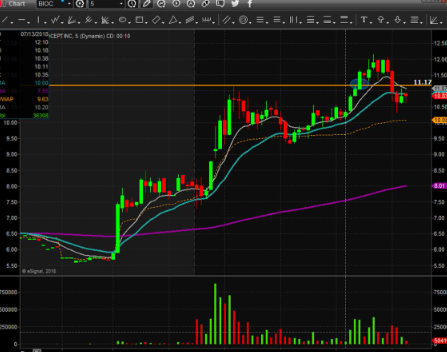
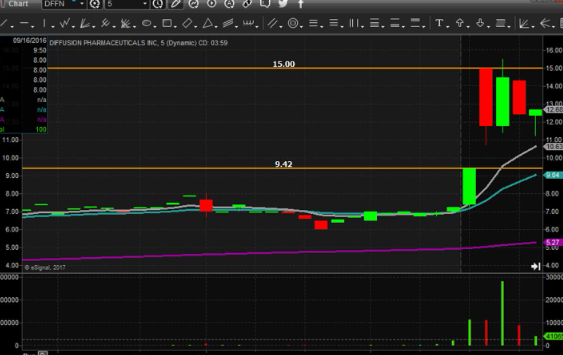
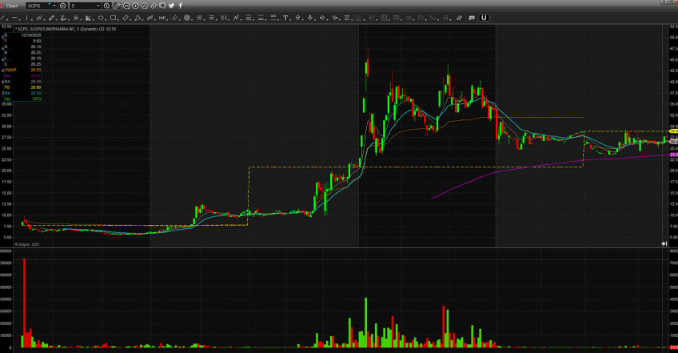
What intraday pattern and momentum setup does this image represent?
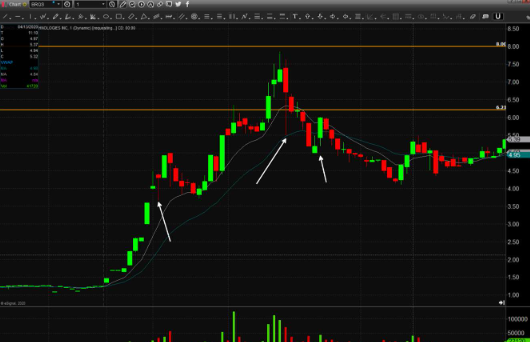
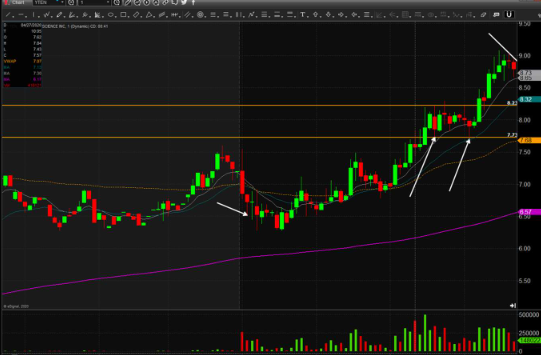
Flat Top Breakout at 8.00 & Pullback
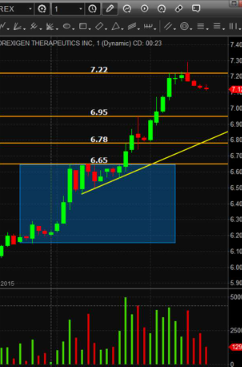
What intraday pattern and momentum setup does this image represent?
Flat Top Breakout at 6.65 & Pullback
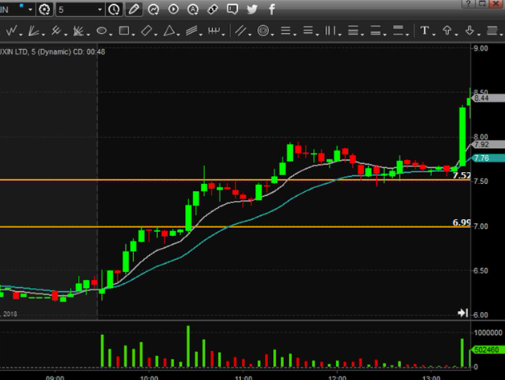
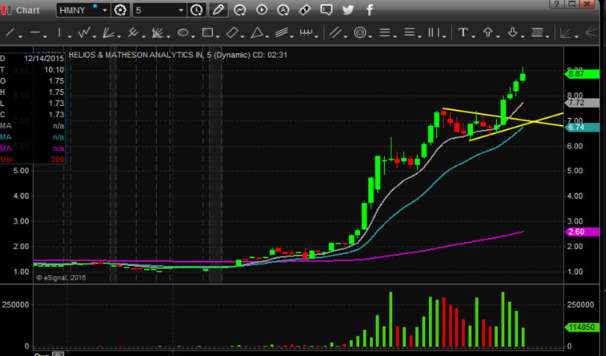
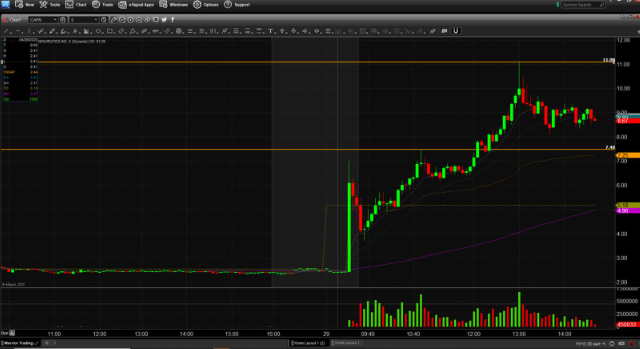
What intraday pattern and momentum setup does this image represent?
Flat Top Breakout at 7.00 & Pullback
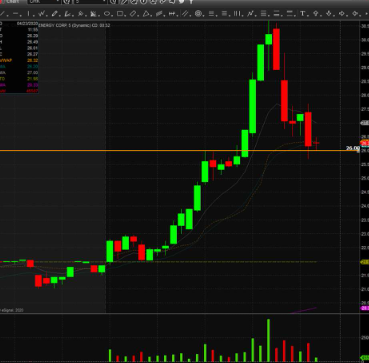
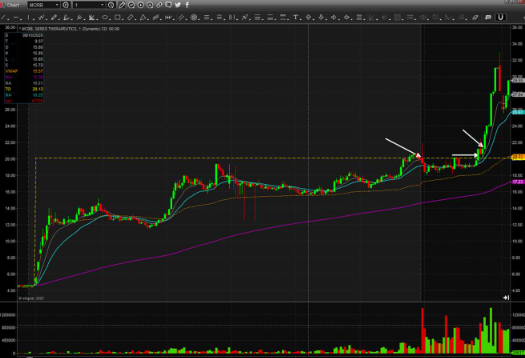
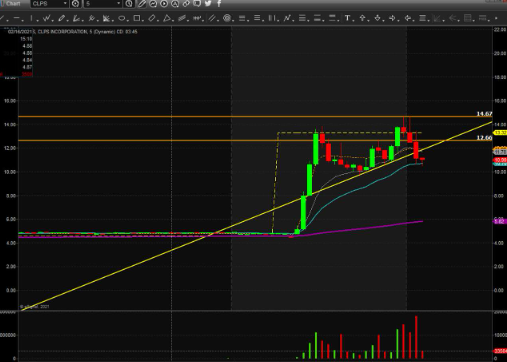
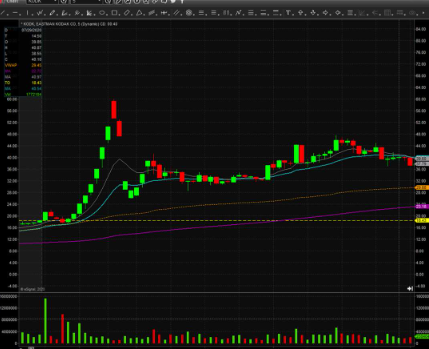
What intraday pattern does this image represent?
Flat Top Breakout at 26.00
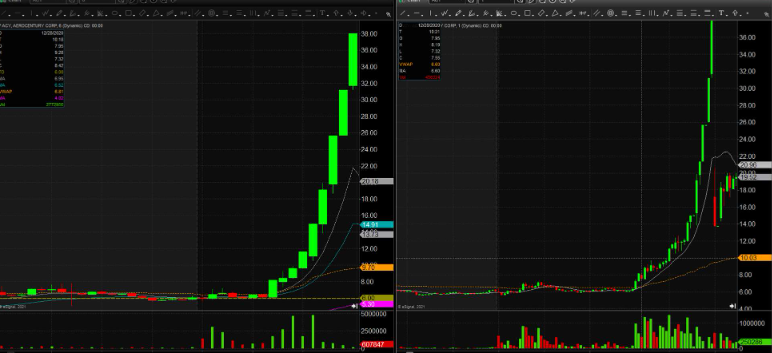
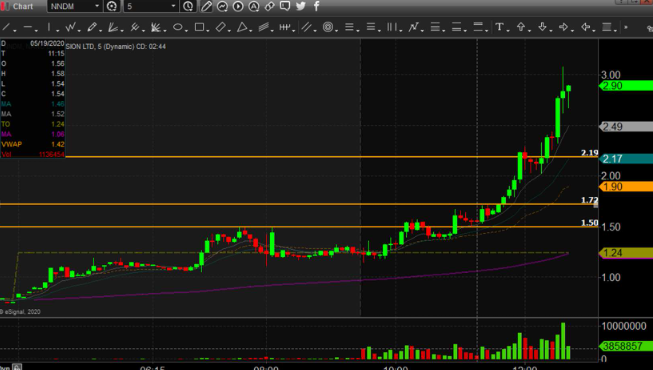
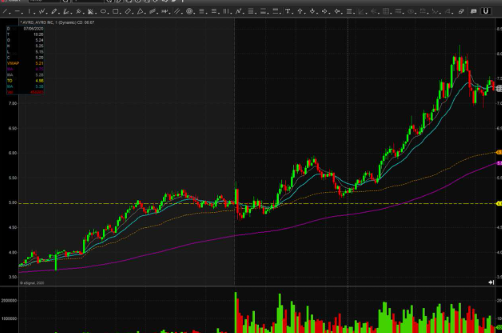
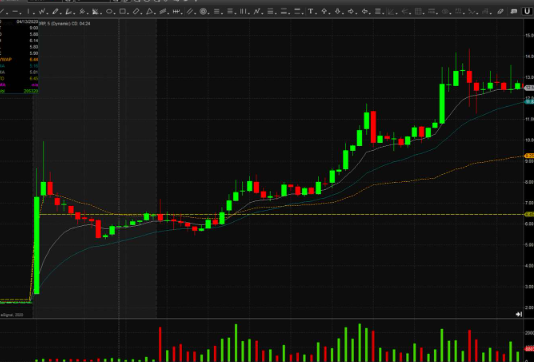
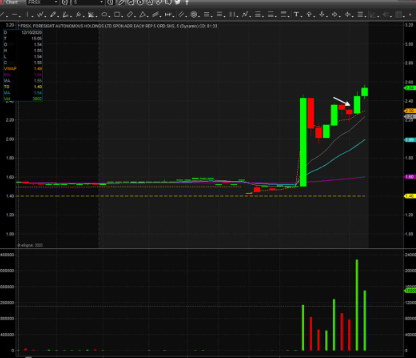
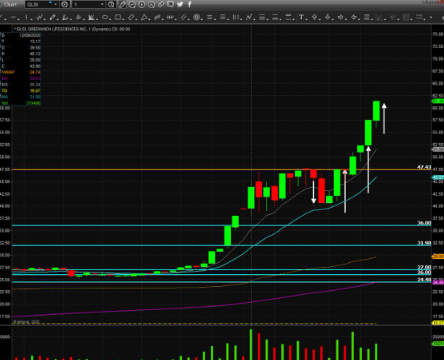
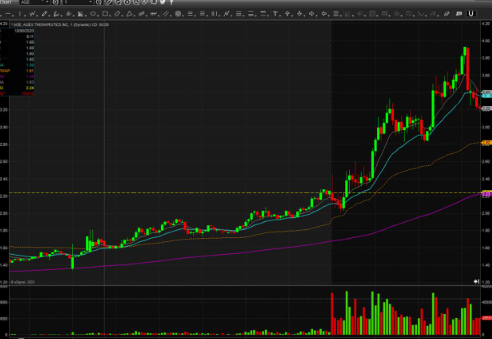
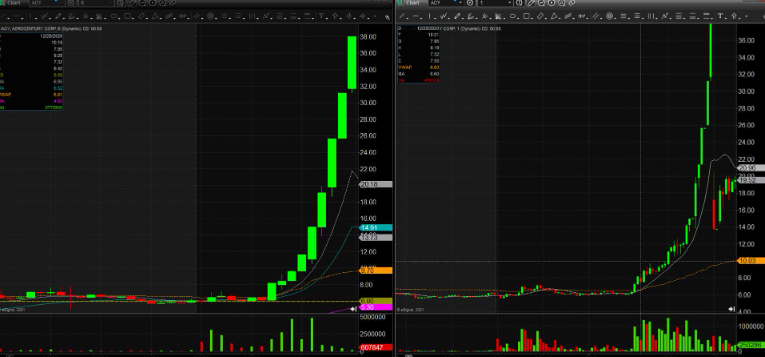
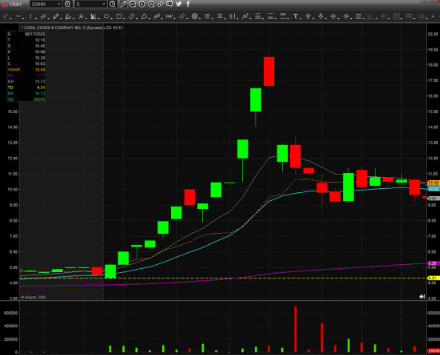
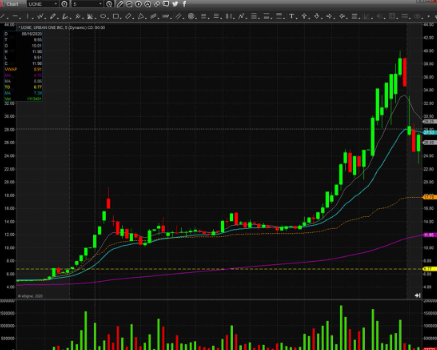
What momentum setup does this image represent?
First Pullbacks after Parabolic Squeeze Begins
What momentum setup does this image represent?
ABCD Flag Pattern
What momentum setup does this image represent?
ABCD Flag Pattern
What momentum setup does this image represent?
ABCD Flag Pattern
What momentum setup does this image represent?
ABCD Flag Pattern
What momentum setup does this image represent?
ABCD Flag Pattern
What momentum setup does this image represent?
ABCD Flag Pattern
What momentum setup does this image represent?
ABCD Flag Pattern
What momentum setup does this image represent?
ABCD Flag Pattern
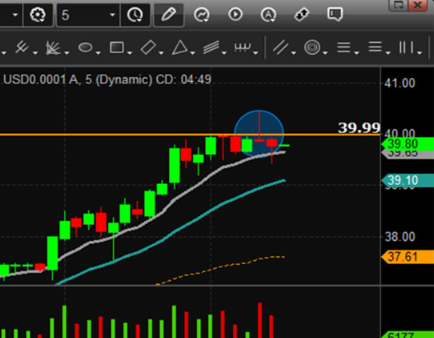
What 2 momentum setup does this image represent? (Level)
½ Dollar Break Micro 1min Pullback
What 2 momentum setup does this image represent? (Level)
Whole Dollar Break Micro 1min Pullback
What 2 momentum setup does this image represent?
Whole Dollar Break Micro 1min Pullback
What momentum setup does this image represent?
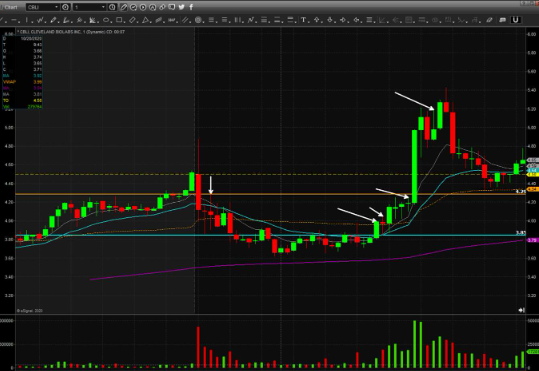
Whole Dollar, Half Dollar, Halt, 1st and 2nd Pullback
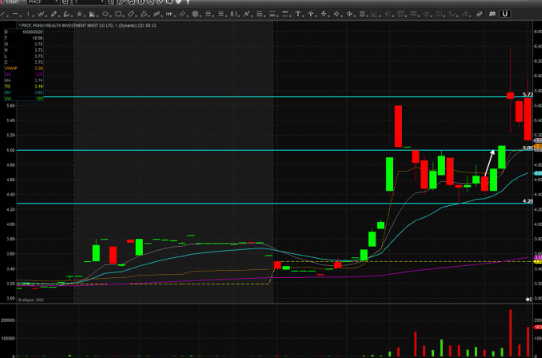
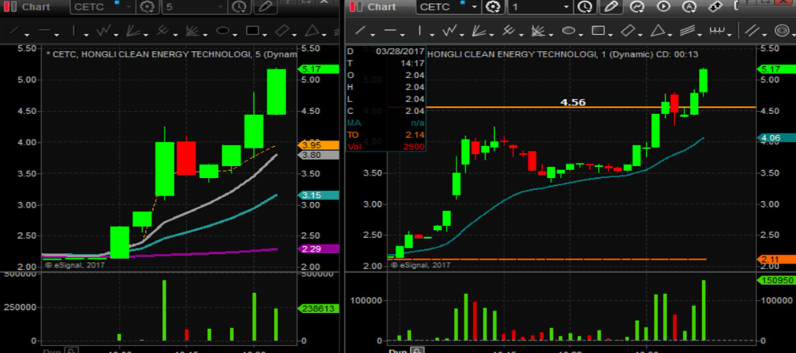
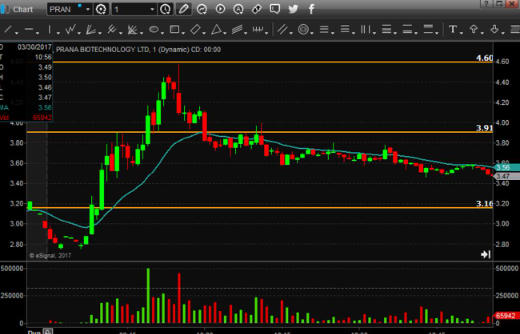
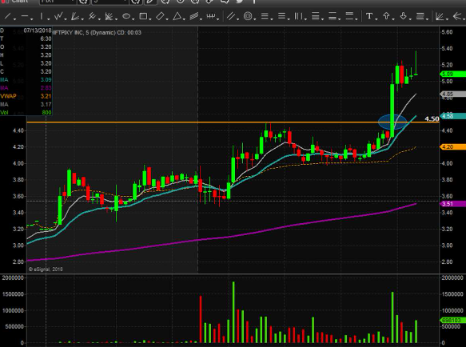
Whole Dollar Break
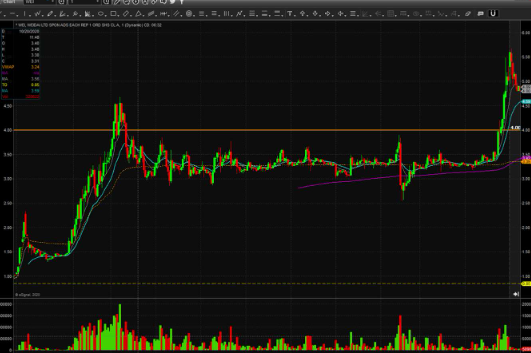
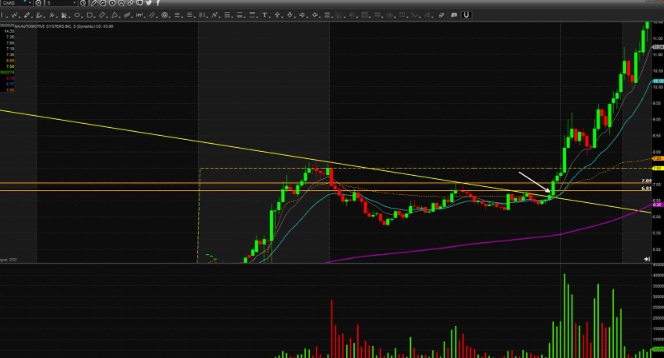
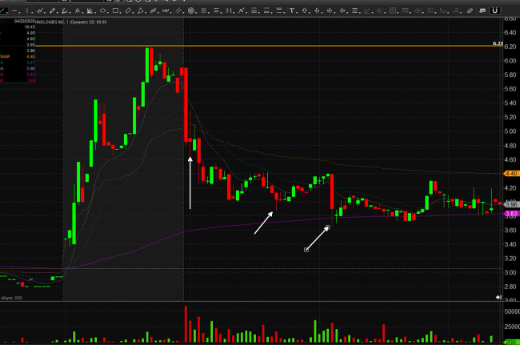
Whole Dollar Break (Resistance at 4.00 then Finally a Breakout)
Whole Dollar Break (Resistance at 4.00 then Finally a Breakout)
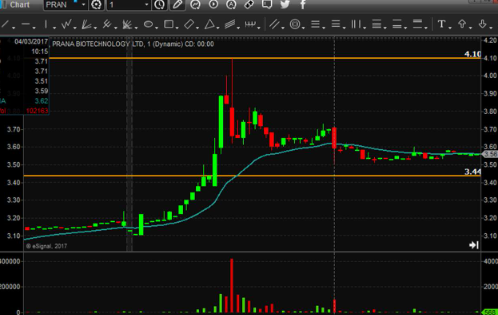
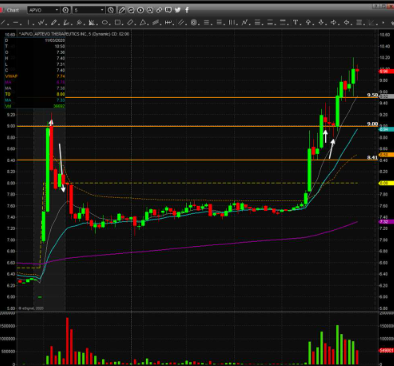
Whole Dollar Break (Resistance at 5.00 then Finally a Breakout)
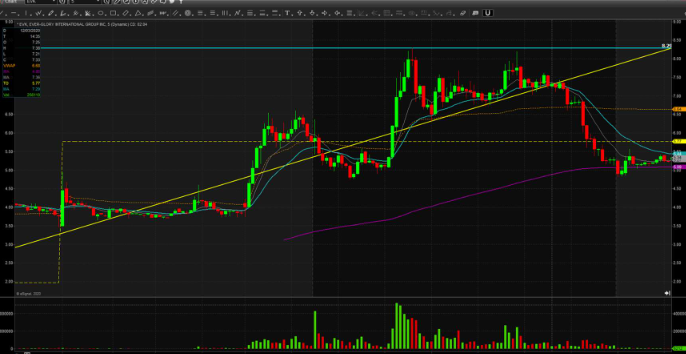
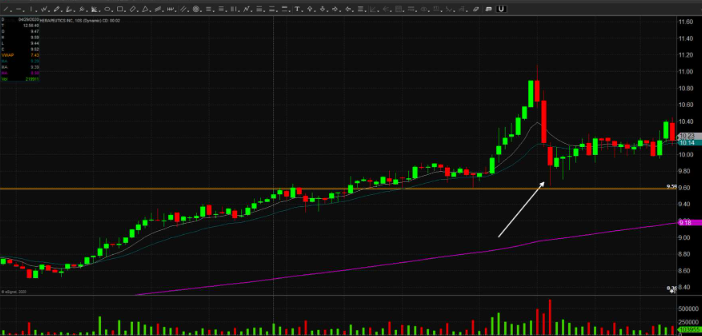
½ Dollar Break (Resistance at 9.50 then a Breakout)
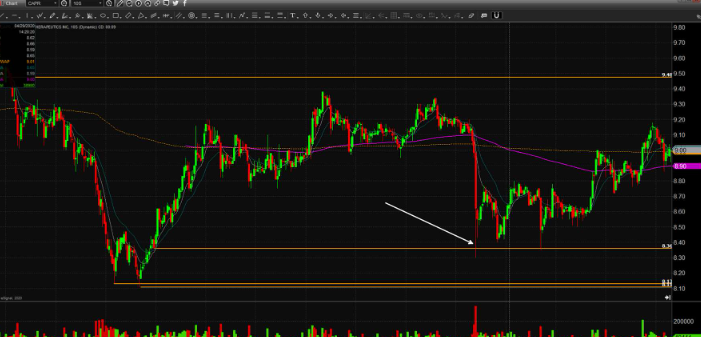
Whole Dollar False Breakout / Rejection (Topping Tail then Reversal)
Bull Traps at Whole Dollars
Bull Traps at Whole Dollars
Micro Pullback before 50% Squeeze
Micro Pullback before 20% Squeeze
Micro Pullback before 30% Squeeze (Barely Noticeable on 1min)
Micro Pullback before 30% Squeeze (Close up on 15-sec chart)
Micro Pullback after Bear Trap!
Great Micro Pullback after Fresh 5-min
Breakout
Micro Pullbacks Pre-Market
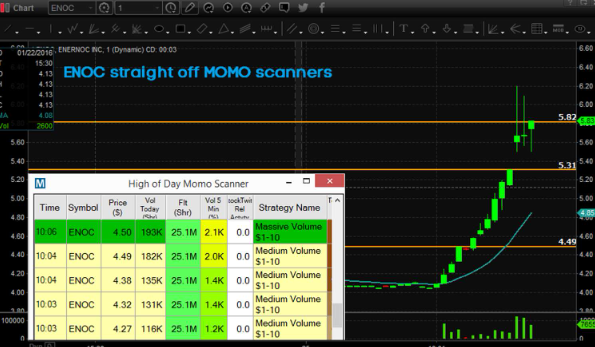
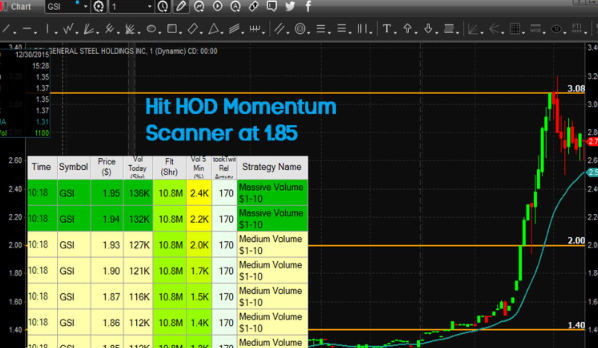
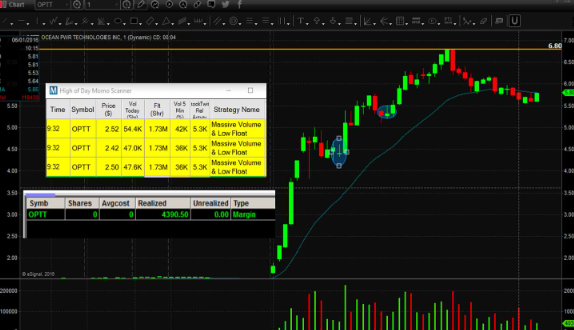
High of Day
High of Day
High of Day
High of Day
High of Day (Entry at 2.60 for Quick HOD Break)
High of Day (Entry at 2.34 and 3.57 for Quick HOD Breakouts)
Entry at ~7.50 for Quick HOD Breakouts
1min VWAP Setup
5min VWAP Setup
1min VWAP Setup
5min VWAP Setup
VWAP Breakout Setup
VWAP Breakout Setup
VWAP Breakout Setup Fail (Couldn’t Break)
Break of VWAP
Break of VWAP
Break of VWAP
Break of VWAP
Break of VWAP
Break of VWAP
Break of VWAP
Break of VWAP
Break of VWAP
VWAP Fade then Breakout
VWAP Breakout
Break of VWAP
Break of VWAP
Break of VWAP, then pullback entries
Break of VWAP
Break of VWAP
Buying into a Halt
Buying into a Halt
Buying into a Halt
Buying into a Circuit Breaker Halt
Halts
Halt then continuation
Halting Going Up and Coming Down
Halts
Halts
Dip Buy
Dip Buy (5min Chart)
Dip Buy (Dips to support)
Dip Buy, High Volume Flushes
Dip Buy, Massive Panic Drop
Dip Buy, Break of Support & Washout
Dip Buy Setup: Buying Dips to 200 EMA on 1-min
Dip Buy
Dip Buy
Dip Buy
Dip Trade off VWAP in Pre-Market
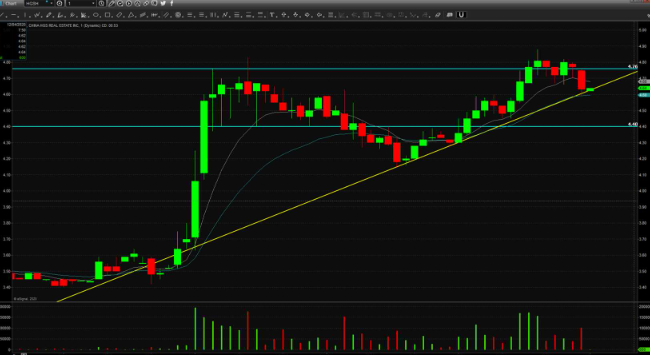
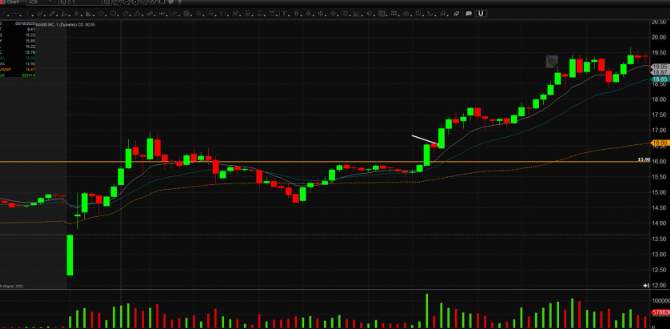
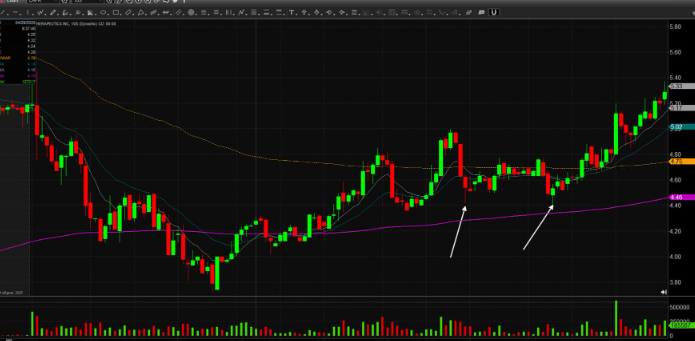
Dip Trade off Ascending Support
Dip Trade off Double Bottom
Dip Trade off Ascending Support
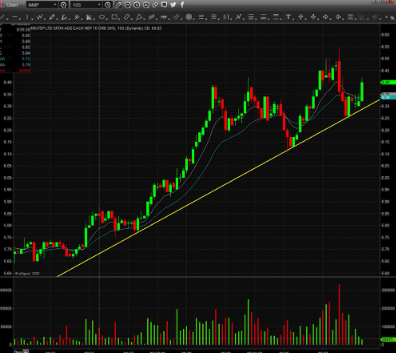
Dip Trade off Ascending Support