Exam 1 Study Guide - Statistics
 Call Kai
 Learn
Learn Practice Test
 Spaced Repetition
 Match
Match Flashcards
 Knowt Play
1/71

Earn XP
Description and Tags
Chpt 1-5
Name | Mastery | Learn | Test | Matching | Spaced | Call with Kai | Chat |
|---|
No analytics yet
Send a link to your students to track their progress
72 Terms
Population
All individuals of interest for a PARTICULAR research question
Sample
A set of individuals from the population to PARTICIPATE/REPRESENT in the research study
Describe the relationship between a sample and a population.
The population → The sample is selected from the population → The sample → The results from the sample are generalized to the population
Statistic
value that describes a SAMPLE
Parameter
value that describes a POPULATION
Descriptive Statistics
Used to SUMMERIZE, ORGANIZE, and SIMPLIFY data
How is descriptive statistics helpful?
→ they take raw scores and summarize/organize them in a form that’s manageable
→ organized in table/graph to see entire set of scores
→ computes on average
Inferential Statistics
allows us to make statements about populations based on sample data
How are inferential statistics helpful?
→ they decide which interpretation is most reasonable
Sampling Error
the naturally occurring (by chance differences) discrepancy between a sample statistic and population parameter
→ differences occur by chance
→ sample statistics vary from sample to sample
→ don’t expect them to be equal, we expect them to be different
Operational Definition
defines a CONSTRUCT by identifying a procedure for measuring behaviors that can be observed.
→ hunger can be measured and defined by the number of hours since last eating
Why are operational definitions important?
→ they move from the abstract to the concrete
→ they measure frequency, duration, and intensity.
Discrete variables
SEPERATE; indivisible categories; NO VALUES exist between categories
→ for ex: flipping a coin or number of children in a household
Continuous variable
there are an INFINITE number of values; any two observed values
→ real limits
→ for ex: weight, height, temp., reaction time
Real limit
boundaries (upper/lower) of intervals for a score, halfway between adjacent categories
Nominal Scale
label/categorize; only labels differences that exist.
→ Mathematical operations - counting
→ Ex: Race, Gender, Marital Status
→ Political Affiliation and location of brain damage (no inherent order)
Ordinal Scale
label/categorize AND ORDER
→ Mathematical operations - rank order
→ Ex: Socioeconomic class and shirt size
→ Class rank and results of horse race
Interval Scale
label/categorize, order, and equal intervals
→ Mathematical operations - add and subtract
→ Ex: IQ and degrees F
→ test of verbal ability
Ratio Scale
label/categorize, order, equal intervals, AND ABSOLUTE ZERO
→ Mathematical operation - add, subtract, multiply, and divide
→ Ex: Kelvin, length, and weight
→ Annual income, number of errors made on an exam, time to complete a task

Correlational method
used to determine if there’s a relationship between the measured variables; used for prediction
→ no manipulation of variables
→ cannot demonstrate cause and effect
Ex: relationship or no relationship; strong or weak; positive or negative
Ex2: SCATTER PLOT; shows a clear relationship between Facebook time and academic performance
as FB time increased, academic performance decreased
Experimental method (come back to this)
control and manipulation
→ Involves a comparison of the groups
→ can demonstrate cause and effect
→ consists of independent variable and dependent variable
Nonexperimental Methods (come back to)
→NO random assignment
→ compares pre-existing groups
→ pre-post test studies
EX: Personality types (introvert vs. extrovert)
Independent Variable
MANIPULATED by experimenter
→ ex: types of study materials (digital vs. printed pages)
Dependent variable
MEASURED (observed) by the experimenter to asses the effect of the treatment
→ ex: GPA or class performance
Experimental Condition
DO receive experimental treatment
→ ex: anger management (new one)
Control Condition
DO NOT receive treatment
→ ex: anger management program (old one)
Extraneous variable
variables that effect the DV other than the IV
Participant variables
gender, body mass, personality, and intelligence
→ potential difference in our group
→ ex: number of math classes taken; this group is more conscientious than this group (personality)
Environmental variables
time of day, temp., noise, smell, and weather
→ ex: non-violent games during morning vs. violent games during night
Researcher control extraneous variables
random assignment
each participant has an equal chance of being assigned to each of the treatment conditions
matching
ensure groups are equivalent in terms of participant variables and environmental variables
using control variables
study time and make it all the same so its not different between the two groups
Quasi independent variable
→ used to create the different groups of scores
Frequency Distribution
an organized tabulation of the number of scores located in each category on the scale of measurement
→ ordered from highest to lowest
What two elements are presented in a frequency distribution?
Categories (list all possible values)
Frequencies (number of operation set we see in a particular observation)
Why are frequency distributions helpful?
→ allows one to quickly see the data set and allows to see location of any individual score relative to all the other scores in the set.
proportion & percentage
proportion
p = f/n
percentage
p (100) = f/n (100)
Group frequency distribution
when you have a data set that covers a wide range of values
→ groups of scores instead of individual scores
Why would you want to use a grouped frequency distribution?
→ so the scores wouldn’t be long and cumbersome
→ to obtain a simple, organized pile of data (listing groups of scores into intervals)
What are class intervals?
there should be approximately 10 class intervals
the width of each class interval should be a simple number (2, 5, 10, 20, 50, 100)
the bottom score in each class interval should be a multiple of the width
All intervals should be the same width
What happens to the information in a set of scores when one moves from a frequency distribution to a grouped frequency distribution?
→ the cost of information is lost when categories are grouped
→ like you won’t know who specifically got what; the wider the interval, the more info we lose.

Histogram
→ height of the bar represents the frequency information
→ bars are adjacent to one another (no spaces)
→ no spaces because interval and ratio data have equal intervals

Modified/Informal Histograms
→ there is no y-axis
→ bar is replaced with blocks
→ each block represents frequency count

Polygon
→ replaced bar height with a dot above the particular category
→ height of that dot represents the frequency instead of the bar height
→ have a straight line between each adjacent category
→ no zero or seven category; you have to have one category beyond the last category and then go straight down to 0 from there.
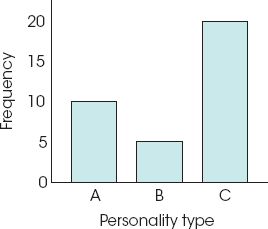
Bar graph
→ there’s a space between each of the categories
→ no equal intervals
→ nominal: the space between emphasizes the scale consists of separate distinct categories
→ ordinal: separate bars are used because you cannot assume that the categories are all the same size!
Interval and Ratio scale
→ histogram and polygon
Nominal and Ordinal Scale
→ bar graphs
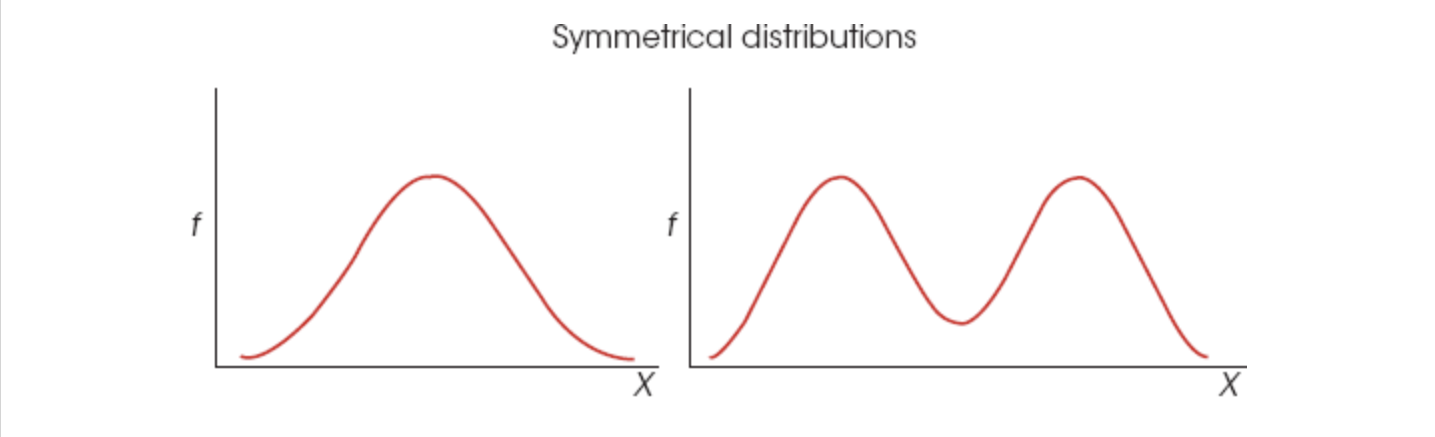
Symmetrical Distributions
→ if you put a line right down the middle, the right and left are mirror images of each other!

Positively skewed distribution
→ tail is on the RIGHT SIDE
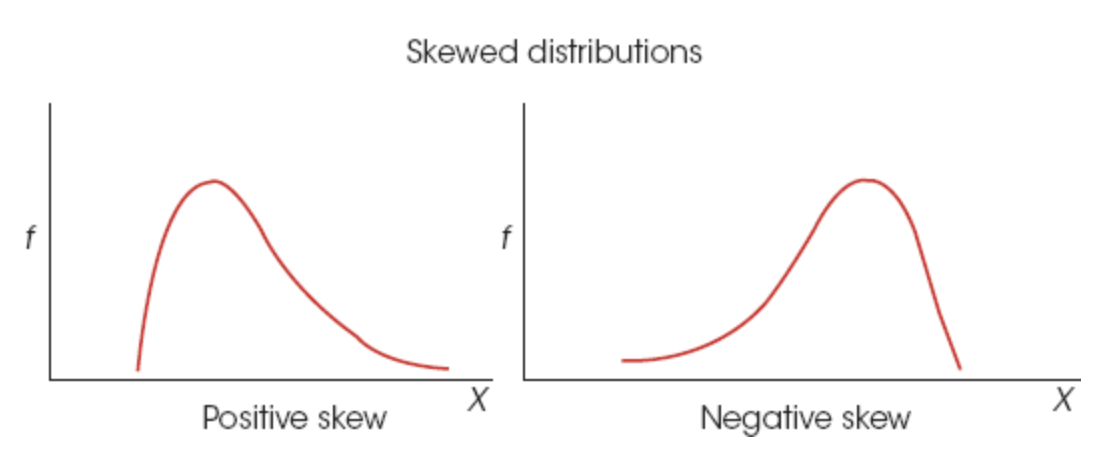
Negatively skewed distribution
→ tail is on the LEFT SIDE
Central Tendency
a single score that defines/describes the center of distribution

Why do we have more than one measure of central tendency?
→ there’s not always one value that represents the group doing well
→ no single measure would accurately define the most representative so we have 3 methods

Mean
sum of ALL scores divided by the total number of scores
→ defines central tendency in terms of DISTANCE
→ balance point of distance
In what situation do you need to calculate a weighted mean?
→ when we need to calculate the mean of a COMBINED GROUP
Characterisicis of the mean
changing the VALUE of any score will change the mean
numerator change not denominator
introducing a new score or removing a score will change the mean
exception: if the score you add/remove is equal to the mean you started with, it won’t change.
adding/subtracting a constant from each score in the distribution will change the mean
you add 2 to the score, you add 2 to the mean (same applied to #4)
multiplying/dividing each score by a constant will change the mean
Calculating the median
Order the scores of the distribution from highest to lowest
when there is an odd number of scores the median is the MIDDLE SCORE
when there is an even number of scores the median is the AVERAGE of the two middle scores
Mode
→ the score that occurs most often (the peak of frequency value) in a distribution.
to find mode create a frequency distribution
advantage: can be used with any scale of measurement; MORE THAN ONE MODE
Unimodal
Bimodal
Multimodal
major mode
minor mode
Median
the score that divides a distribution exactly in half
→ defines the of distribution in terms of number of scores
In what situations would you want to use the median instead of the mean? (come back)
when the distribution is skewed or has extreme scores
the median gives us a better description of the center
when there are undetermined values
if you’re working with people for a timed task (solving a puzzle), they might not finish in which they have a value that’s not a number, so you can still order from high to low,
the distribution is open ended
can still order from low to high and calculate a median
using ordinal data
In what situations would the mode be a preferred and/or especially useful measure of central tendency?
when working with data on a nominal scale
because mean and median can’t calculate something like political affiliation; you cannot add or rank them to find a mean or median.
when working with discrete variables
people will use this when a fractional value is impossible for that particular score of measurement; number of children in a household.
when describing the shape of a distribution
when a dataset has multiple distinct peaks or clusters (bimodal or multimodal), this highlights these separate subgroups or hidden trends that a mean or median would wash out.

Symmetrical Distributions
→ when you have a symmetric distribution, the median and mean are going to be IDENTICAL to one another.

What skewed distribution is this?
→ negatively skewed
→ mean closest to the tail

What skewed distribution is this?
→ positively skewed distribution
→ mean closest to the tail
Variability
a quantitative measure of the differences between scores in a distribution; a measure of the degree to which scores in a distribution are spread out or clustered together.
→ defined in terms of distance

What two purposes (the two discussed in class) does a measure of variability serve?
describes the SPREAD of distribution
if small numbers are close together and large numbers are spread out
Tells us how well an individual or group of scores represents the distribution
what are the odds that we can use that info to draw a conclusion about the population at large?
Range
the difference between the upper real limit of the LARGEST x value and the lower real limit of the SMALLEST x value
→ a measure of distance; the distance covered by the scores in a distribution
→ URL Xmax - LRL Xmin (15.5 - 3.5)
What is the problem with using range as a measure of variability?
→ the calculation only relies on the two extreme scores and it does not consider ALL of the scores in the distribution
when do you use population variance?
→ when your data set includes the entire group; every student in a small school
→ divides the SS by N and measures the exact spread of values for the whole group.
when do you use sample variance?
→ study a smaller group to estimate the traits of a LARGER population
→ divides by n - 1 because they tend to be LESS VARIABLE than their populations and this leads to a BIASED estimate of population variability.

Why is population variance computed differently than sample variance? How does the computational difference between population variance and sample variance deal with this issue?
→ when dividing n - 1, it’s just a correction for a problem that we have when we work with samples versus populations, as it increases the value which gives us a larger estimate
→ so n - 1 is a math procedure that we use to fix that problem in which samples tend to be less variable in the populations they represent and n - 1 makes us make a better guess.
Biased statistic
the average value for a sample statistic consistently underestimates or overestimates the population parameter
→ sample variance that uses n instead n - 1 as the denominator is a ___ statistic
→ the average value of the sample variance will consistently underestimate the population variance.
Unbiased statistic
the average value of the sample statistic is equal to the population parameter.

Standard Deviation
the typical distance between each score and the mean
Be able to describe the properties of standard deviation
adding a constant to each score in the distribution will NOT change the SD
it doesn’t change the spread of scores it just moves it left to right
multiplying each score in the distribution WILL change the SD
In the way that if you multiply every x by 2, you multiply the SD by 2