Human fieldwork - Boscombe
1/28
There's no tags or description
Looks like no tags are added yet.
Name | Mastery | Learn | Test | Matching | Spaced |
|---|
No study sessions yet.
29 Terms
What's the aim?
To investigate deprivation in Boscombe
What's the enquiry focus?
Why has Boscombe undergone deprivation?
What is the key question?
How and why are there variations in deprivation for different areas within Bournemouth?
Describe the location of Boscombe
- Its a suburb of Bournemouth.
- Its located in Dorset on the south-west coast of England.
Why was this study location chosen?
- Its accessible.
- Its one of the most deprived areas of Britain.
- It was a relatively small area which meant we had enough time to carry out our techniques.
- Regeneration around pier to improve EQ of Boscombe
- Every street back from seafront, house prices drop 8000GBP
- Location chosen because of mix of housing - far back from seafront = HMOs (Housing of Multiple Occupancy).
- This results in a transient community. Easily accessible. Stop 3 & 4 looked at evidence of urban decay
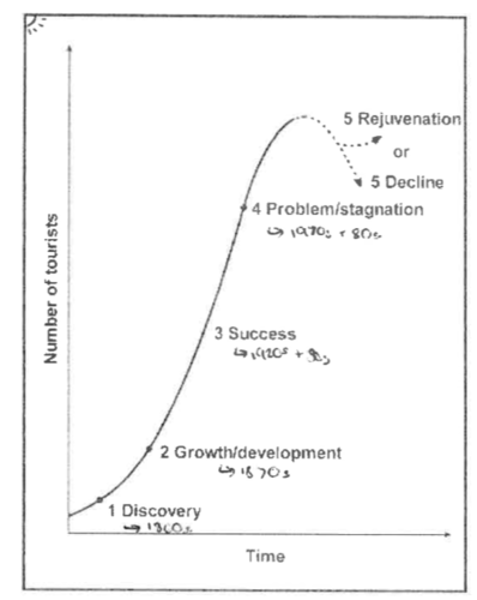
Background of Boscombe- Using the Butler Model of Tourist Resort Lifecycle (the success of a tourist destination)
1) Discovery --> 1870 industrial revolution rural to urban migration Low living standards but rising. Simple rural life to fast paced urban life. Thus mental health was being talked about more. Doctors would prescribe country water for mental health issues caused by rapid urbanisation. Boscombe developed into a Spa town, target audience was healthy industrialists.
2) Growth/development --> grew rapidly Grew rapidly due to train station links. Bed and Break feast's developed. Detached big houses with ornate balconies.
3) Success Growing middle class. More disposable income
4) Problem/stagnation --> de-industrialisation People went on holiday abroad instead Industrial factories closed quick ----> people losing jobs
5) Decline Mental health decline + drug trade + alcohol abuse Large number of vulnerable people 68 drug/alcohol rehabilitation centres in the 2000s here Churchill gardens ---> well known place to buy/sell on drugs Bad living conditions in HMO (house of multiple occupancy) Population too great for infrastructure to support it Rubbish problems ---> fly-tipping
6) Rejuvenation Council attempted to advertise Boscombe as a place to move to
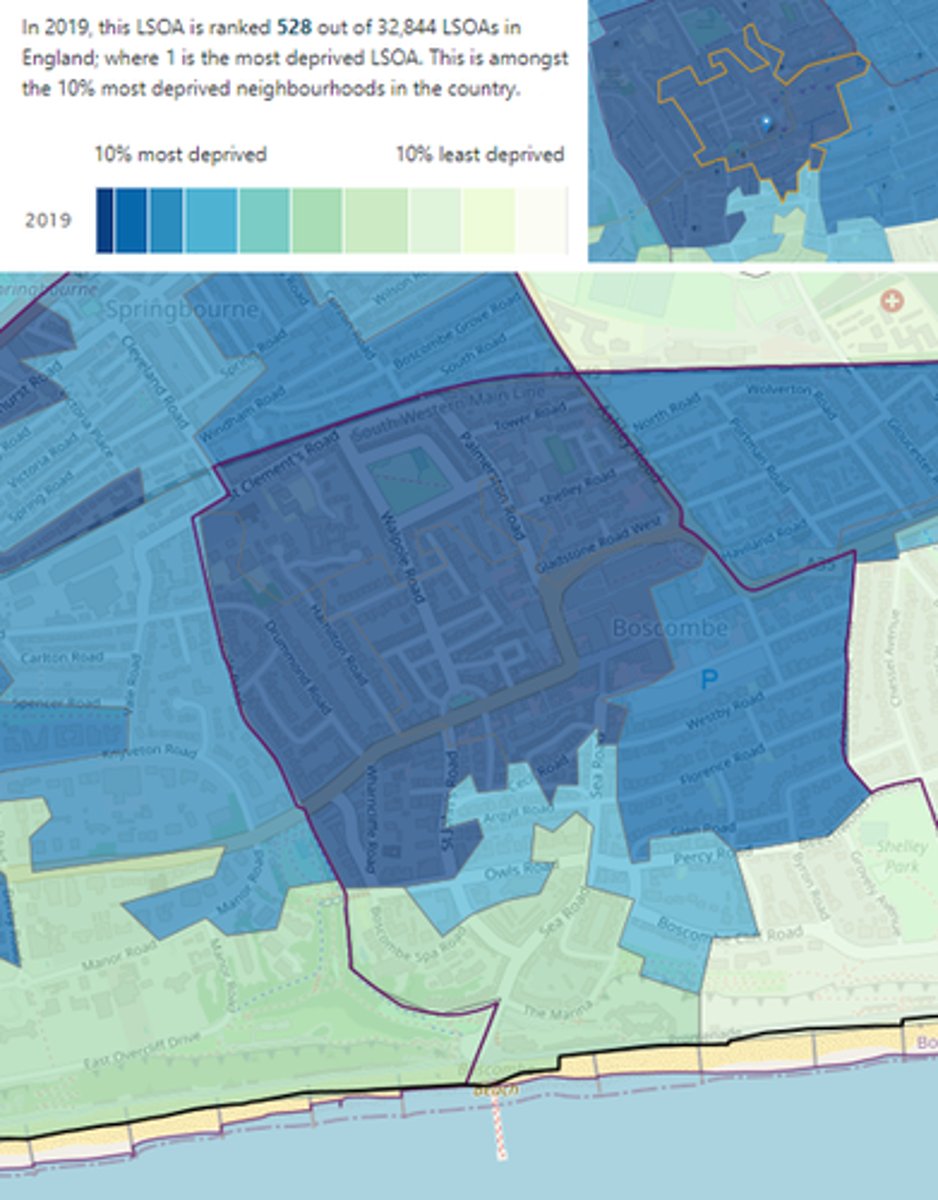
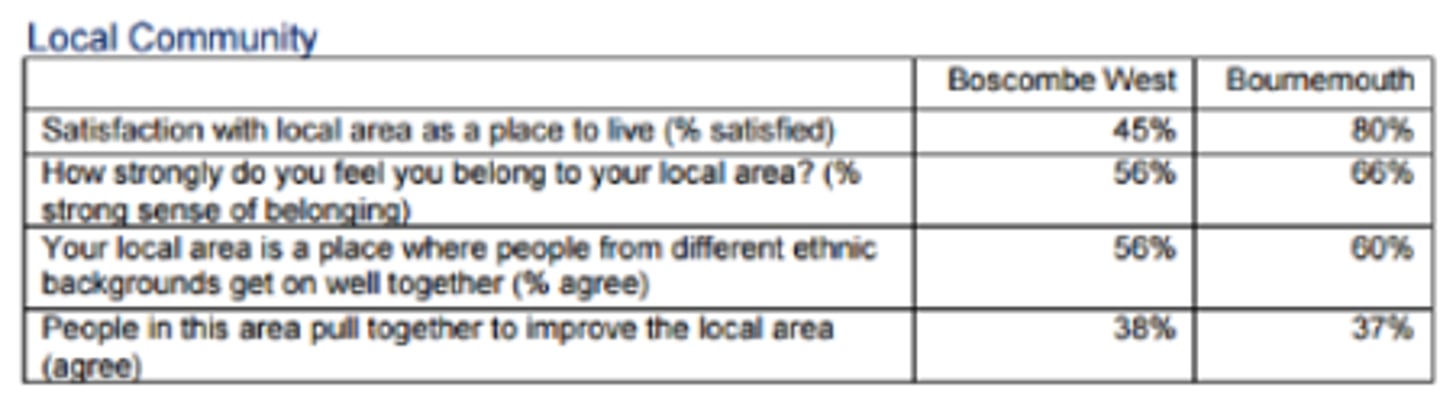
Describe deprivation in Boscombe
- In 2010 the area was ranked 113th out of 32,842 (1 being the worse) for deprivation, making it the most deprived area in the south west of England.
- Approximately 1 in 3 people of working age are claiming benefits.
- Nearly 50% of all households in the area are renting from private landlords or a letting agency.
- 1 in 2 people do not own a car or another vehicle.
- Approximately 1 in 3 users of drug/alcohol services in Bournemouth live in Boscombe West, Boscombe East and Springbourne.
- 79% of Boscombe residents thought that drunk/rowdy behaviour was problem for the area.
- 83% of Boscombe residents thought that drug use and dealing was a problem for the area.
- Men live for an average of 10 years less, and women 6 years less on average in the ward compared with the least deprived parts of the borough.
- More than 50% of the people in Boscombe want to move in the next 5 years.
Map of the stops
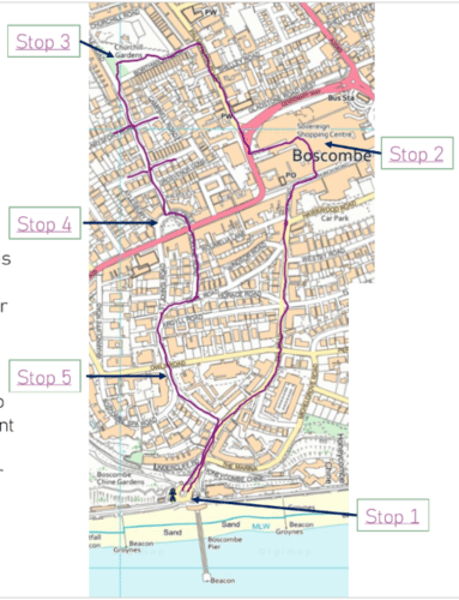
Describe Stop 1
- Beachfront
- Leisure: Mini golf, restored pier, leisure sport, beach huts, sea road art trail, climbing boulders, slackline posts, table-tennis and volleyball.
- Restoration: restored Boscombe Chine gardens, new flats and restored Over strand Building.
- Artificial surf reef
- Boscombe pier
- Artificial surf reef, attempt at regeneration, to encourage surfers----> it failed completely
- Beachfront houses are the most expensive, every row back the house price declines by £8000 ---> results in a transient community
- Location chosen because of house variety
Describe Stop 2
- Sovereign shopping centre
- Large variety of shops, majority of which are independently owned though many are chain stores.
- Newer, more shops, many seating areas with small businesses being supported.
- Abundance of shop closures (mainly independently owned)
- From my research is a border town.
- High street --> more of a mixture of independent and chain
Describe Stop 3
- Many HMOs present
- Churchill gardens
- Many drug deals occur here ---> indicative of deprivation
- Huge drug and drink problems
- Were looking for evidence of urban decay via our bipolar environmental assessment.
Describe Stop 4
- Walpole road
- Looking for evidence of urban decay
Describe Stop 5
- Owls road
- Boundary between rich area and poor area
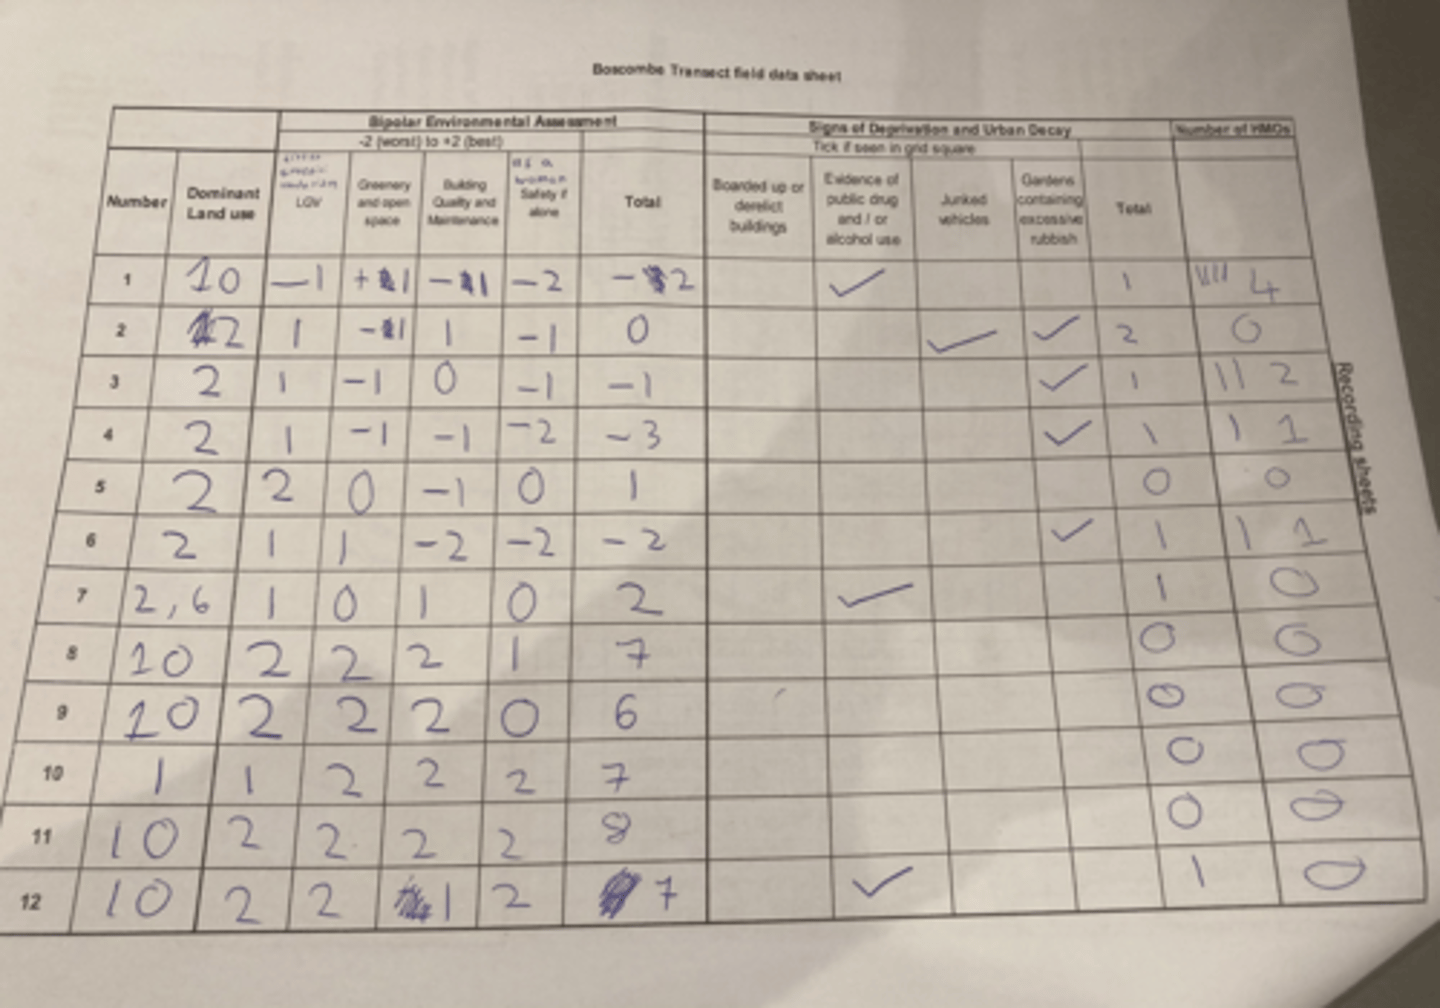
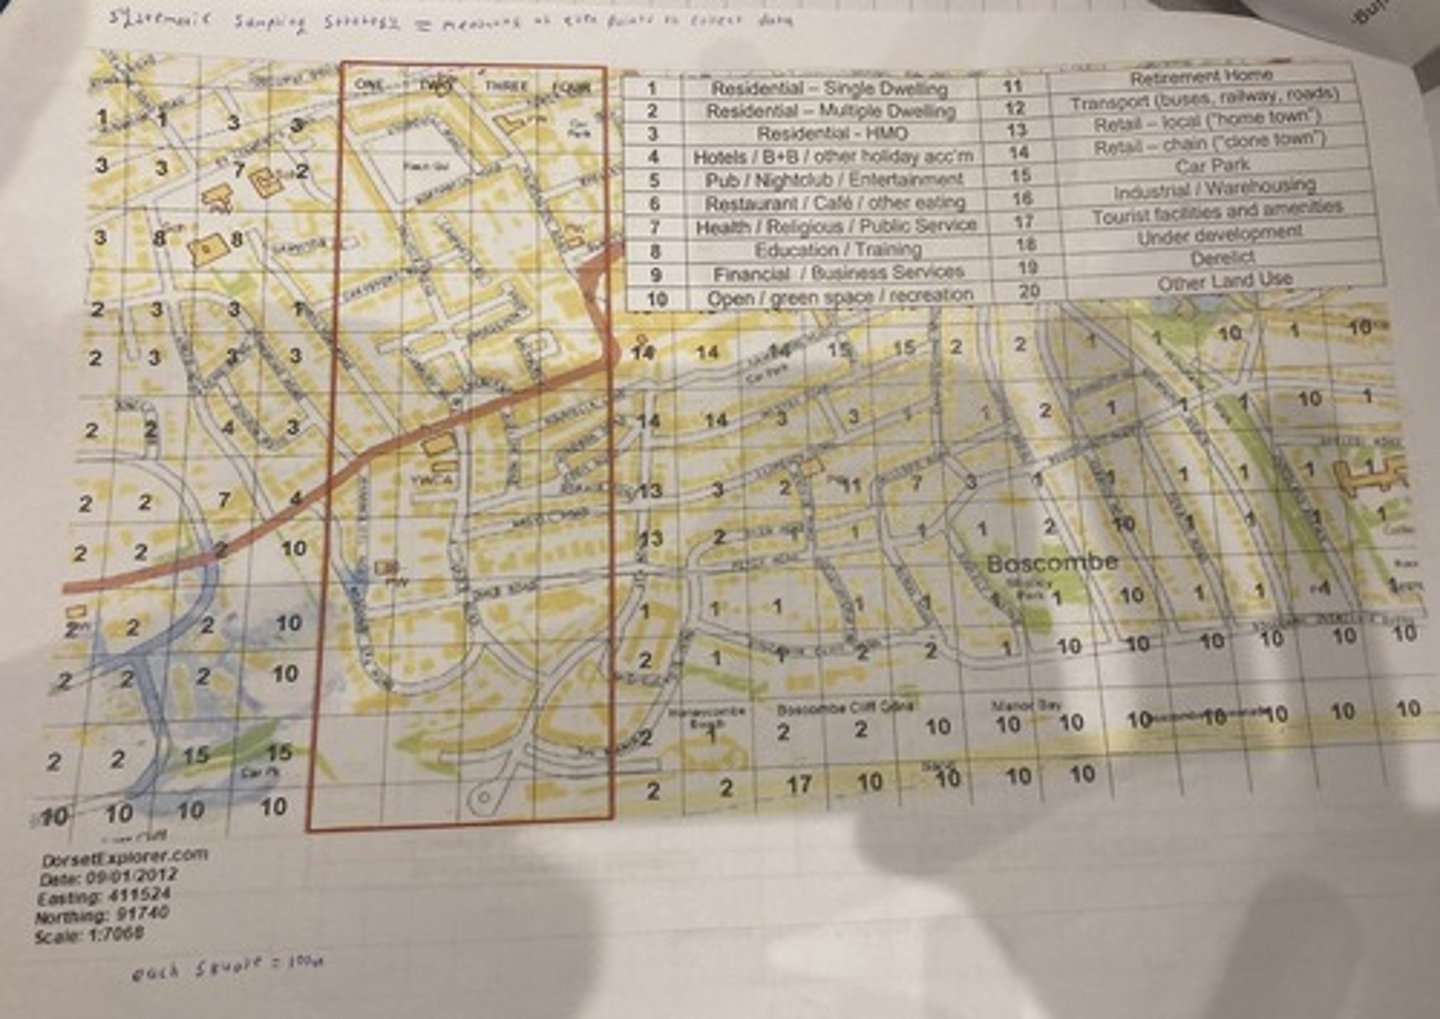
Method - Bipolar Environmental Assessment
- Use a systematic sampling system to split the land area into different transects, assign those transects numbers.
- Then using those numbers, go through each area systematically.
- Walk 100 meters referring to the transect.
- Observe the area for different factors on a scale of -2 (the most/worst) to + 2 (the best/least) and then add up the total in each area of land.
- Observe other factors and tick them off if present
- Repeat for each 100m interval
- It relates to enquiry questions, as it measures the bipolarity of an area, thus assessing its deprivation. It allows us to compare it to areas which are less deprived, to see the different e.g. Boscombe sea front.
- The sampling technique used was systematic sampling (measuring at even point to collect data) along a transect at 100m intervals.
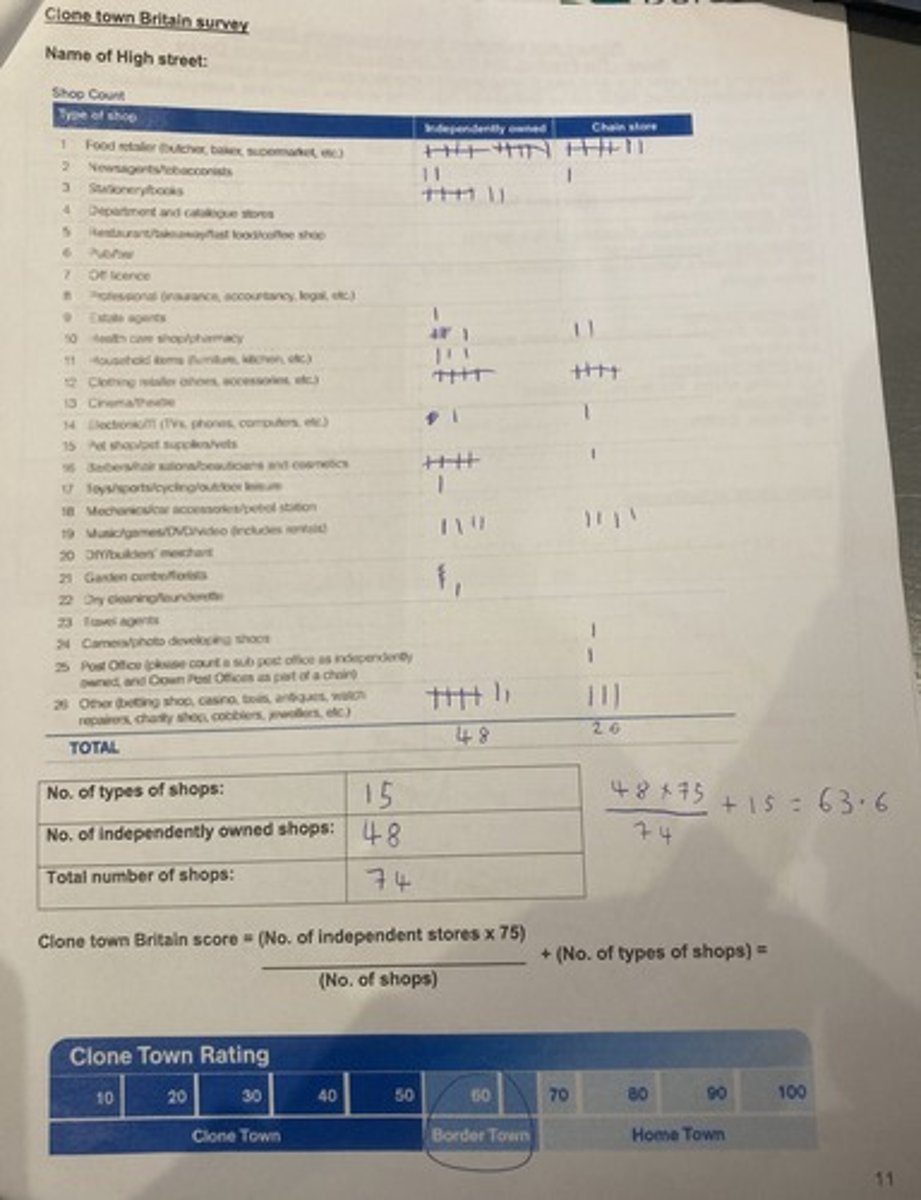
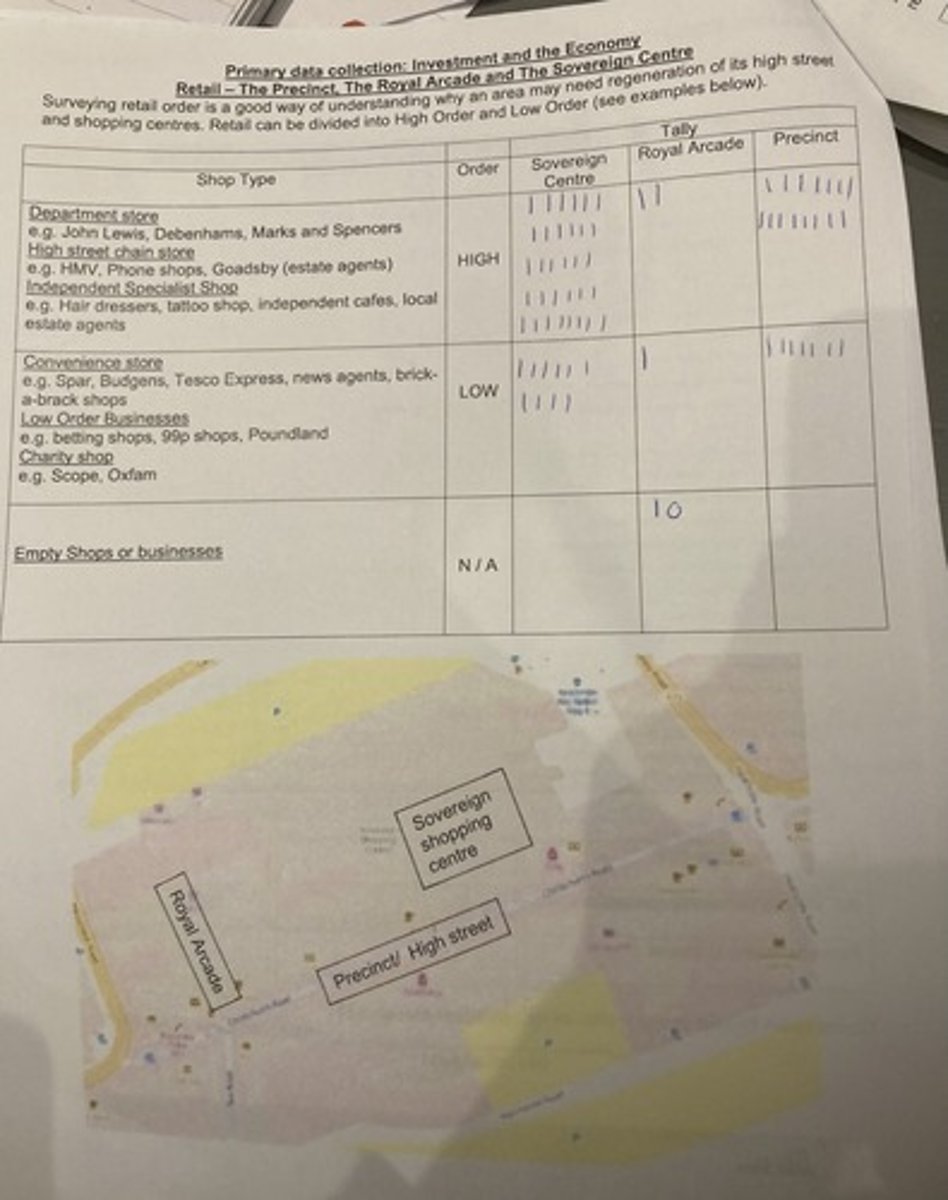
Method - Clone Town Britain Survey
- We marked a starting point at the 'heart of the high-street' this was determined to be 'The Arcade'.
- We walked along the 'Arcade' and surveyed the first 50 shops that we passed.
- As we walked along the high street, we tallied the type of shop and whether it was independently owned or a chain store.
- After we recorded our data, we completed our calculation (Number of independent stores x75/number of shops + number of type of shops).
- In 'Arcade' we determined that it was a border town with a score of 63.6.
- It relates to the question because it demonstrates the distribution of wealth in the high street, i.e. Due to this survey I noticed that many independent stores were closed town and chain stores were taking over, indicative of deprivation.
- The sampling technique was recording quantitative data via a visual survey.
Clone Town Britain Survey Data
Bipolar Environmental Assessment Data
Primary data collection
Method for Bipolar Environmental Assessment
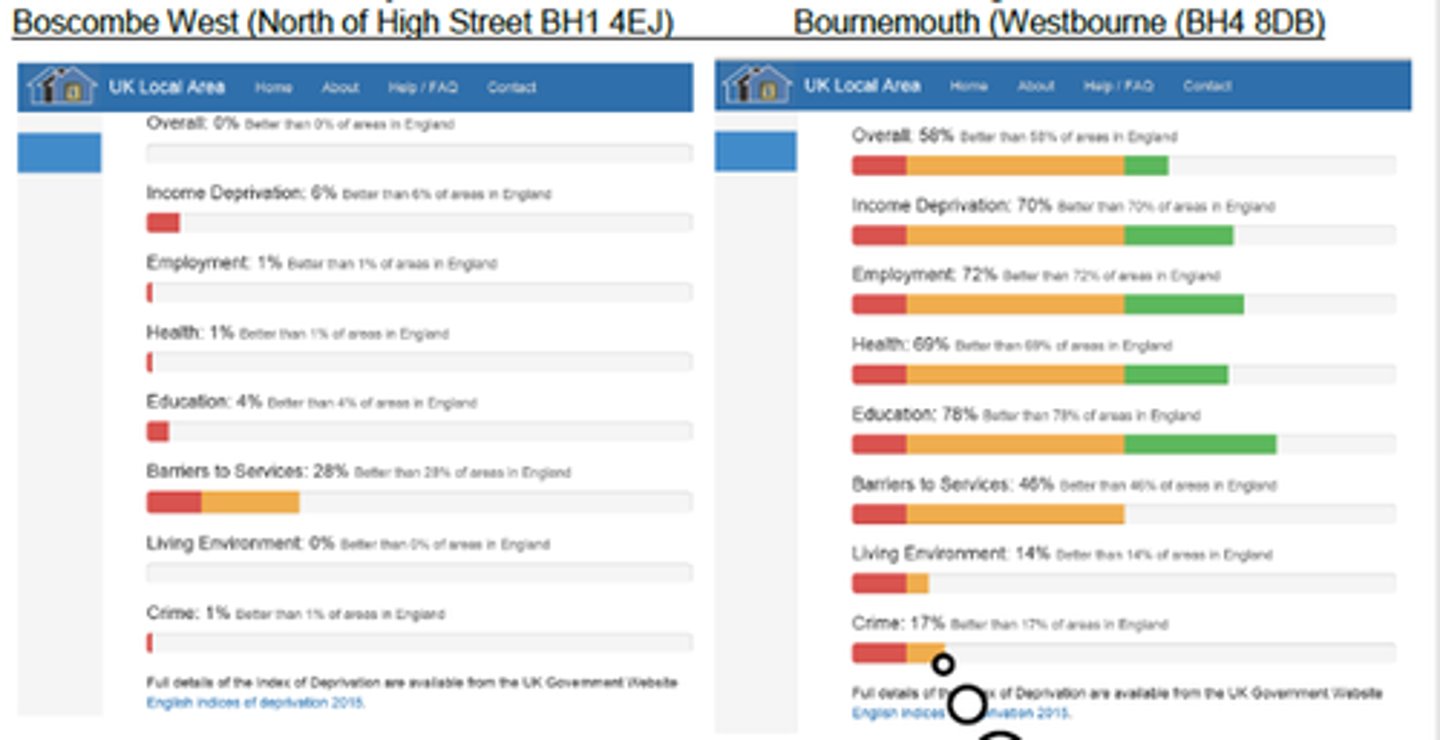
Secondary Data
Secondary Data
Secondary Data
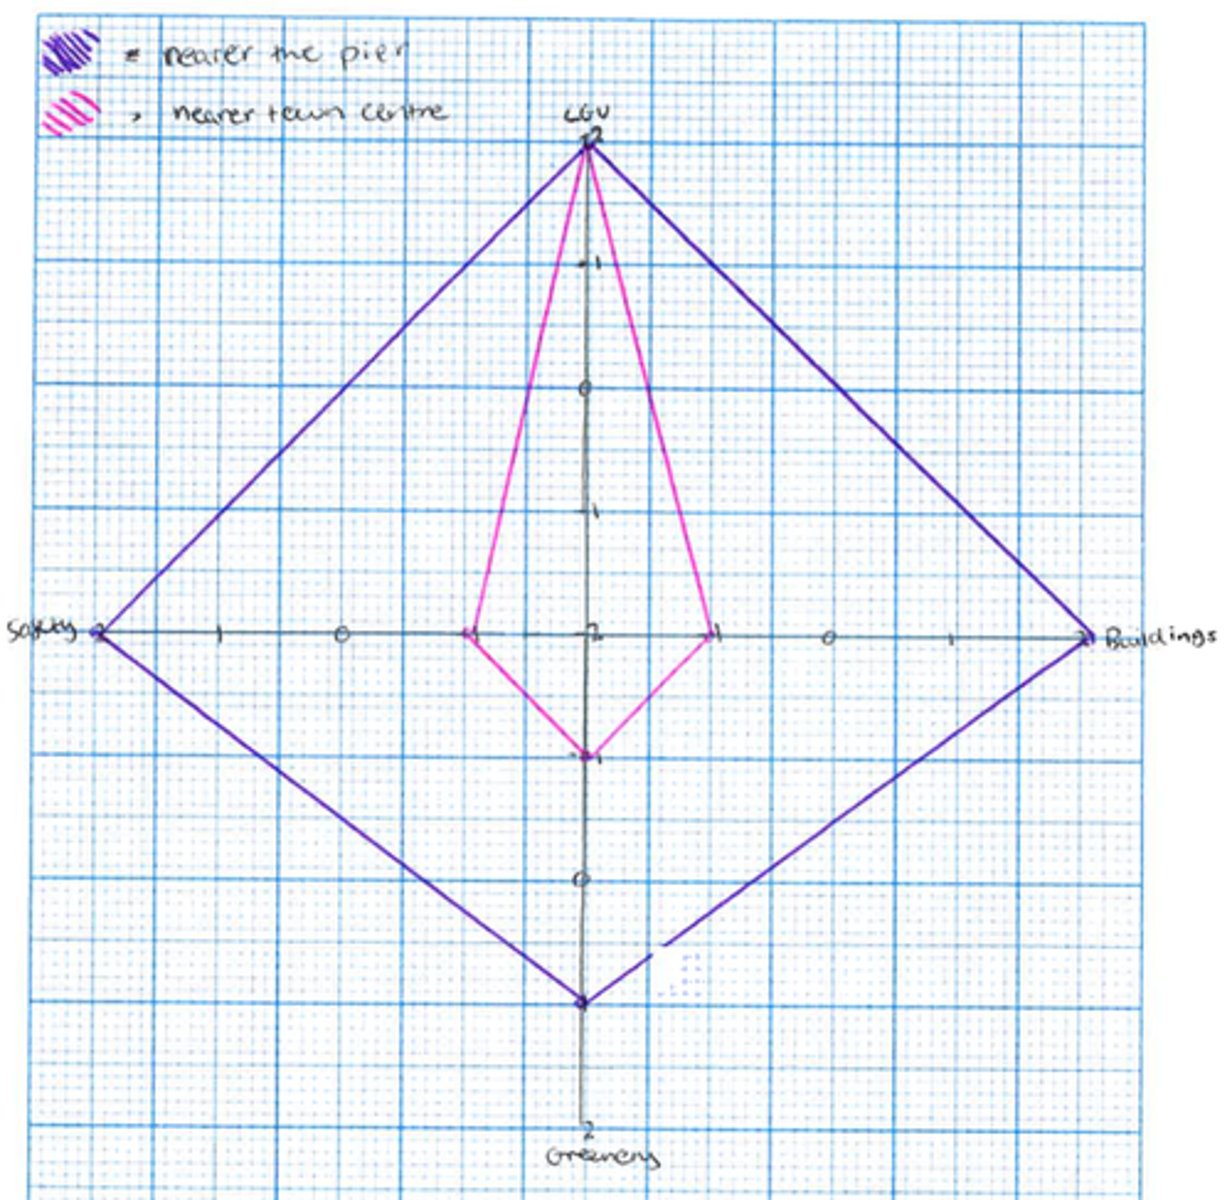
Data presentation - Bipolar Environmental Assessment
Radar Graph
Benefits:
- Easy to see which categories have high scores opposed to low scores
- Good use of colours
Limitation:
- If too many categories ---> it can be hard to read
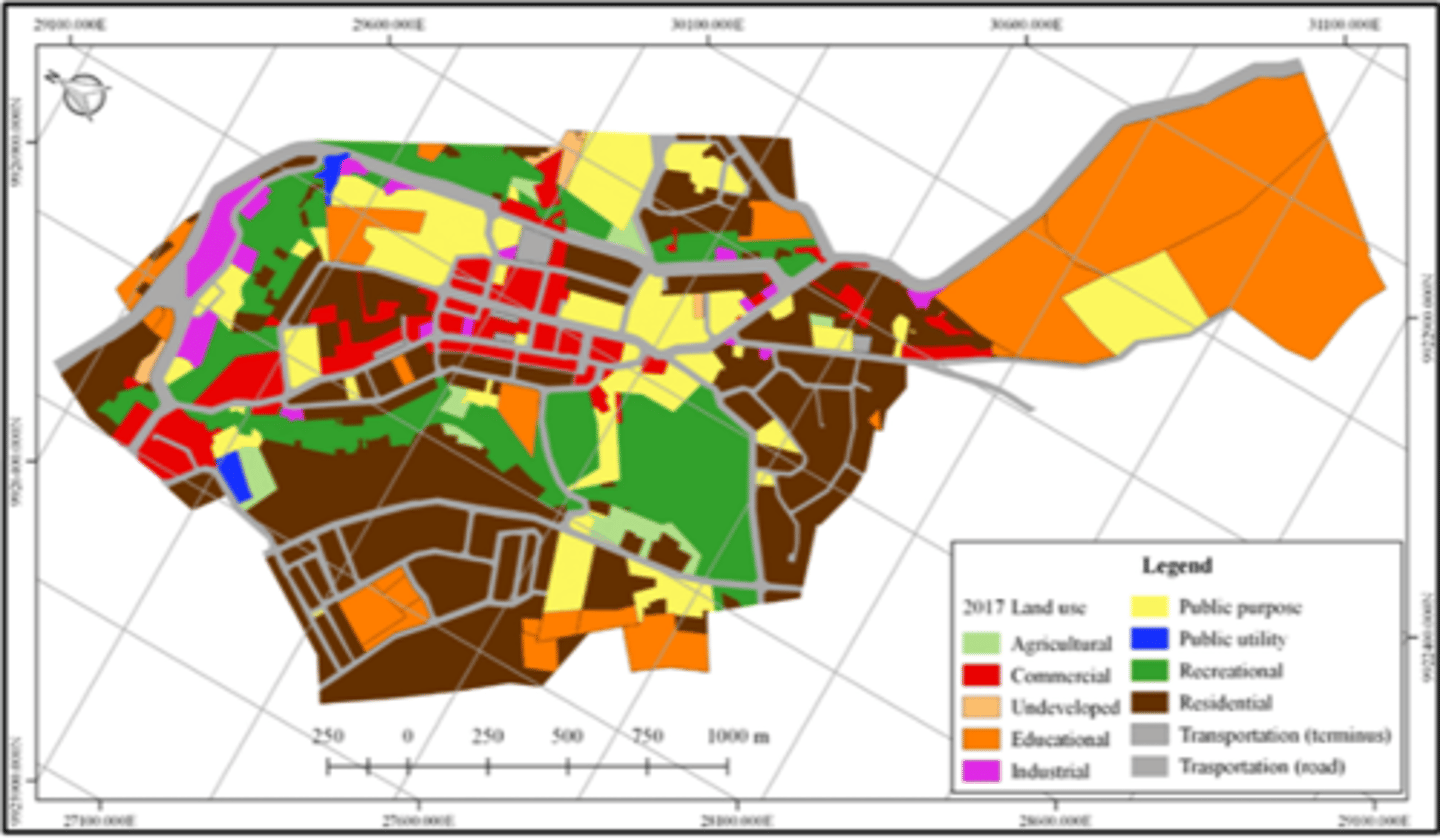
Data presentation - For the greenery and open space section of the bipolar environmental assessment
Land use map (geolocated) shaded according to colour
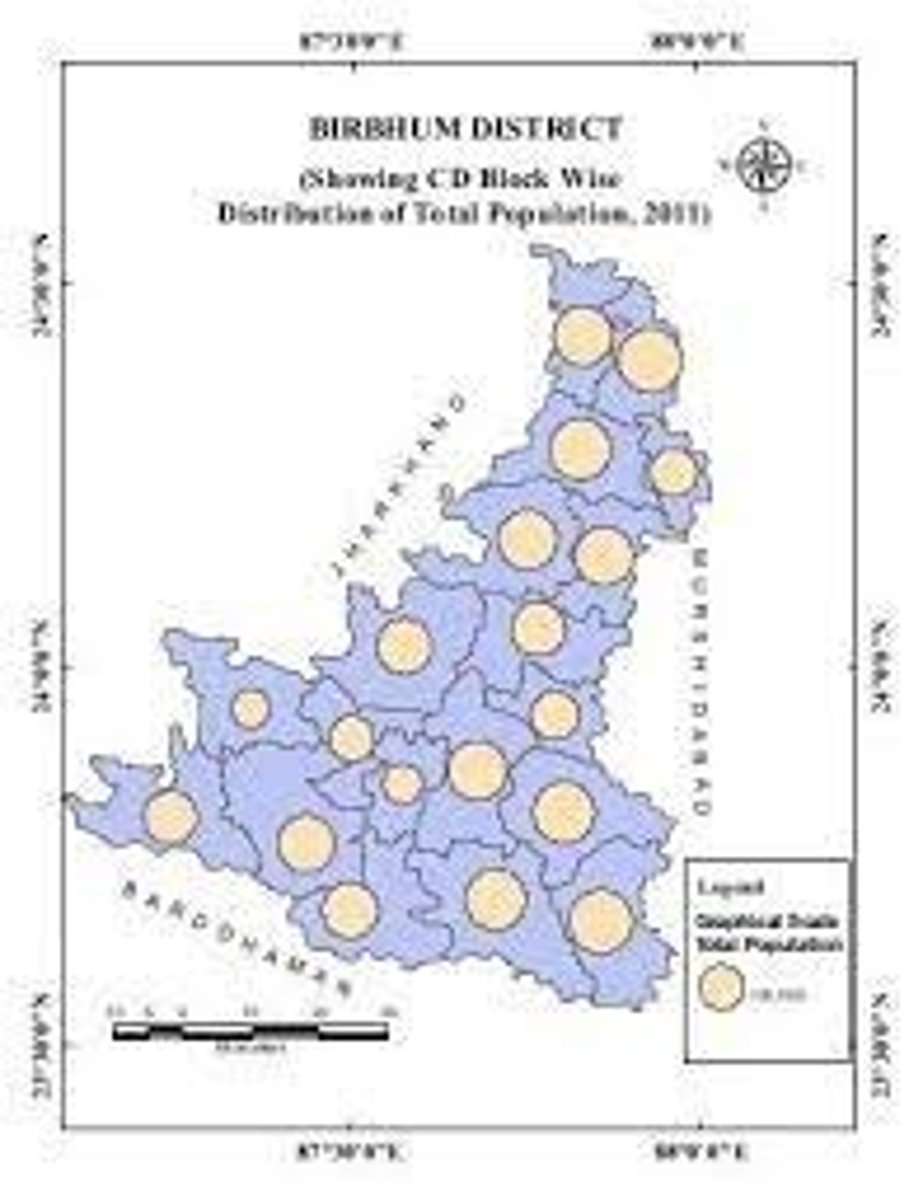
Data presentation - For the Numbers of HMOs:
Proportional circles on a map (geolocated)
Data Anaylsis
- For the signs of deprivation and urban decay we could:
o Count up the number of ticks for each category and then find out a percentage.
o Shade the grid squares (a la Land Use) to show present or not (geolocated)
o Add up the number of ticks for each location and give a % for that line.
Conclusion
Bipolar Environmental Assessment
- Its strengths were that it made it easy to compare data and it allowed us to take the qualitative data and turn it into quantitative data to make comparisons easier, trends are very easy to identify. They're efficient, quick and easy to do.
- Weakness/limitations: its subject data e.g. 'safety if alone' can be based on many factors e.g. Gender/time and the weather/time of day can affect data collection, many assumptions are present.
Clone Town Britain Survey
- Its strengths were in the fact that it rather accurately helped us to determine whether or not the area was a clone town, thus it helped us to reach an accurate assessment.
- Its weaknesses and limitations were present in the fact that the categories that shops went into could be subjective, as many shops sold more than one item or were novelty shops thus affecting data.
Evaluation - How successful was my study?
- We chose a good location ----> see aforementioned reasons for that
- We were able to use the data we had recorded ourselves and use secondary data to make an informed conclusion and evaluation of our data, to evaluate the extent of the deprivation in Boscombe.
- The data was somewhat reliable and we were able to successfully evaluate all types of areas in Boscombe systematically.
Evaluation - Could any improvements be made?
- We could visit even more sites in Boscombe, as due to time constraints we only properly evaluated 5 sites.
- Use secondary data to cross-reference all our own data with.
- Re-visit the sites at another time of year, e.g. Visit each season to see the change.
- Re-visit in different weather, e.g. Visit in the rain, snow, hail.
- Look at other secondary data - e.g. The weather forecast for previous weeks.
- Use primary research data collection in the form of questionnaires.