Purdue 1st Year Microeconomics Exam 1 Study Guide
1/69
There's no tags or description
Looks like no tags are added yet.
Name | Mastery | Learn | Test | Matching | Spaced | Call with Kai |
|---|
No analytics yet
Send a link to your students to track their progress
70 Terms
Economics
A social science that studies the choices we make as we cope with scarcity and the incentives that influence and reconcile our choices
Ceteris paribus
all else equal
Microeconomics
Individual choices in the market
Macroeconimics
Large scale, bigger picture look at the economy
Normative analysis
Judgement/opinion
Positive analysis
Factual statement
Scarcity
available resources are insufficient to satisfy wants
Examples of things that are not scarce
Air, pollution, etc.
Types of Economics Resources (scarce)
-Land (natural resources)
- Labor (People)
- Capital (Manmade resources ex: Machinery, Buildings, etc)
- Entrepreneurship (Coming up with ways products are produced)
Incentives
Rewards or penalties that encourage or discourage an action
Opportunity cost
Value of the best alternative
Explicit costs
Monetary expenses
Implicit cost
value of forgone alternatives
Free goods
Free goods can still have economic cost
Sunk Cost
Irreversable cost
- Your decision doesn't allow you to take that cost away
Ex: Time lost, you cant undo time you've spent
Car value: As soon as your car has left the dealership the value has depreciated, and if you try to sell it back it's used
Marginal benefit
Benefit of one additional unit of a good or activity
General rule about marginal benefit and cost
- Marginal benefit goes down as quantity goes up
- Marginal cost goes up as quantity goes up
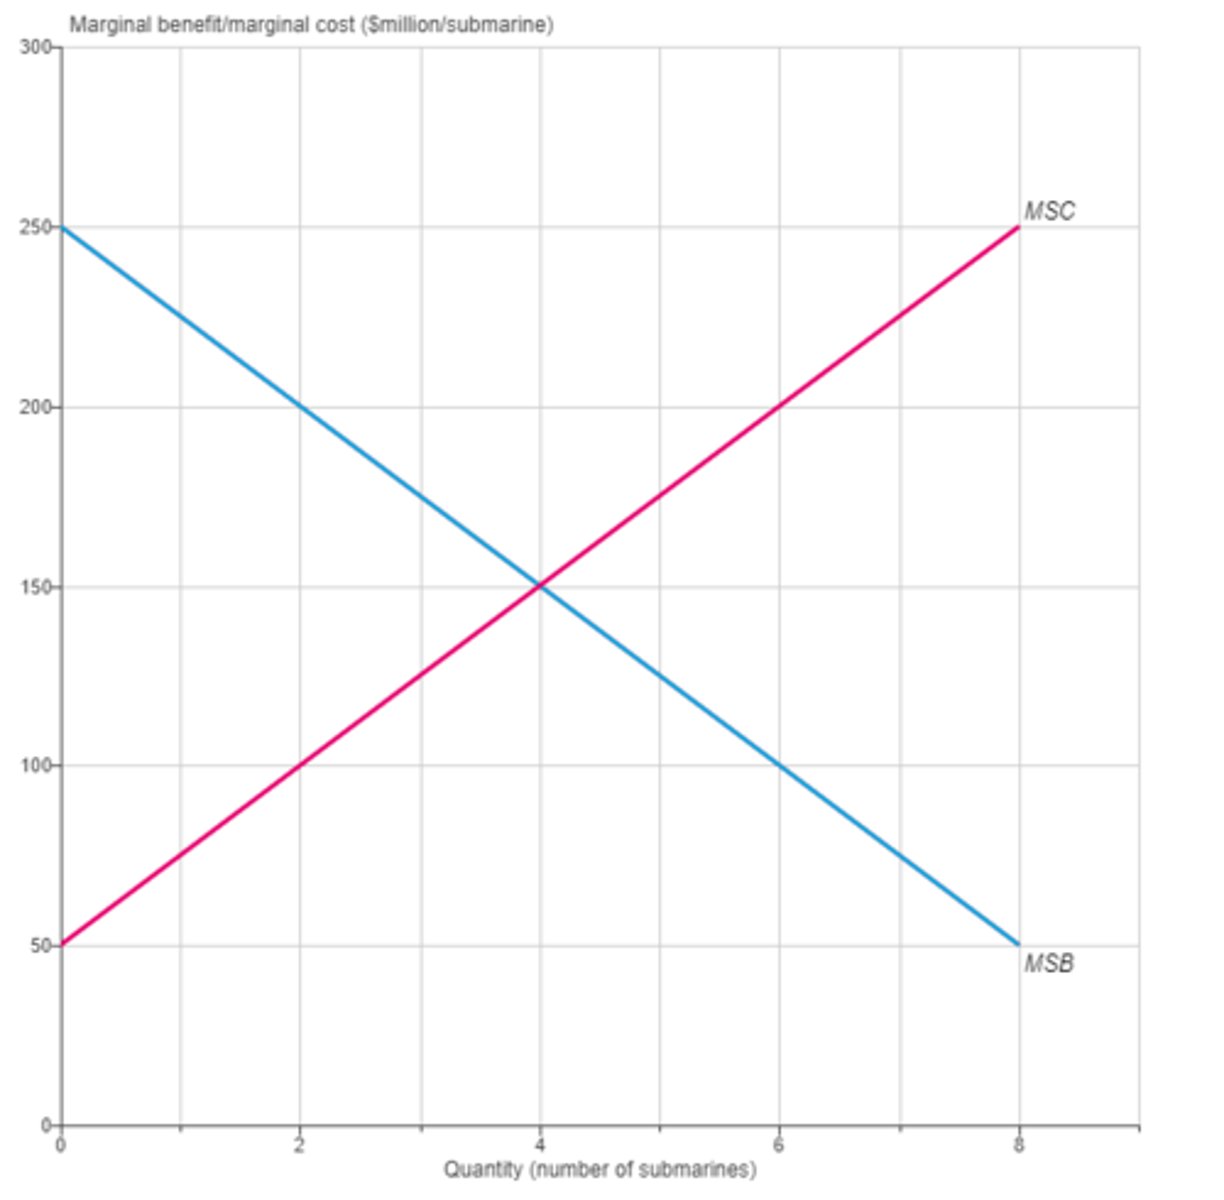
Graph of Marginal cost and Marginal benefit
Marginal cost has a positive slope
Marginal benefit has a negative slope
Absolute Advantage
Can make more than the other person in a certain amount of time
Comparative Advantage
Producing a good with a lower cost than the other person
Production Possibility Frontier (PPF)
Graph of the maximum output that can be produced by an individual or an economy
Comparing PPF slopes
Whoever has a flatter slope has the comparative advantage in the good on the X axis
Steps to Create an Economy wide PPF
1. Find the extremes on the X and Y (what they would do if they both spent their entire time on one task)
2. Work your way down the X axis, assigning the other task to the person who has the comparative advantage
3. Once you have reached the point of specialisation, the slope changes to what the person who doesn't have comparative advantage would contribute
Point of Specialization
The point at which both parties are only producing the task which they have comparative advantage at
Productive efficiency
Producing at the lowest coast
- Every point on the PPF satisfies production efficiency
Allocative efficiency
Using resources where they have the highest value
- Dependent on demand and supply
Ways that PPF shifts
- Natural resource discovery --> More of good X and Y
- Population growth --> More labor = more X and Y
- Labor Productivity --> More education, etc = More X+Y
- Technological change --> Not necessarily changing both. Could change X but not Y
- Capital accumulation --> More buildings, tools, etc = Shift out
- Natural disasters or other bad events --> Shift inward
Demand
The maximum quantity a consumer is willing and able to purchase at various prices
Law of demand
Price and quantity demanded are inversely related
- Higher prices reduce quantity demanded
- Lower prices increase quantity demanded
How to graph demand
- Price goes on the y-axis
- Quantity demanded goes on the x-axis
Changes (shifts) in Demand
1. Income - Ex: Normal goods, inferior goods both change in different ways
2. Prices of related goods Ex: Substitutes, complements
3. Changes in expectations - Change in price, Change in income
4. Tastes and Preferences - Whats trendy & Populars
5. Number of Buyers - More buyers = More demand
Normal goods
Goods where demand rises when income rises and falls when income falls
Inferior goods
Goods where demand rises when income falls and demand falls when income rises
ex: instant ramen noodles
Substitutes
Goods that are used in place of one another Ex: Oreos & thin mints
As oreos price goes up, you would buy more thin mints
Complements
Goods that are used together. Ex: Milk and Thin mints. As the price of milk goes up, the demand for both milk and thin mints go down because they are used together
Change in expectation of price
If price is expected to rise in the future, the current demand is up
If the price is expected to fall in the future, the current demand is lowered
Change in expectation of income
If income is expected to rise:
Demand for normal goods rises
Demand for inferior goods falls
Supply
The maximum quantity a seller is willing and able to sell at various prices
Law of supply
As price increases, quantity supplied increases
Factors that change supply
1. Input prices (natural resources, labor, etc.)
- Wages paid to labor = Less supply
2. Prices of related goods in production (substitutes and compliments in production)
3. Price - If prices are expected to rise, you sell less currently so that you can sell more when its higher. If you think the price is going to fall, you would sell more currently so that you can get the most out of it
4. Number of suppliers - More sellers = More supply because more people are selling the same thing
5. Technology: Changes in technology usually mean less cost to produce, increasing supply
Change in Supply/Demand VS Change in Quantity Supplied/demanded
Change in Demand/Supply - Shifts the entire line
Change in quantity demanded/supplied - shift along the line
When you are changing both Demand and Supply:
If either price or quantity shifts in opposite directions, it is indeterminate
Ex: Decrease in supply and an increase in demand:
Price rises for both but quantity decreases for supply and increases for demand. Therefore: The quantity is indeterminate
Price elasticity of demand
Responsiveness of consumers to a change in price
In a graph: the steeper the demand curve, the more inelastic
3 Ranges of Elasticity
If Elasticity > 1, demand is elastic
if elasticity > 1, demand is inelastic
If elasticity = 1, demand is unit elastic
Determinants of Elasticity of Demand
(Note: The more broadly the market is defined, the less elastic demand is)
1. Availability of Substitutes
- Lots of substitutes = more elastic demand
- Few substitutes = Less elastic demand
2. Proportion of budget spend on the good
- More budget spent = more elastic
- Small budget spent = Less elastic
This is because if you are investing more money into something, you are more likely to actually change how much you want it
3. Time
- More time to make a decision = Demand is more elastic
- Less time = less elastic
This is because if you have more time to think about your decision, you are more likely to change
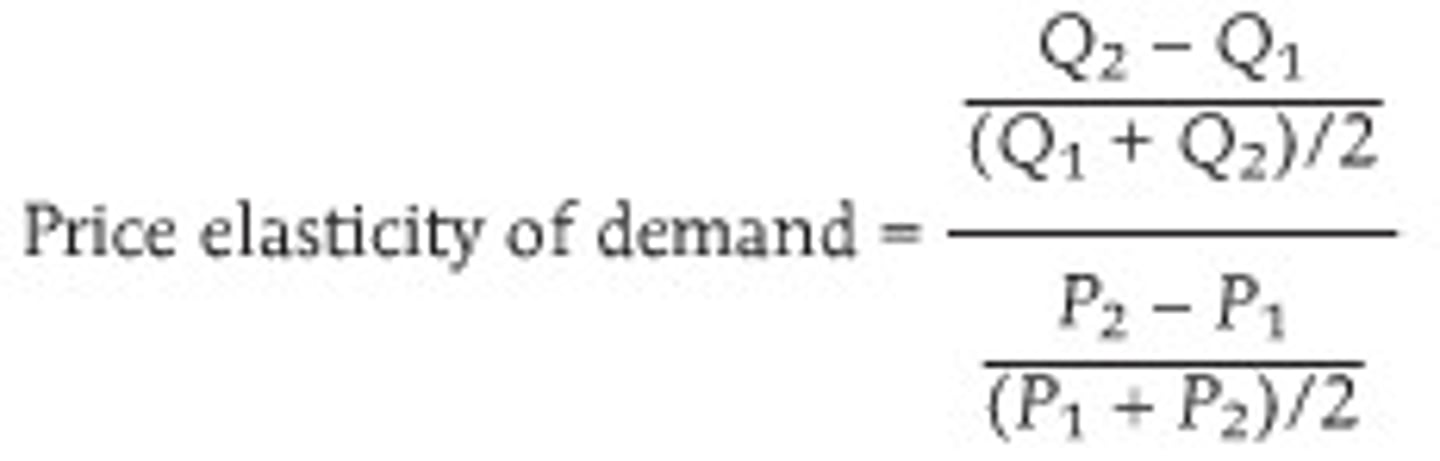
Calculating Price Elasticity of Demand
Absolute Value(Change in Quantitiy/Change in Price * Average Price/average quantitity)
Where in the graph is it elastic, inelastic, and unit elastic
At the midpoint, the graph is unit elastic. At loser prices (Left of the graph) demand is more elastic. At higher prices (right of the graph) demand is less elastic
Perfectly Inelastic Demand
Vertical Line (Does not really exist)
Perfectly Elastic Demand
Demand is Horizontal (If the price was risen at all, everybody would not buy it)
Revenue
Price times quantity demanded
It is effected depending on elasticity
When it is inelastic - Increase in price is more revenue, decrease is less revenue
When it is elastic - Increase in price is less revenue, decrease is more revenue
If it is unit elastic - Revenue is maximized
Cross-price elasticity
It is the same formula as Elasticity, except you are comparing 2 different products. (for example you would compare the change in price of one item vs the change in quantity of a second item) (NO ABSOLUTE VALUE)
Positive number = Substitute
Negative number = complement
Income elasticity
Measures how income affects demand/spending
Positive: Normal Good
Negative: Inferior good
Percent change in quantity/Percent change in income
Price Elasticity of Supply
How sellers react to a change in supply
Greater than 1 is elastic,
less than 1 is inelastic,
1 is unit elastic
Formula is the same as elasticity of demand
Determinants of Elasticity of Supply
1. Availability of substitute inputs
- Fewer substitutes = Less elastic
- more substitutes = More elastic
2. Time
- More time = More elastic
- Less time = Less elastic
Extremes of Elasticity of Supply
Identical to demand,
Vertical = Perfectly Inelastic (happens in the real world where no matter how much you change the price, you can't increase supply, in the short term)
Horizontal = Perfectly Elastic (Probably wouldn't happen in real life, but if any small change in price happened, you would completely stop producing, or produce infinitely)
Consumer Surplus
Extra value received by a consumer from a product above the listed price
Producer Surplus
The difference between the price they are selling a product for and what the lowest price they would ever sell the product for.
Total Surplus
Consumer and producer surplus together
Maximized at equilibrium
Deadweight loss
The decrease in consumer and producer surplus from an inefficient level of production
Obstacles to efficiency
Price controls & Quotas
Taxes
Lack of competition
Public goods
Externalities
High transactions cost
Symmetry Principle
people in similar situations should be treated similarly
Utilitarianism
Achieve the greatest happiness for the greatest number
Maximin Principle
Make the poorest person as well off as possible
Tax the rich and redistribute to the poor until nobody is the poorest
Price Ceiling
The maximum legal price
Ex: Rent controls, salaray caps, utilities
Price Floors
Minimum legal price
Ex: Minimum wage, agricultural price supports
Allocating a Shortage
1. Lines (waiting) --> Increases cost because your paying in time
2. Circumvent the rule - "Black market price" (offer more money under the table)
3. Lottery
4. Rationing
5. Competitions
6. Discrimination
7. Violence
Black Market Price
Plug in the quantity supplied number into the Demand equation to find the price somebody would be willing to pay in the black market
Excise Tax
Per unit tax
Tax Incidence
The division of burden of the tax between buyers and sellers
Whoever is less elastic tends to bear less of the burden
Quota
Maximum quantity that can legally be sold.