Likelihood Ratio Tests
1/14
There's no tags or description
Looks like no tags are added yet.
Name | Mastery | Learn | Test | Matching | Spaced |
|---|
No study sessions yet.
15 Terms
likelihood ratio tests
used to evaluate whether a more complex model is justified over a simpler one
null hypothesis of LRTs
the two models are equally effective at explaining the variation
alternative hypothesis of LRTs
the complex model does a better job at explaining the variation
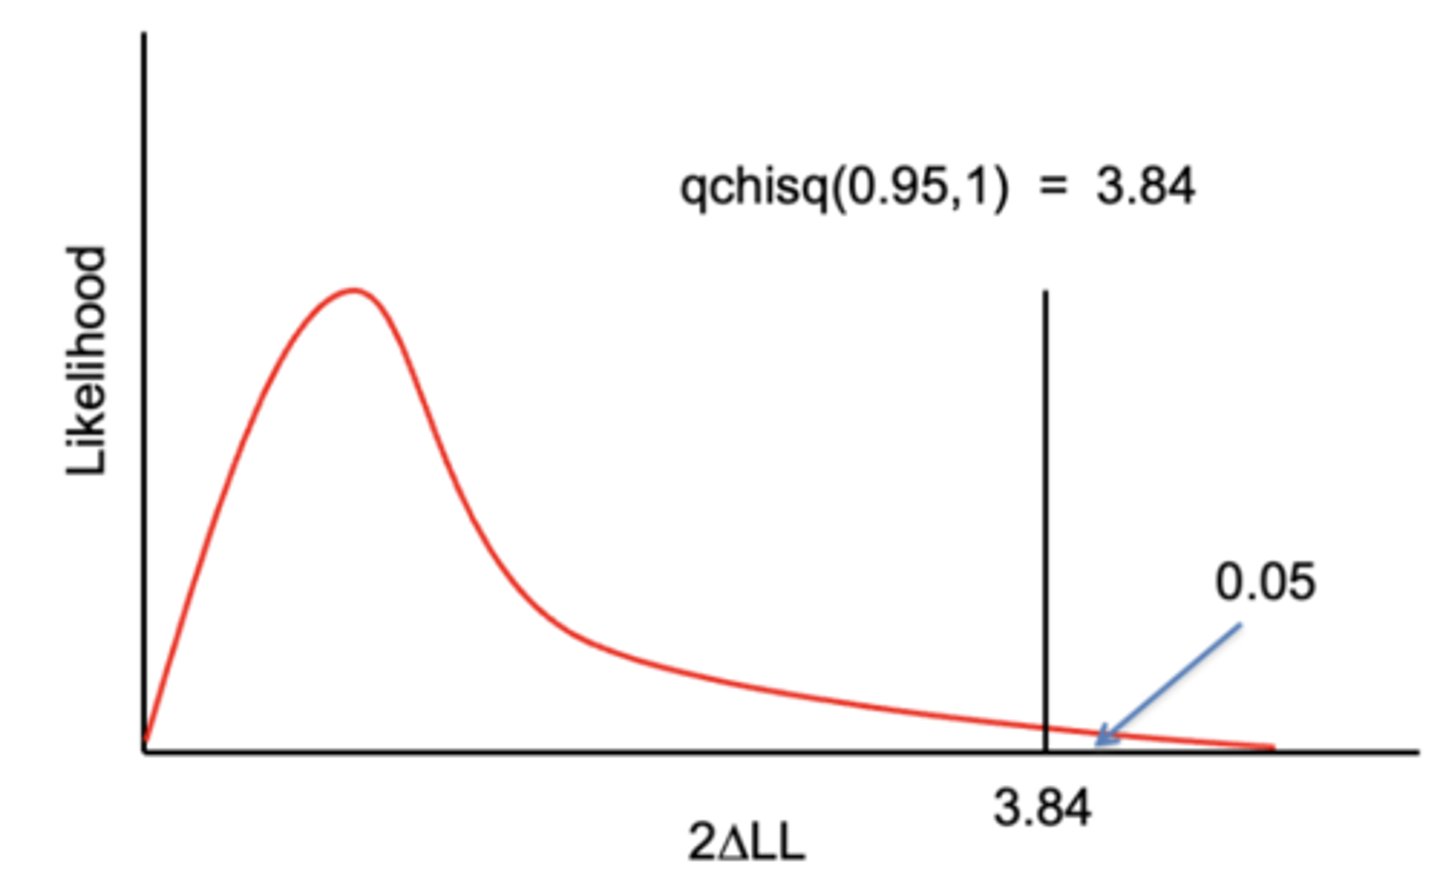
LRT statistic
2 x difference of log-likelihoods
when to reject the null hypothesis of LRTs
if the LRT statistic is so large it leaves less than 0.05 to the right of it
Akaike's Information Criterion (AIC)
-2(log-likelihood) +2(number of parameters)
analysis of AICs
the lower the AIC score, the better the model fits, models within 2 AIC units are not regarded as distinguishable
Student's t-statistic
coefficient/standard error of coefficient
confidence intervals
95% of the intervals should contain the sample mean
post-hoc tests
conducted when you want to know not only whether a factor variable is significant but exactly which levels of the variable are significantly different
R-squared
the proportion of the total variation explained by the explanatory variables
when R-squared is used
when response is normally distributed and models fitted using least squares
pseudo-R-squared
equivalent of using R-squared when using maximum likelihood
pseudo-R-squared formula
null deviance - residual deviance / null deviance * 100
when to use AIC over LRTs
when you want to compare non-nested models