APHG Exam 2 Population & Migration
 Call Kai
 Learn
Learn Practice Test
 Spaced Repetition
 Match
Match Flashcards
 Knowt Play
1/88

There's no tags or description
Looks like no tags are added yet.
Name | Mastery | Learn | Test | Matching | Spaced | Call with Kai | Chat |
|---|
No analytics yet
Send a link to your students to track their progress
89 Terms
What describes a concern for a country with an aging population?
C) As the proportion of older people in the country increases, fewer young workers are available to contribute tax revenues to support programs that provide services to the older population.
The map shows the number of people per unit of land. Which of the following types of data are shown on the map?
A) Arithmetic density
There has been an increase in asylum seekers from Syria to the European Union in recent years. Which of the following best describes the reason for this migration?
C) A continuing issue of conflict and political unrest within Syria
Country Female life expectancy Male life expectancy %over 65
Germany 83 78 21%
Italy 85 81 22%
Japan 87 81 28%
Based on the data shown, which of the following describes the most likely population context for the countries listed?
E) Stage five of the demographic transition model due to very low birth rates
Which of the following characteristics is currently shared by Switzerland, Canada, and New Zealand?
A) Low population-growth rates
45-49 at past 60; 35-39 at past 60
Based on the population pyramid above, which of the following will pose the greatest demographic challenge to China beginning in 2029?
A) Providing for the needs of its aging population
A student who lives in Minneapolis chooses to spend her spring break in Florida rather than in Jamaica because Florida is closer and the plane fare is cheaper. This type of decision-making best illustrates the concept of
C) intervening opportunities
Which population pyramid shown above best represents a college town?
D
Which population pyramid shown above best represents a town with a military base?
C
Country Birth Rates Death Rates
France 12 9
Russia 13 13
Brazil 13 6
China 13 7
Mexico 20 5
India 21 7
Egypt 30 7
Nigeria 39 13
Based on the data provided, which of the following best describes how changing roles for women influence patterns of social values?
D) Higher birth rates in African countries suggest that women in African countries have less access to education and employment than European women.
Which of the following explains an unintended consequence of China's antinatalist one-child policy?
C) A projected shortage of working-age people to care for the rising elderly population, resulting in an increase in the cost of living for older people.
Country A is a more developed country with a low birth rate, a low total fertility rate, a high life expectancy, and a high percentage of urban population. Based on this information, which of the following outcomes is most likely to occur in Country A?
C) Pressures on pension and social security programs are at critical levels as the number of elderly increases.
Which of the following is a correct statement about the demographic transition model?
E) It is characterized by relatively low growth rates at stage 1 and stage 4.
Which of the following countries is best described as being at Stage 3 of the demographic transition model?
C) Bolivia: birth rate = 24 , death rate = 7

Which of the following country demographics would be used to explain the need for the pronatalist policies shown?
B) A country with a birth rate of 1111, a death rate of 1313, and a rate of natural increase of −0.2−0.2 , legislates tax credits for working parents
Total population slowly decreasing, along with population under 16 decreasing. Population over 65 is slowly, very slowly, rising;
Which of the following best explains a possible limitation of the trends assumed from the population pyramid and estimates in the data table?
C) Labor shortages may cause the government to reduce the legal barriers to immigration, and immigrant populations could increase the working-age cohorts.
Total population slowly decreasing, along with population under 16 decreasing. Population over 65 is slowly, very slowly, rising;
What changes could local governments, businesses, and corporations make to reverse Japan's national birth patterns?
B) Adding low-cost or zero-cost infant day care and preschool centers to allow mothers to return to the workforce
Total population slowly decreasing, along with population under 16 decreasing. Population over 65 is slowly, very slowly, rising;
What is the likely impact of the numerical change by 2050 of the total population on the eventual shape of Japan's population pyramid?
E) Because of low birth rates over many years, the 2050 population pyramid will likely be an inverted pyramid.
Even though total fertility rates have been declining in some less-developed countries, the total population has continued to grow. This is primarily because a high percentage of the population is
D) under the age of 15
In the nineteenth and early twentieth century, the demographic transition in Europe was best characterized by
E) urbanization and falling birth rates
Which of the following describes a characteristic of a country moving from stage 2 to stage 3 of the demographic transition model?
D) Declining death rate
Which of the following describes the most likely cause of death for a citizen of a country in stages 4 and 5 of the demographic transition model?
B) Degenerative diseases due to old age and lifestyle
Which statement best describes population growth patterns in the world today?
C) In the world as a whole, fertility rates have fallen in the last 25 years.
The low birth and death rates for a country in stage 4 of the demographic transition model are best explained by
D) the level of urbanization and technological advancement of a more developed country
Map of Brazil with a lot of dots on the east coast and also a big dot. Sparse dots on the west side of the country. Dots represent population of the cities
Which of the following best explains a likely effect of Brazil's population distribution?
C) Uneven economic development as eastern Brazil experiences more growth than the sparsely inhabited western regions
The nineteenth-century emigration of a large number of Swedes from a particular region of Sweden to Isanti County, Minnesota, as a result of communications from friends and relatives who preceded them there is an example of
B) chain migration
Which of the following types of migration are correctly explained by the example given?
B) International migration and voluntary migration: Family A from Mumbai has convinced their close friends Family B to emigrate to London as they did in order help start up their business
Since the 1970s changes in the social roles, lifestyles, and employment patterns of women in Europe, Canada, and the United States have affected the overall population through which of the following?
B) Decreased total fertility rates
Which of the following statements best describes how the epidemiologic transition affects the demographic transition?
B) Improvements in nutrition, sanitation, and health care cause death rates to fall in stage 2 of the demographic transition.
In the model shown, the lines for birth rate, death rate, and total population are indicators of a country's
B) level of social and economic development over time
The demographic transition is a general model that seeks to explain
E) how differences in birth and death rates result in natural population change
In the century after the arrival of Europeans, which of the following changes occurred to the indigenous population of the Americas?
D) It decreased dramatically with the introduction of new diseases
A refugee enters the European Union in Italy and is temporarily housed in Germany. He is then granted asylum and is permanently settled in Sweden. Which of the following describes this type of migration that is facilitated by the European Union's open border policies?
D) Step migration across member states to a final destination
Which of the following best explains why, in the late eighteenth and early nineteenth centuries, Thomas Malthus proposed his population theory?
A) Malthus theorized that, if left unchecked by regular cycles of famine and misery, population would increase beyond the ability to feed itself.
Assuming a world population of 5,700,000,000 and an annual growth rate of 1.6 percent, how many people will be added to the world's population in the next year?
C) 91,200,000
Which of the following countries is the primary destination for guest workers from the Maghreb region of northern Africa?
A) France
Which of the following explains a significant positive impact that the immigration of large populations of Chinese people had on places like Vancouver and Los Angeles?
D) Chinese immigrants established businesses and religious centers that provided their new cities with greater access to elements of Chinese culture such as arts, cuisine, and religion.
Which of the following explains the major effect of migration flow to Southwest Asia from other regions in Asia?
D) Guest workers migrate to the region for jobs in construction and the oil fields, increasing the volume of exports from the region.
Which of the following would be most likely to increase life expectancy in a less developed country, resulting in an aging population in that country?
D) Improvements in access to health care and sanitation
Country Birth Rate Death Rate
France 12 9
Mexico 20 5
India 21 7
Egypt 30 7
Nigeria 39 13
The data in the table can be used to describe a high level of female empowerment for which of the following countries?
D) France
Map of Brazil with a lot of dots on the east coast and also a big dot. Sparse dots on the west side of the country. Dots represent population of the cities. Which of the following describes information a geographer could identify from the map of urban populations in Brazil?
D) Patterns of arithmetic density within specific regions
During the nineteenth and twentieth centuries, which of the following types of intraregional migration was the most prominent worldwide?
A) Rural to Urban
Which factor is most responsible for the increase in Japan's dependency ratio?
A) An increase in life expectancy
Which of the following is most characteristic of societies currently in the last stage of demographic transition?
D) Aging population
In the first decade of the twenty-first century, which of the following countries had the lowest fertility rate?
E) South Africa
In the early part of the Industrial Revolution in Europe, Thomas Malthus developed a theory that population increases exponentially, while food production can increase only arithmetically. Which of the following statements best explains how the Industrial Revolution reduced the threats forecast by Malthus?
A) The resulting rural-to-urban migration for jobs in factories led to a decline in birth rates and lowered population growth rates below what Malthus predicted.
In 1798 Thomas Malthus argued that populations grew exponentially while food supplies grew arithmetically. Consequently, Malthus argued that food shortages would develop until famine and other checks slowed population growth. What statement correctly explains why Malthus' prediction did not come true in 1800s Europe?
A) Urbanization resulted in smaller household sizes, and the mechanization of agriculture increased food production.
1950 1990 2015 2035
City A: 12.8 million 16.1 million 18.6 million 20.8 million
City B: 2.3 million 14.8 million 20.9 million 24.5 million
Which of the following explains the pattern of growth in City B relative to City A ?
A) City B is located in a less developed country and has high rates of rural-to-urban migration, whereas City A is located in a more developed country and has low rates of rural-to-urban migration.
Transnational migrants often send money back to their home countries to support nonmigrant family members. What is the term used to describe their international financial transactions?
E) Remittances
Since 2000 the global pattern of international migration has resulted in most migrants seeking destinations that are best described as
B) urban and suburban areas
many lines coming from outside countries into about three countries
The flow lines on the map above most likely represent the movement of
C) guest workers
Which of the following profiles characterizes the population group that is the most likely to migrate?
B) Single, twenty-five years old
Which of the following describes a pull factor affecting migration to some of the more developed countries?
D) Universal health care
All of the following twentieth-century migration streams were propelled by persecution or open conflict EXCEPT
E) Mexicans leaving Mexico
Which of the following characteristics applies to more-developed countries?
B) Long life expectancies
In which of the following contexts could a neo-Malthusian perspective most successfully explain population characteristics?
C) A country with a high rate of natural population increase, where food supplies are at risk
Area Births Deaths Female/male life expectancies
World 19 7 74/70 years
African Con.: 35 9 64/61 years
North Africa: 26 6 74/71 years
Sub-Sahara Africa: 37 9 62/59 years
Which of the following best explains the significant difference in North Africa's demographic data from the rest of the African continent and North Africa's closer similarity to global demographic data?
A) North African improvements in nutrition, health care, and sanitation have reduced birth and death rates as well as improved life expectancies over time.
In which of the following pairs do both countries exhibit zero or negative population growth rates?
C) Japan and Germany
Which of the following explains why a country with a high physiological density (e.g., Japan, Egypt, or the Netherlands) risks exceeding its carrying capacity?
B) The population places a large amount of pressure on the arable land to produce enough food without risking severe environmental degradation.
Physiological population density differs from crude population density in that physiological density
C) explains density in terms of people per arable square land unit, while crude density explains density in terms of people per total square land unit
Sri Lanka and Australia have about the same population. What data would help you determine which country has a higher physiological population density?
E) The amount of arable land in each country
Physiological population density is viewed as a superior measure of population density for which of the following reasons?
A) It is more reflective of population pressure on arable land.
A: western part of US; B: Africa, Egypt area; C: India; D: Japan;
E: Australia
On the map above, which one of the following boxes is in an area where the population density is high and the level of economic development is low?
C) c
Map with lake with population density over 1,000 around the lake area and population is sparser outside of lake area
Which of the following best identifies the data for the Eastern Great Rift Valley, shown on the map?
A) High arithmetic density
Chart that shows Asia has 5.25 billion people in the population in 2050 with a stead climb up. Africa has 2.59 billion in 2050 but a sharper slope up.
Based on the graph, predicted population growth in which of the following regions is explained by a high total fertility rate?
B) Africa
Which of the following is a distinctive aspect of population policy emphasized for the first time by the international community in the 1990's?
C) Women's empowerment
The term that describes the concept that population will continue to grow even after fertility rates decline is known as
A) demographic momentum
In 2018, a large number of migrants from Afghanistan and Iraq applied for asylum in the European Union. Which of the following is a pull factor that explains this migration?
E) Economic growth and employment opportunities in Europe, attracting immigrant workers
The international Syrian refugee crisis that started in 2011 is best explained by which of the following migration factors?
E) A political push factor from Syria, where armed conflict imperils personal safety
In recent decades, all of the following have played a major role in the rapid growth of Sun Belt cities of the United States EXCEPT
D) climatic changes leading to colder northern winters
Which of the following best describes a country with a rate of natural increase of 0.4 ?
C) Slow population growth
Country X has a high youth-dependency ratio. Country Z has fears of running out of agricultural resources. Which of the following explains why Countries X and Z would implement anti-natalist policies?
E) Antinatalist policies promote family planning and education of women to reduce fertility rates.
In the early twenty-first century, the largest number of refugees is located on which of the following continents?
A) Africa
The early United States population was predominantly Protestant. In the nineteenth century, urban populations became increasingly Roman Catholic, especially in the cities of the Northeastern United States. This shift in the pattern of religion was caused by
B) transnational migration from Ireland, southern Germany, and Italy
The ability of a resource base to sustain a population is known as its
B) carrying capacity
In many less developed countries, only a small percentage of school-aged youth attend school regularly. In some cases, fewer females than males are enrolled in schools. Which of the following patterns is a concern in less developed countries with low school enrollment?
C) A lack of qualified males and females to develop a workforce that will improve economic growth
Which of the following regions had the smallest percentage of people living in urban areas at the end of the twentieth century?
B) South Asia
Since 2000, people in the largest category of international migrants seeking asylum in a different country are best described as
C) individuals fleeing conditions of armed conflict
Which term best describes the majority of voluntary migrants from South Asia to the Persian Gulf countries of Bahrain, Qatar, and Kuwait during the 1990s and 2000s?
A) Guest workers
A country in the first stage of the demographic transition demonstrates which of the following?
D) High birth rates, high death rates, and low rates of population growth
The dependency ratio is most useful for indicating the
E) relationship between the potential labor force and the remainder of a country's population
A country at the end of the demographic transition usually has which of the following?
D) Low birth and death rates
The Malthusian view of the world argues that
D) famine in developing countries can be explained by examining their patterns of population growth
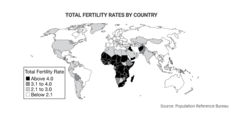
Which of the following describes the spatial pattern shown in the map of total fertility rates?
D) The lowest total fertility rates are shown in Europe, Russia, East Asia, Australia, and Canada.
larger male population in 25-39 age group
The sex ratio represented in the age-sex graph above for Country X is most likely the result of
E) a large guest-worker population
The increasing percentage of urban dwellers in more-developed countries is best explained by
A) greater access to job opportunities, resources, and facilities
It can be inferred from global patterns of population growth that the country most likely to be in West Africa is
C) country 3
One would expect to find a population with a relatively young age structure in
A) less developed countries
Which of the following types of countries are most likely challenged with the problems associated with a large youth-dependent population, such as providing public primary education for all children?
B) Less developed countries