Introduction to Geographic Information Systems (GIS)
1/117
There's no tags or description
Looks like no tags are added yet.
Name | Mastery | Learn | Test | Matching | Spaced | Call with Kai |
|---|
No study sessions yet.
118 Terms
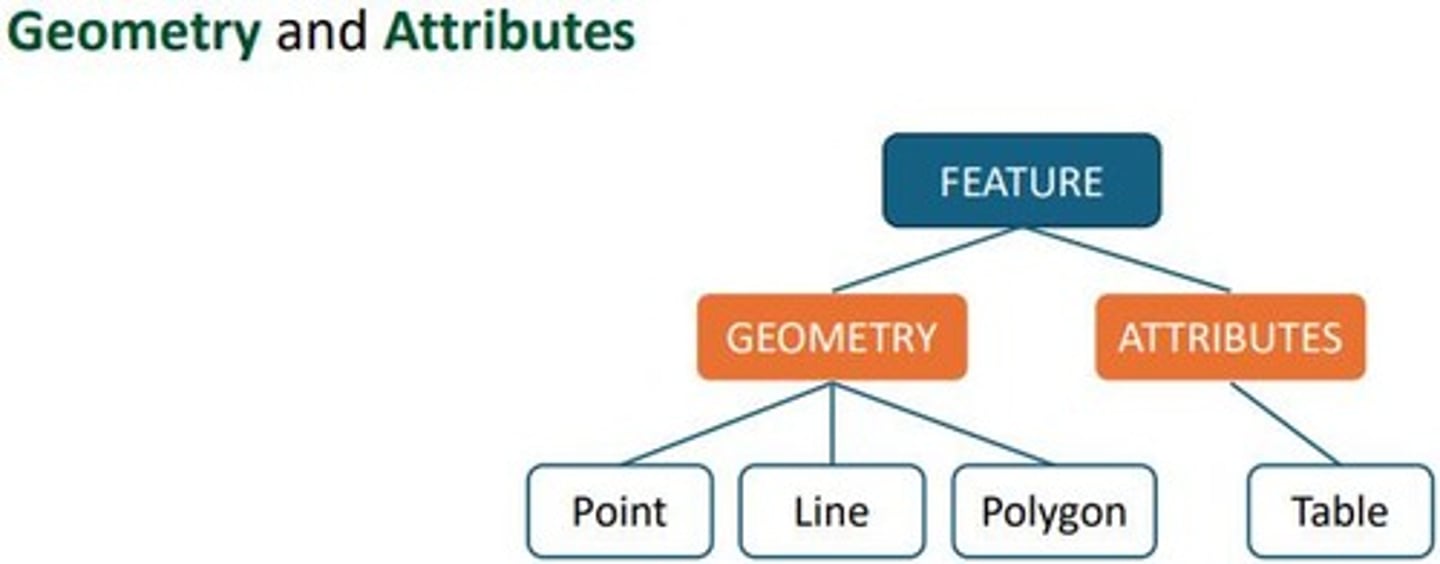
Geographic Information System (GIS)
computer system designed to capture, store, manipulate, analyze, manage, and present spatial data
Spatial data (geospatial data)
refers to items that are tied to a specific real-world location. It can also be defined as data that have a locational component
GIS 4 components
collection, storage, analysis, presentation
Methods of collecting GIS data
Directly collected: Field surveys of different kinds (photogrammetry and land surveying), GPS, weather and hydrologic stations, etc.
Remotely sensed: The location is distant from the data source (a sensor is used to collect the data): satellite images, LIDAR (Light detection and ranging), Radar, digital aerial photographs, etc.
Vector
Vector data model corresponds to object-based conceptual representation; discrete objects such as points, lines, and polygons
Raster
Raster data model corresponds to field-based conceptual representation; cell matrixes (arrayed in rows and columns) that store numeric values. Represent continuous fields: elevation, temperature, surface, air pollution, etc.
Types of Vector Models
Point: an (x, y) coordinate pair;
Line: a sequence of ordered coordinate pairs;
Polygon: a sequence of interconnected lines, and the first and last (x, y) coordinates are the same;
The spaghetti model stores individual objects separately as geometric entities
Advantages of Spaghetti Model
Easy to create, store, update and delete an object; Used in computer mapping systems
Disadvantages of Spaghetti Model
Does not explicitly record connections of line segments when they cross or meet; Duplication: objects are stored twice and therefore may not be same (gaps or overlap); Difficult to do analysis: which objects are adjacent? How objects are spatially related?
Types of Coordinate Systems
1. Geographic Coordinate Systems (GCS); 2. Projected Coordinate Systems (PCS)
Geographic Coordinate System (GCS)
Global reference system for determining the exact position of a point on Earth. The location (latitude and longitude) are called geographic coordinates.
Latitude
The measurement of distance north or south of the equator, expressed in degrees. Latitude ranges from 0° at the equator to 90° at the poles.
Longitude
The angular distance of a place east or west of the prime meridian, measured in degrees. Prime meridian (Greenwich, England) is 0°; east and west range from 0° to 180°.
Degrees, minutes, and seconds (DMS)
1 arc-degree = 60 arc-minutes; 1 arc-minute = 60 arc-seconds
Shape of earth
Earth is not a perfect sphere: the Earth is wider along the equator than between the poles
Geodesy
Science of accurately measuring and understanding geometric shape, gravity field, and the orientation in space of the Earth
Geoid
The hypothetical shape of the earth, coinciding with mean sea level and its imagined extension under land areas
Geodetic datum
mathematical model of the Earth, which serves as the reference or base for determining locations around the globe, given the fact that Earth is not perfectly round (more of an ellipsoid or spheroid)
Projection
a mathematical method used to represent the curved surface of the Earth onto a flat map
Projected Coordination System
projected coordinate systems are localized to minimize visual distortion in a particular region
Primary Data Capture
data captured by direct fieldwork measurement;
Primary raster data capture: satellite remote sensing, aerial photography;
Primary vector data capture: photogrammetry, land surveying, GPS, LiDAR
Secondary Data Capture
measuring data from other systems and media (digital and analog);
Data transfer: digital data input from other systems or data vendors;
Secondary vector data capture: digitizing
Spatial Resolution
The size of object that can be resolved by the sensor. The most usual measure is the pixel size. Higher spatial resolution means more detail (smaller cell size).
Land surveying
The horizontal coordinates (x,y) of a point can be calculated from the coordinates of the benchmark point and the measured distances and angle to the benchmark point.
Global Positioning System (GPS)
Satellite-based navigation system by the U.S. Department of Defense. GPS is one of the Global Navigation Satellite Systems.
LiDAR
An active remote sensing system that can be used to measure vegetation height across wide areas.
LASER
Light Amplification by Stimulated Emission of Radiation. A technology that produces a coherent beam of light through the process of optical amplification. It is commonly used in various applications, including surveying and remote sensing in GIS.
Domain data
Census, environmental, socio-economic, land use and land cover, hydrography, transportation, etc. Specific attributes related to a geographic feature, defining the nature of the data within a GIS.
Map scale
A fraction between distances on a map and the corresponding distances on the Earth's surface.
Census Data
An agency of the Department of Commerce that provides maps in support of the decennial (every 10 years) census of the United States.
FIPS
Federal Information Processing Standards. These are standards developed by the U.S. federal government for use in computer systems to ensure uniformity and compatibility. Each state has a two-digit code. Florida’s is 12.
Census Tracts
Small, relatively permanent subdivisions of a county or statistically equivalent entity.
Census Blocks
Subdivisions of a census tract.
Digitizing
The process by which coordinates from a map, image, or other sources are converted into a digital format in a GIS.
Vectorization
a pixel is converted to a point in Cartesian coordinate (X, Y), then points, lines, and polygons are extracted
On-screen digitizing
A process of manually digitizing on a computer screen with a digital image as a background
Heads-up digitizing
Also called on-screen digitizing. Heads-up digitizing is similar to manual digitizing in the way the lines have to be traced by hand, but it works directly on the computer screen using the scanned raster image as backdrop
Reference vs. Thematic Map
A reference map focuses on displaying the location and names of geographic features like boundaries and rivers, providing a general overview of a place, while a thematic map highlights a specific theme or data set, visualizing patterns and distributions across a geographic area, like population density or rainfall levels, to explain a particular phenomenon and convey specific information effectively.
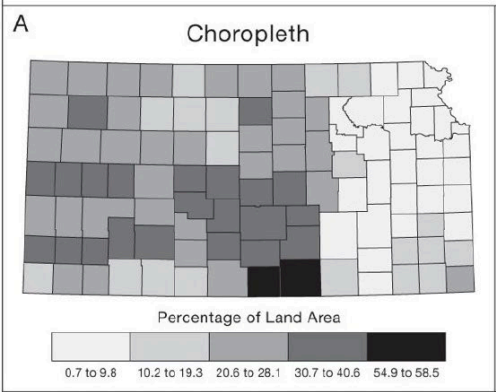
Choropleth Maps
Features are shaded or patterned in proportion to the quantitative value of the features. Simple choropleth maps: values are classified into classes.
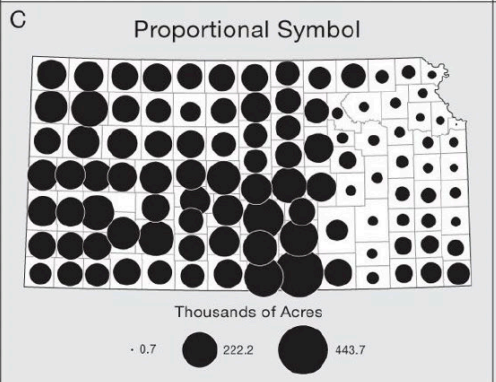
Proportional Symbol Map
Sizes in proportion to the magnitude of data occurring at point location.
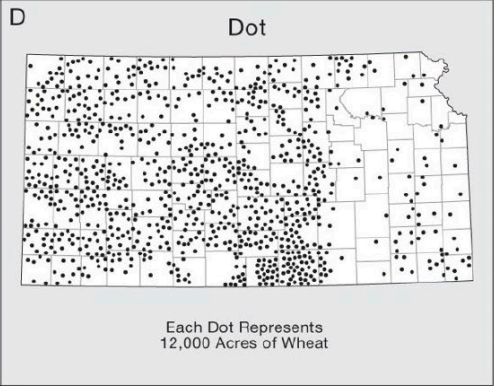
Dot Density Map
A single dot represents one or several occurrences, and dot locations are randomized.
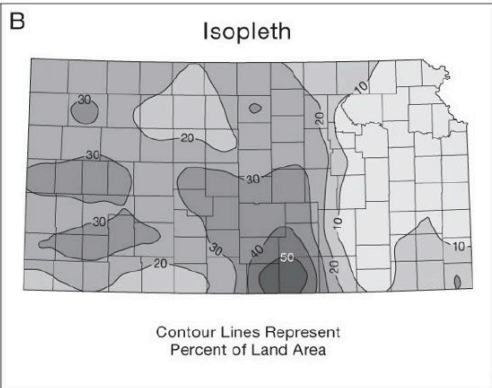
Isopleth Map
Also called contour maps, display lines of equal values
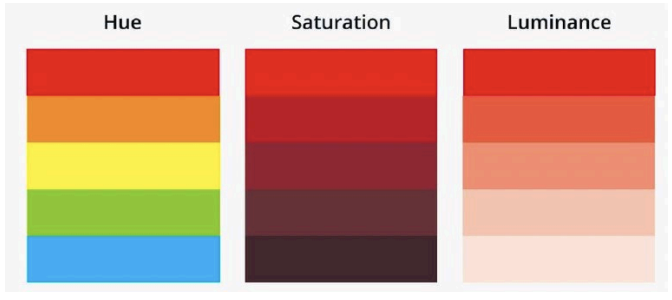
Parts of colors
Hue (color), Lightness (bright, dark, etc.), Saturation (purity of color)
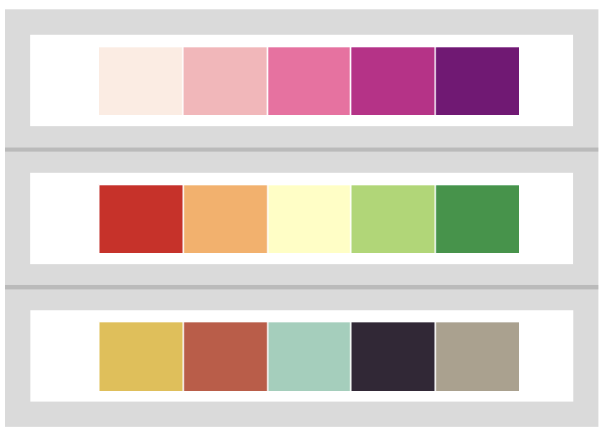
Types of color ramps
Sequential, Divergent, Qualitative (categories, non-ordered)
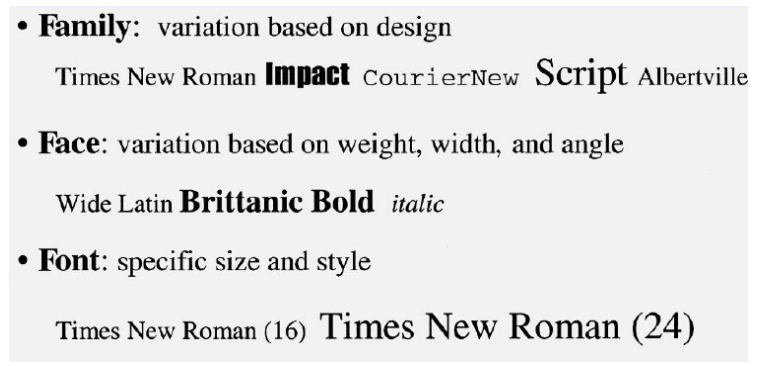
Typographical Characteristics
Family, face/style (variation in weight, width, and angle), and font (size)
Label placement
The placement should easily and clearly enable readers to associate labels with the features that they describe
Visual hierarchy
Symbols and map elements are ranked according to their relative importance
Visual contrast
Using visual variables to differentiate features and to imply their relative importance
Visual balance
The organization of map elements and empty space that results in visual harmony and equilibrium
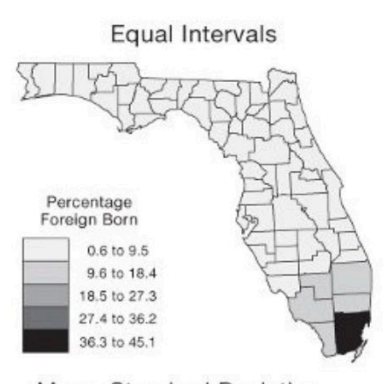
Equal Interval Classification
Take the value span of the data to represent and split it equally based on numerical values
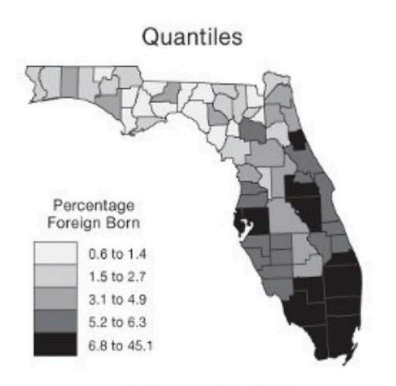
Quantiles Classification
Regardless of numerical values, split the distribution keeping the same amount of values in each class/bin
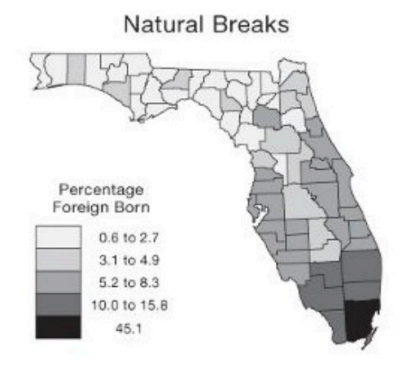
Natural Breaks Classification
To determine the best arrangement of values into different classes by seeking to minimize each class's average deviation from the class mean
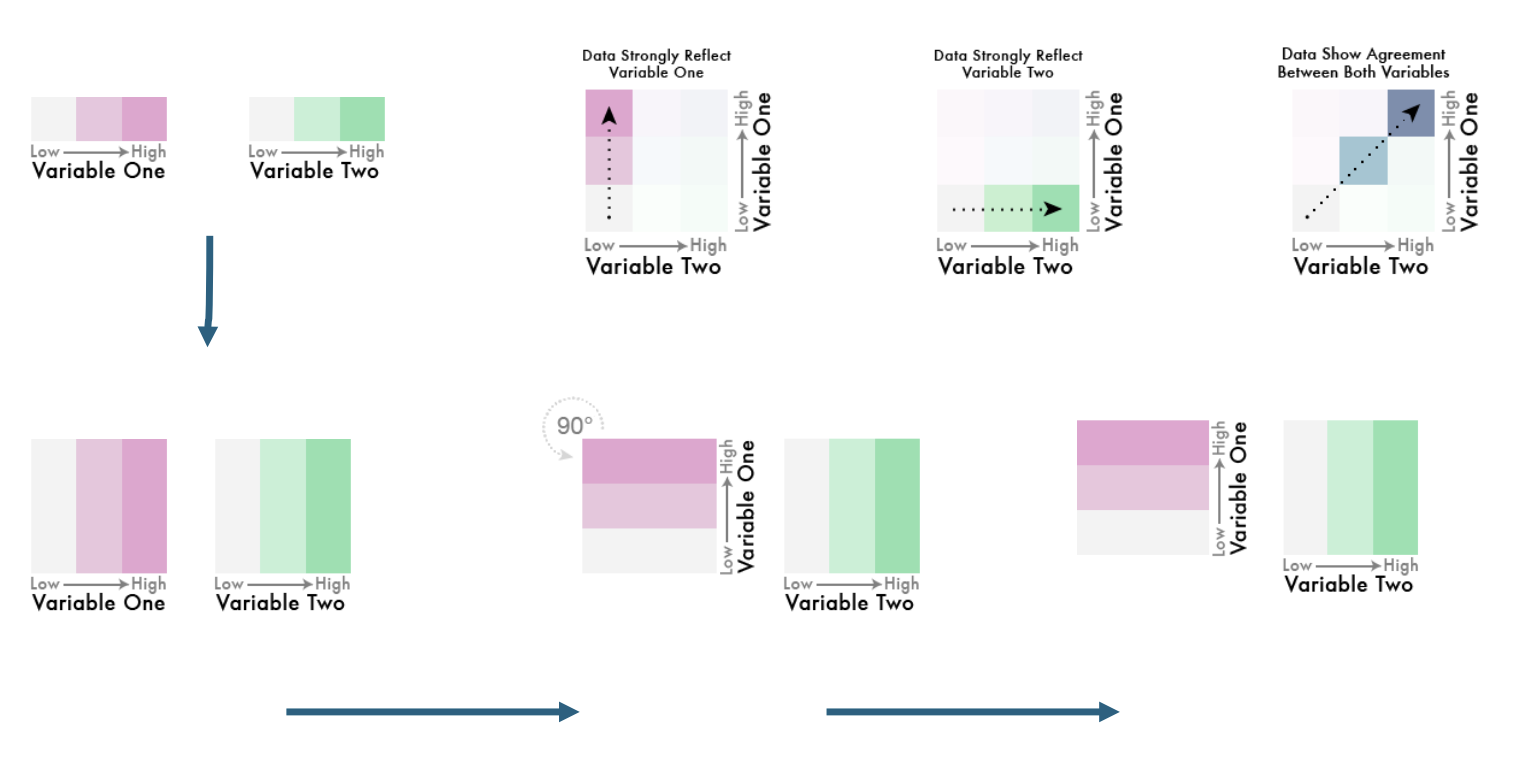
Bivariate Map
A map that shows the relationship between two variables by using colors and symbols to represent the data
Cartograms
Data maps where the variable is encoded, not by a color gradient, but by distorting the shape/size of the geographical objects.
Non-spatial data
Consists of descriptive information that does not have location-based qualities.
Attribute tables
Rows consist of individual objects. Columns are the attributes associated with these objects. These attribute tables are linked to a layer. Store attributes of map features. Have special fields for spatial information, like 'shape' that indicates the type of object (point, line, or polygon).
Stand-alone tables
Store any tabular data. Not associated with spatial data layer. It can have different formats like a CSV or an EXCEL table.
Attribute vs standalone table
Attribute tables are associated with a specific spatial layer and stand alone are not linked to any geographic data (just store tabular data)
Type of DBMS in GIS applications
The most common type of Database Management System (DBMS) used in GIS applications is the Relational DBMS, where data is organized in rows and columns, and stored in multiple tables. In a Relational DBMS relationships between tables are defined as needed. They are very flexible and ideal for queries.
Restrictions on field names
Restrictions based on characters: Start with a letter (a-z and A-Z), not a number or a special character. After the first letter, you can use numbers (0 to 9), underscores (_), and hyphens (-). Restrictions based on length: Limited to 10 characters for dBASE files. Restrictions based on words: Some keywords are not valid.
Field View
Field properties: Visible: show or hide a field. Read Only: whether a field is editable. Alias: set a descriptive name for the field. Data Type, Allow NULL, Domain, Default, Precision, Scale, etc.
Nominal/categorical data type
Descriptive information about the object. EX: name, title, phone number, sex. Descriptive information does not imply any order, size, or any other quantitative information (even if the data looks like a number).
Ordinal data type
Represents a ranking or order (descriptive text or numerical). EX: high/medium/low, first-year/sophomore/junior/senior.
Interval data type
A rank order and magnitude or scale with no fixed non-arbitrary natural zero (numeric). For example, Celsius scale, Fahrenheit scale, elevation, time (12-hour clock).
Ratio data type
A rank order and magnitude about a fixed non-arbitrary natural zero (numeric). For example, population total, crime rate, unemployment rate, weight, etc.
ArcGIS Pro Field Data Types
Numbers: Short, Long, Big, Float, Double. Text. Date and Time. BLOB: binary large objects, including documents, photos, etc.
Calculate Field
Calculates the values of a field for a feature class, feature layer, or raster. When used with a selected set of features, this tool will only update the selected records. Type of expression: by default it is Python. Except for the normal numerical operations, e.g., +, -, *, and /, you can also apply more complicated operations using built-in functions, e.g., math.Abs(), sum(), etc. String calculations: EX, !CITY_NAME!.capitalize(), !CITY_NAME!.rstrip(), !STATE_NAME!.replace('california', 'California').
Calculate Geometry
Adds information to a feature's attribute fields representing the spatial or geometric characteristics and location of each feature. This can include measurements such as area, perimeter, and length, which are essential for spatial analysis.
Join Table
In a Join, data from the source table (called Join Table in ArcGIS Pro) are appended to the destination table (called Input Table in ArcGIS Pro). A Join can be removed when it is no longer needed. The join is temporary: the join only happens in this project for now.
Join
The operation of combining two tables based on a related column between them.
Relate
Defines a relationship between two tables without appending associated data to the layer's attribute table.
Cardinality
How many records in one table match up to those in the other.
One-to-One
Every feature has exactly one related record in the other table.
One-to-Many
Features in one table may have more than one related record in the other table.
Many-to-One
Multiple features in one table have one related record in the other table.
Many-to-Many
Multiple features in one table have multiple records in the other table.
Inner Join
Only matched tuples are presented in the result, with attributes of the left-hand-side table appearing first.
Left Outer Join
The result of the inner join is computed, adding unmatched tuples from the left-hand-side table with null values for the right-hand-side attributes.
Right Outer Join
Symmetric to the left outer join, adding unmatched tuples from the right-hand-side table with null values for the left-hand-side attributes.
Spatial Join
Joining non-spatial data based on spatial information by comparing spatial relationships among objects from a source and target table.
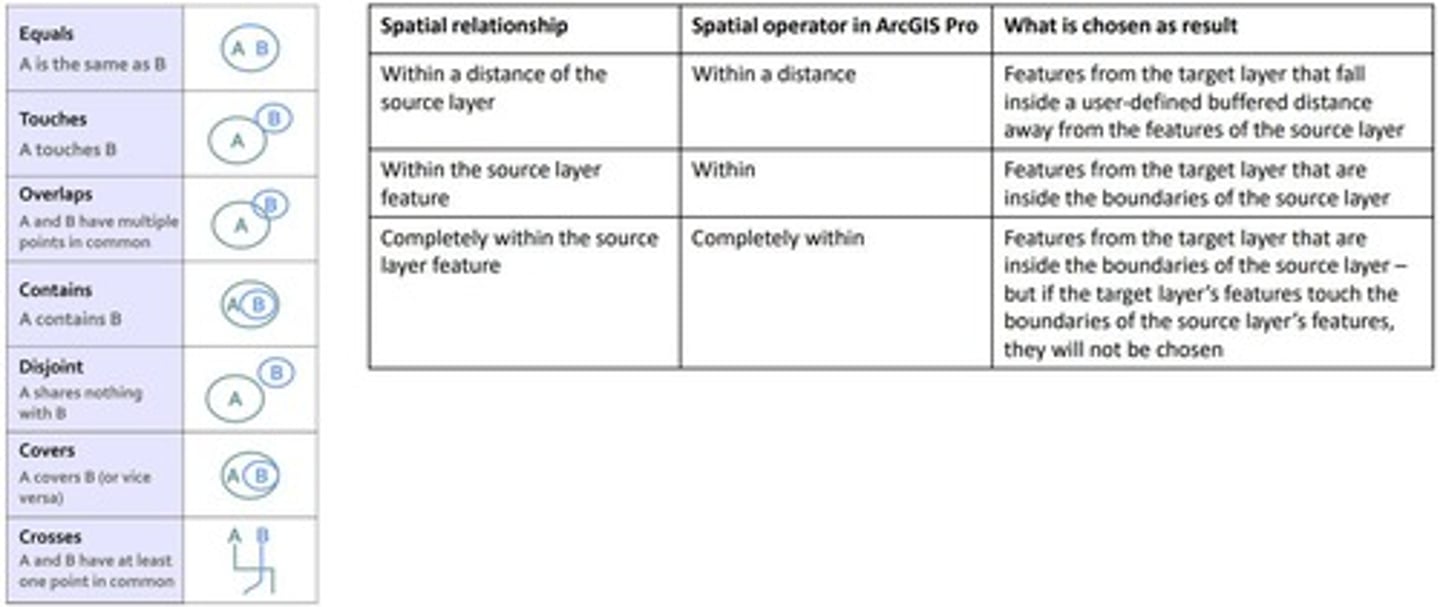
Spatial Relationships
Types of relationships that can exist between spatial objects, including intersect, within, within a distance, contains, boundary touches, and closest.
Spatial Analysis
Examining the spatial characteristics of features and how they relate to one another considering their spatial locations or proximity.
Source Layer
The layer that serves as the starting point for a spatial analysis operation.
Target Layer
The layer that contains the features that will be examined in the result of a spatial analysis operation.
Spatial Data Manipulation
The application of operations to coordinates and related attribute data, including selection, classification, buffering, overlay, and transformation.
Statistical Spatial Analysis
Involves identifying patterns such as hot spot analysis and spatial autocorrelation.
Spatial Relationships Examples
Intersect, Within, Within a distance, Contains, Boundary touches, Closest.
Measurement
Simple numerical values that describe aspects of geographic data, including Distance, Perimeter, and Area.
Query
The most basic of analysis operations in GIS used to answer simple questions posed by the user without producing new data.
Extraction
The process of isolating specific areas of data for further processing or analysis, resulting in the creation of new data layers.
Classification
The procedure of identifying a set of features as belonging to a group by defining and recognizing patterns.
Topology
The arrangement that defines how point/line/polygon features share coincident geometry, useful for detecting and correcting digitizing errors.
Proximity Computation
The use of geometric distance to define the neighborhood of one or more target locations.
Network & Network Analysis
Simple choropleth maps: values are classified into classes. The process of solving problems involving interconnected elements to save time and money.
Select by Location
A spatial query that selects records from a layer based on their spatial relationships with objects in other layers.
Geoprocessing
A process of taking action on a dataset that results in a new dataset being created.
Merge
Combines two or more layers into a single layer, only allowing features of the same type to be merged.
Dissolve
Aggregates features based on a specified attribute or attributes.
Clip
Extracts features from one layer based on the geometry of a second layer, using the clip layer as a 'cookie cutter.'
Split
Splits an input with overlaying features to create a subset of output feature classes.