Exam II
1/85
Earn XP
Description and Tags
Conservation Law, Restoration, Conservation Genetics, Structured Decision Making
Name | Mastery | Learn | Test | Matching | Spaced |
|---|
No study sessions yet.
86 Terms
Evolution of conservation law in the U.S.
Conservation laws in the U.S. are influenced by several very different philosophies
Preservation
preserving wildness for the sake of the wildness
Dates for Preservation:
1854
1870’s
1872
1892
1854: Henry David Thoreau publishes Walden, which describes a deep appreciation for living with nature
1870’s: John muir begins publishing essays on “oneness with the earth” and the spiritual purity of nature
1872: Yellowstone National Park becomes the first National Park
1892: Sierra Club is formed
John Muir
Believed indigenous people were “primitives” obstructing the nation’s destiny. Leading to the removal and killing of native peoples in Yellowstone and Glacier National Parks.
Conservation
intelligent use of natural resources to sustain yield of resources for future generations
Dates for Conservation:
1887
1891
1901-1909
1905
1887: The first North American conservation organization is formed, the Boone and Crocket Club
1891: The Yellowstone Timberland Reserve (now the Shoshone National Forest) becomes the first “National Forest”
1901-1909: Pres. Theodore Roosevelt ushers in a “new conservationism”
1905: Pres. Roosevelt creates the United States Forest Service
Early conservationists
Believed that indigenous people impeded the progress of the nation and forcibly removed and killed Native Americans
Environmentalism
human health is dependent on a healthy environment and natural resources
Dates of Environmentalism:
1945
1954
1962
1945: Bombing of Hiroshima and Nagasaki brings public awareness to the dangers of radiation
1954: Hydrogen bomb testing on Bikini Atoll reveals the extreme toxicity of radioactive fallout
1962: Rachel Carson publishes Silent Spring on the dangers of DDT
Major developments in the 1960’s-1980’s (mostly out of the Environmental movement)
1964: Pres. Lyndon B. Johnson signs the Wilderness Act, which creates the National Wildlife Refuge system
1970: Clean Air Act
1972: Water Pollution Control Act — amended in 1977 to become the Clean Water Act
1973: Endangered Species Act
1974: Safe Drinking Water Act
1976: Resource Conservation and Recovery Act
1980: Superfund Act
National Park System (P, C, or E)
Preservationist
National Forest Service (P, C, or E)
Conservationist
Clean Air Act (P, C, or E)
Environmental
Clean Water Act (P, C, or E)
Environmental
National Wildlife Refuges (P, C, or E)
Preservationist/Conservationist
National Marine Sanctuaries (for fishing) (P, C, or E)
Conservationist (some preservationist)
Endangered Species Act (P, C, or E)
Environmental
State Park (P, C, or E)
Preservationist
Wildlife Management Area (P, C, or E)
Conservationist
National Monument (P, C, or E)
Preservationist
What other types of legislation can protect biodiversity
import/export laws
laws that encourage land management
What threatens biodiversity?
Habitat loss/fragmentation → pollution
overexploitation
introduced species
The Endangered Species Act (ESA) 1973
The main function is to identify and protect species that are threatened with extinction
What does the ESA do?
Government agencies must consult with the USFWS or NOAA on any activity that might affect listed species
Prevents “take” of listed species on private land, trade in listed species, and damage to their habitats
Requires agencies to develop recovery plans for listed species
Recovery plans need to include explicit recovery goals (e.g., the population size at which the species can be removed from the list), as well as devising a strategy for achieving recovery
Criticisms of the ESA
It costs too much
loss of income from land that is protected
direct cost of recovering species → millions of dollars
It limits growth
Interferes with landowner rights
Cannot help all species
National Environmental Policy Act (1970)
The main function is to promote the enhancement of the human environment. It required federal agencies to assess the environmental effects of their proposed actions prior to making decisions.
NEPA
Requires federal agencies to produce an environmental impact system for any actions likely to have significant effects on the environment.
Can be VERY long (thousands of pages)
Must be completed BEFORE the project starts
Must have public comment
If the agency isn’t sure if an action will have significant environmental effects they can conduct an environmental assessment to determine if it will.
What is restoration?
The process of intentionally altering a site to establish a defined, indigenous, historic ecosystem. The goal of this process is to emulate the structure, function, diversity and dynamics of the specific ecosystem."
Why do we restore?
Make the ecosystem like it once was
Reduce or remove the need for active management
Improve sustainability
Improve ecological integrity
Imrpove ecological resilience
Approaches to restoration
Don’t do anything
Reclamation
Rehabilitation
Partial restoration
Complete restoration
Don’t do anything
e.g., allowing a grassland to become a forest, or a secondary forest, or a secondary to become an old-growth forest
Reclamation
alleviating problems to increase the productivity, biodiversity, and ecosystem functionality of land, even if the resulting ecosystem is very different from the historic ecosystem
typically done following severe degradation (e.g., strip mining, landfill, bulldozing)
non-native vegetation may be planted when non-native plant communities are better than no plant community
Rehabilitation
a step from reclamation, this process makes an attempt to restore the historic ecosystem but is severely limited often due to logistics/feasibility
Partial restoration
restoration of some but not all of the historic ecosystem
most common
Complete restoration
total restoration of the historic ecosystem
very difficult
Steps for restoration — part 1
Assess a need for action
inventory and describe
do we need a clean-up? or restoration?
Identify and prioritize goals and objectives
Conduct an experiment!
Steps for restoration — part 2
Assess a need for action
inventory and describe
do we need a clean-up? or restoration?
Identify and prioritize goals and objectives
Conduct an experiment!
Following analysis of results, commence adaptive management
Inner learning loop 1
small changes to strategies and plans are made in response to learning in between major plannings reviewsI
Inner learning loop 2
Aspects of monitoring are refined in between planning reviews
Inner learning loop 3
Aspects of implementation are refined in between planning reviews in response to monitoring
Outer learning cycle
Long-term goals, plans, and action are reviewed and modified in response to learnings
Scale is a major limitation restoration
most restoration efforts are small and site-specific
many restoration needs are broad and long-term
Multi-pronged appraoch to conservation
Nature reserves (with varying levels of use) that have been restored or maintained at a suitable level of “wildness”, following by adaptive management
sustainable use of human-occupied land, often involving some degree of restoration then adaptive management
What does sustainable use of human-occupied land look like?
Working with communities and individual landowners to develop more sustainable approaches to balance human life and ecosystem health
Examples of human-occupied land
fish ladders on dams
devices to limit bycatch on boats
green/blue spaces in urban centers
night lighting regulations
agriculture
wetlands and prairies are often targeted bc of their rich soil and apparent “worthlessness” for humans
Example of agriculture & conservation
shade grown money
“Sharing” land between agriculture and conservation creates tradeoffs
using less chemicals, or modifying agriculture to meet the needs of wildlife often results in a reduction in yield (at least in the short-term)
e.g., shade coffee: yield is lower with less sun
with a growing human population, can we afford to decrease yield?
Land sharing
modify methods to benefit wildlife
typically, incentive (payment, tax benefit) programs are created to encourage farmers to take this approach
this approach basically amounts to paying farmers to farm inefficiently
Land sparing
farm as intensively as possible on less land
in theory this would allow more land to be set aside for biodiversity
to date, most studies suggest that land sparing is the better approach
BUT sparing only works if land is truly protected and not just used for more agriculture or urbanization
land sharing vs. land sparing
Both approaches could be used in tandem if we can identify ways to increase wildlife use of farmland that does not reduce crop yield
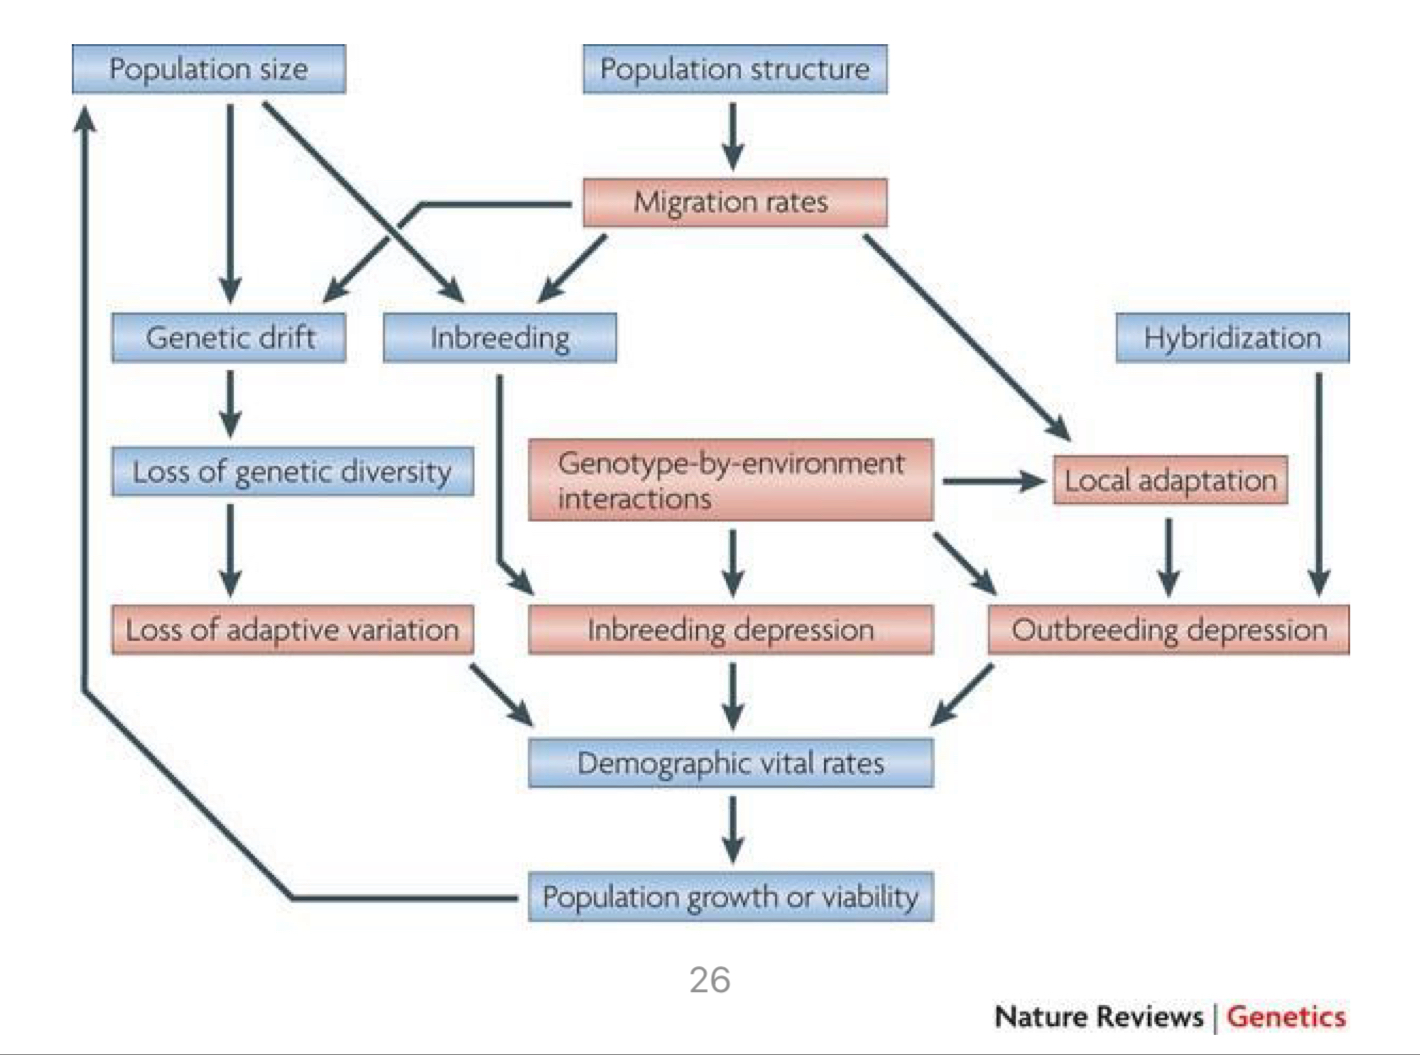
Conservation Genetics
a combination of ecology, molecular biology, mathematical modeling and evolutionary taxonomy
using genetic theory and techniques to reduce the risk of extinction
Genetic problems are more likely in small populations. WHY?
low genetic variation → inbreeding
Inbreeding
in small populations, individuals are more likely to be related and mate with close relatives
(causes inbreeding depression and decreased adaptive potential)
Inbreeding depression
reduced fitness of offspring
increased probability that offspring will be homozygous for a deleterious recessive gene
Adaptive potential
reduced genetic (and thus phenotypic) variation for selection to act upon
this is especially important given the current fast pace of environmental changes
homozygous
having two copies of the same allele for a gene
heterozygous
having two different alleles of a gene
genetic drift
a random (neutral) process that leads to changes in the genetic makeup of a population
DIFFERENT from natural selection
has a stronger effect on small populations, causing a loss of genetic variation
Negative effects of genetic drift
decreases adaptive potential by eroding genetic variation
increases relatedness, which can increase the risk of inbreeding depression
Why is genetic drift stronger in small populations?
In small populations, only a few individuals carry a single allele, increasing the likelihood that the allele will be lost over each generation
Heterozygosity
the probability that an individual will be heterozygous for a given gene/locus
heterozygosity example
H > 0.85
you have a > 85% chance of being a heterozygote
What can heterozygosity tell us?
indicator for population genetic variability
high heterozygosity = a lot of genetic variability
heterozygosity can also tell us about the structure and history of a population
if the observed heterozygosity is lower than expected, it could be due to historic inbreeding (or maybe bottleneck)
if heterozygosity is higher than expected, two previously isolated population may have mixed recently
Census population size (N)
the actual population size observed by counting
Effective population size (Ne)
a theoretical measure of how many individuals are contributing their genes to the next generation* sexual
What factors might cause Ne to be smaller than N?
sexual selection (not everyone might reproduce) — some get more matings
sex ration skew (may have 50 males but only 2 females)
environmental conditions to cause skipping of breeding events
age structure of population (more very old or young who can’t reproduce)
fluctuations in population size
Effective population size (Ne) is intimately tied to heterozygosity
The change in heterozygosity between generations due to drift can be determined using this formula:
Ht+1 = [1-(1/(2Ne))] * Ht
Ht+1 = [1-(1/(2Ne))] * Ht
Ht = heterozygosity in the current time
Ht+1 = heterozygosity in the next (t+1) generation
Ne = effective population size
Heterozygosity calculation example:
Let’s assume initial heterozygosity of 0.85 (human estimate), and an effective population size of 5
= [1-(1/2×5)]*0.85 = 0.765
Heterozygosity calculation example p2:
Next, let’s assume the same initial heterozygosity (0.85), but an effective population size of 5000
= [1-(1/2×5000)]*0.85 = 0.849915
Heterozygosity calculation example p3:
How about an effective population size of 500,000?
= [1-(1/2×500000)]*0.85 = 0.84999915
Notes about heterozygosity
(1-1/(2Ne)) must always be less than one (bc Ne is always positive, so you will always subtract a positive number from 1)
So, heterozygosity will always decline due to drift
Does genetic variation always decline?
NO!! If drift is the only process affecting genetic variation, then there will always be a decline, but other processes also other.
What evolutionary processes could increase genetic variation?
natural selection
mutations
migrations (easiest to manipulate)
Other processes that increase genetic variation in a population
mutation and immigration
mutation
mutation rate is relatively low
in large populations, the mutation rate can counterbalance the very small losses due to drift
immigration
even relatively low rates of immigration (1 or 2 individuals per generation) can be enough to counter the effects of drift
So how big do populations need to be?
how would we answer this?
real population studies and statistical modeling (MVP/PVA)
Data from real populations for minimum population sizes
Studies of real populations suggest at least a few hundred individuals, but it probably depends on the species
some species can last for a long time with very small populations
in most cases, at least a few 100 individuals are needed for a population to last > 100 years
but there are not many long-term data sets. so these estimates may not be very good
MVP
a minimal viable population, the smallest population having a 99% chance of remaining extant for 1000 years
any thorough assessment of population viability or MVP needs to consider each of these things — a target population size should be one that is large enough to withstand the worst conditions
Difference sources population vulnerability
demographic
environmental
genetic stochasticity
natural catastrophes
Minimum viable population size rule of thumb
estimates based on minimum viable population analyses led to the “50/500 rule”
Ne of 50 needed for short-term avoidance of inbreeding
Ne of 500 needed for long-term avoidance of negative effects of drift
Widely misinterpreted (not used as much)
Ne was assumed to equal census population
Focused on 50 not 500
Population Viability Analysis estimates (statistical model)
estimates based on population viability analysis
one vertebrate study found that the mean minimum viable population size was about 7300 adults, while the median was about 5800 adults
the minimum population size was larger for species that have been studied for a long time, probably because long term studies do a better job of describing variability
this suggests that estimates based on short-term studies are probably underestimates of the true minimum viable population
Minimum population size — summary
Each of these techniques yielded different estimates (a couple hundred, 500, ~7000)
Overall, studies suggest we need at least several 100, and perhaps several 1000 individuals. But there’s a lot of variation between species/populations
with no other information, this rule of thumb might be an OK starting point
but it would be much better to collect the data needed to investigate the species’ individuals case
summary
It is valuable to view management as an experiment (questions)
a) What are the management goals/objectives?
b) What are possible management actions?
c) What are the consequences of those actions?