Exploring One-Variable Data - Unit 1 Test
1/16
Earn XP
Description and Tags
AP Statistics 2024
Name | Mastery | Learn | Test | Matching | Spaced | Call with Kai |
|---|
No study sessions yet.
17 Terms
What two variables are there?
Categorical and Quantitative.
What would be considered Categorical?
Places individuals in categories + Can not find the average.
What would be considered Quantitative?
Numerical values + Makes sense to find the average.
What graphs are considered categorical variables?
Two-Way Table
Pie Chart
Bar Graph
Segmented
Side-by-side
What graphs are considered quantitative variables?
Histogram
Stemplot
Back-to-Back Stemplot
Boxplot
Dotplot
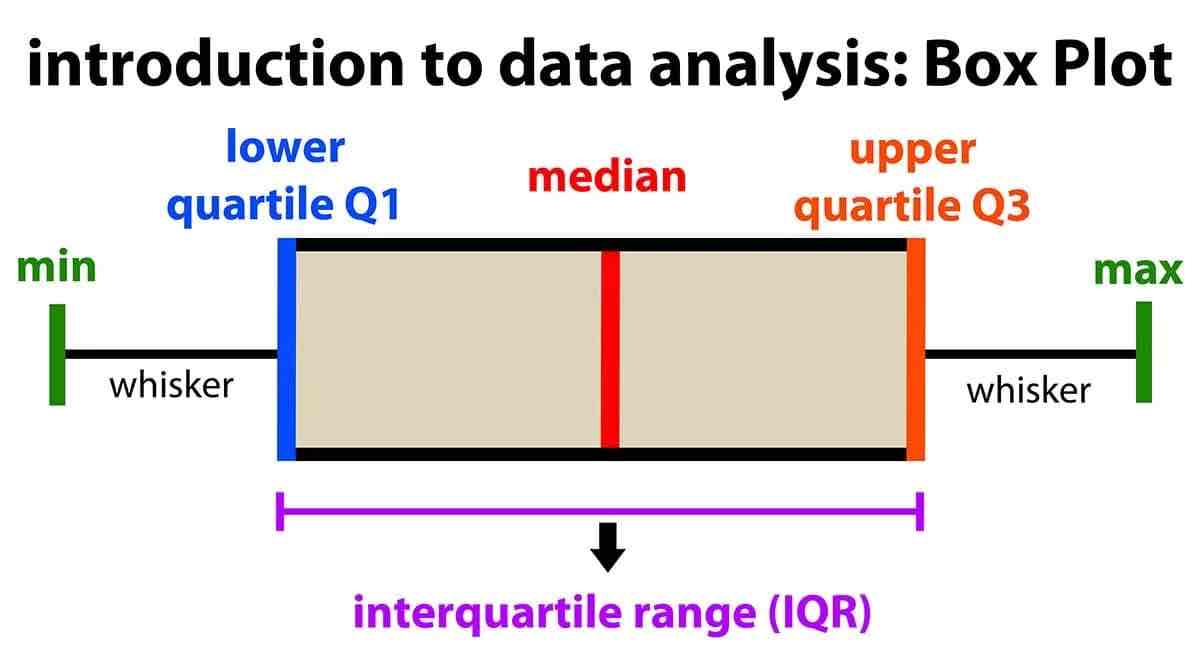
Boxplot
IQR (middle 50% of data)
25% of data between each pair of numbers
Outlier
Min
Lower Quartile Q1
Median
Upper Quartile Q3
Max
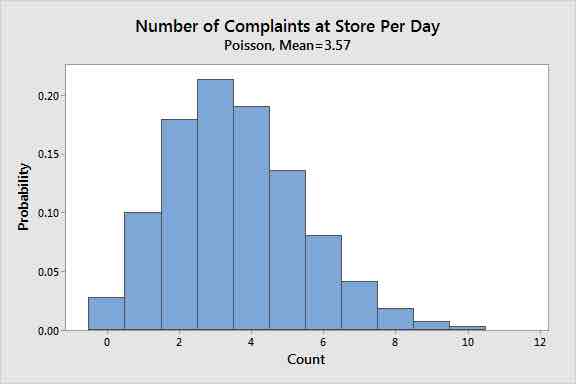
Unimodal
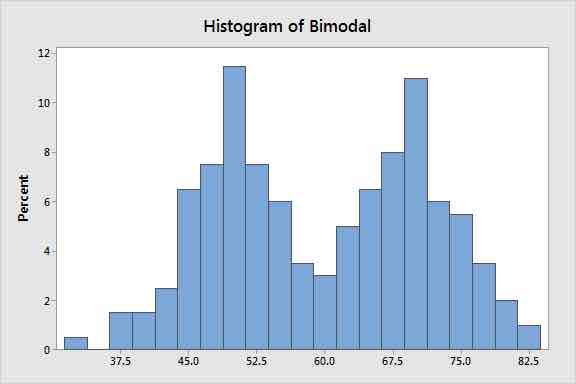
Bimodal
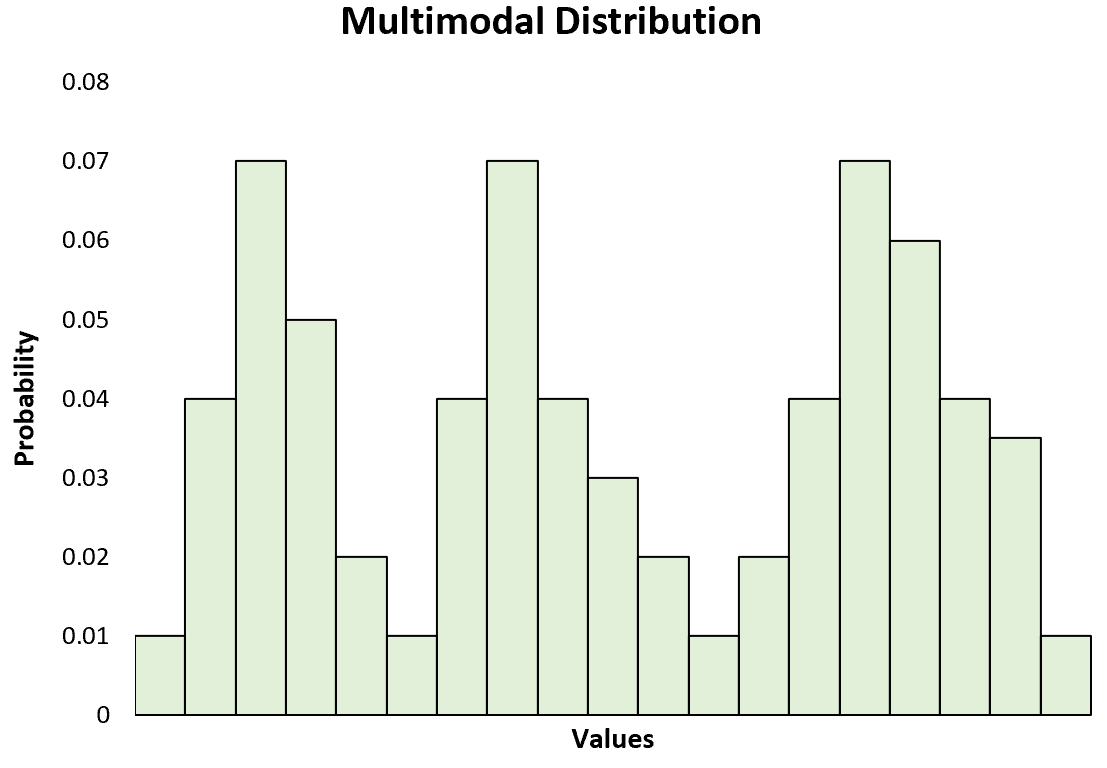
Multimodal
Two-Way Tables
Frequency = Count
Relative Frequency = %
Conditional Distribution : A/B
Marginal Distribution : B/C
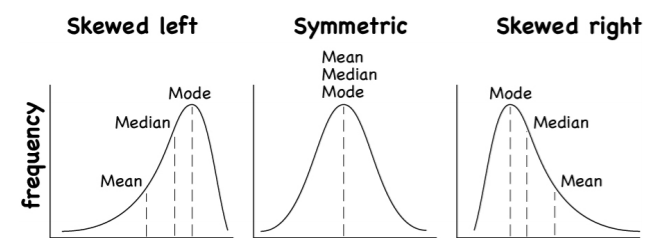
Measures of Center
Skewed Left
Symmetric
Skewed Right
MEDIAN IS RESISTANT… MEAN IS NOT
—> Mean is “pulled” by a tail MORE THAN the median.
Transforming Data
Add/Subtract:
Only Measures of Center
Multiply/Divide:
Measures of Center & Measures of Spread
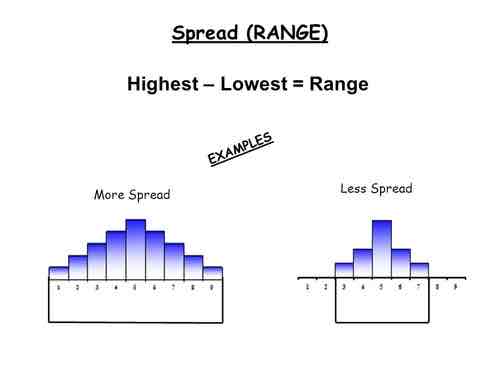
Measures of Spread (a.k.a. Variability) - More & Less Spread
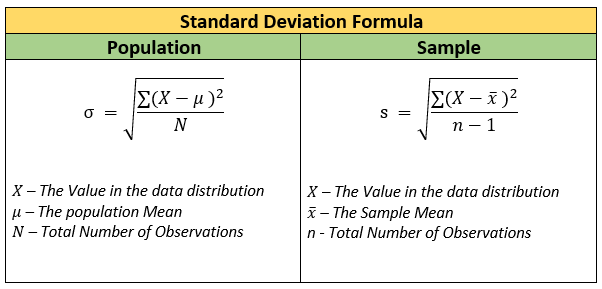
Measures of Spread (a.k.a. Variability) - Standard Deviation
Average distance from the mean.
Measures of Spread (a.k.a. Variability) - Interquartile Range (IQR)
IQR = Q3 - Q1
Middle 50% of data
Measures of Spread (a.k.a. Variability) - Variance % Standard D.
Variance = (St. Dev)²
St. Dev = square root Variance
IQR IS RESISTANT…STANDARD DEVIATION IS NOT.