Microbio: Module 5: Bacterial & Archael Growth
 Call Kai
 Learn
Learn Practice Test
 Spaced Repetition
 Match
Match Flashcards
 Knowt Play
1/73

There's no tags or description
Looks like no tags are added yet.
Name | Mastery | Learn | Test | Matching | Spaced | Call with Kai | Chat |
|---|
No analytics yet
Send a link to your students to track their progress
74 Terms
7.1 Most Bacteria and Archaea Reproduce by Binary Fission
Reproductive Strategies of Bacteria and Archaea
• Most bacterial and archaeal cells reproduce by binary fission.
• Some bacteria reproduce by forming a bud or multiple fission.
• All must replicate and segregate the genome prior to division

t/f bacteria only reproduce by method of binary fission
false
7.2 Bacterial Cell Cycles Are Divided into Three Phases
Bacterial Cell Cycle
The cell cycle is the complete sequence of events extending
from formation of a new cell through the next cell division.
Three phases:
• Period of growth after the cell is born.
• Chromosome replication and partitioning.
• Cytokinesis, during which a septum and daughter cells are
formed
7.2 Bacterial Cell Cycles Are Divided into Three Phases
Chromosome Replication and Partitioning
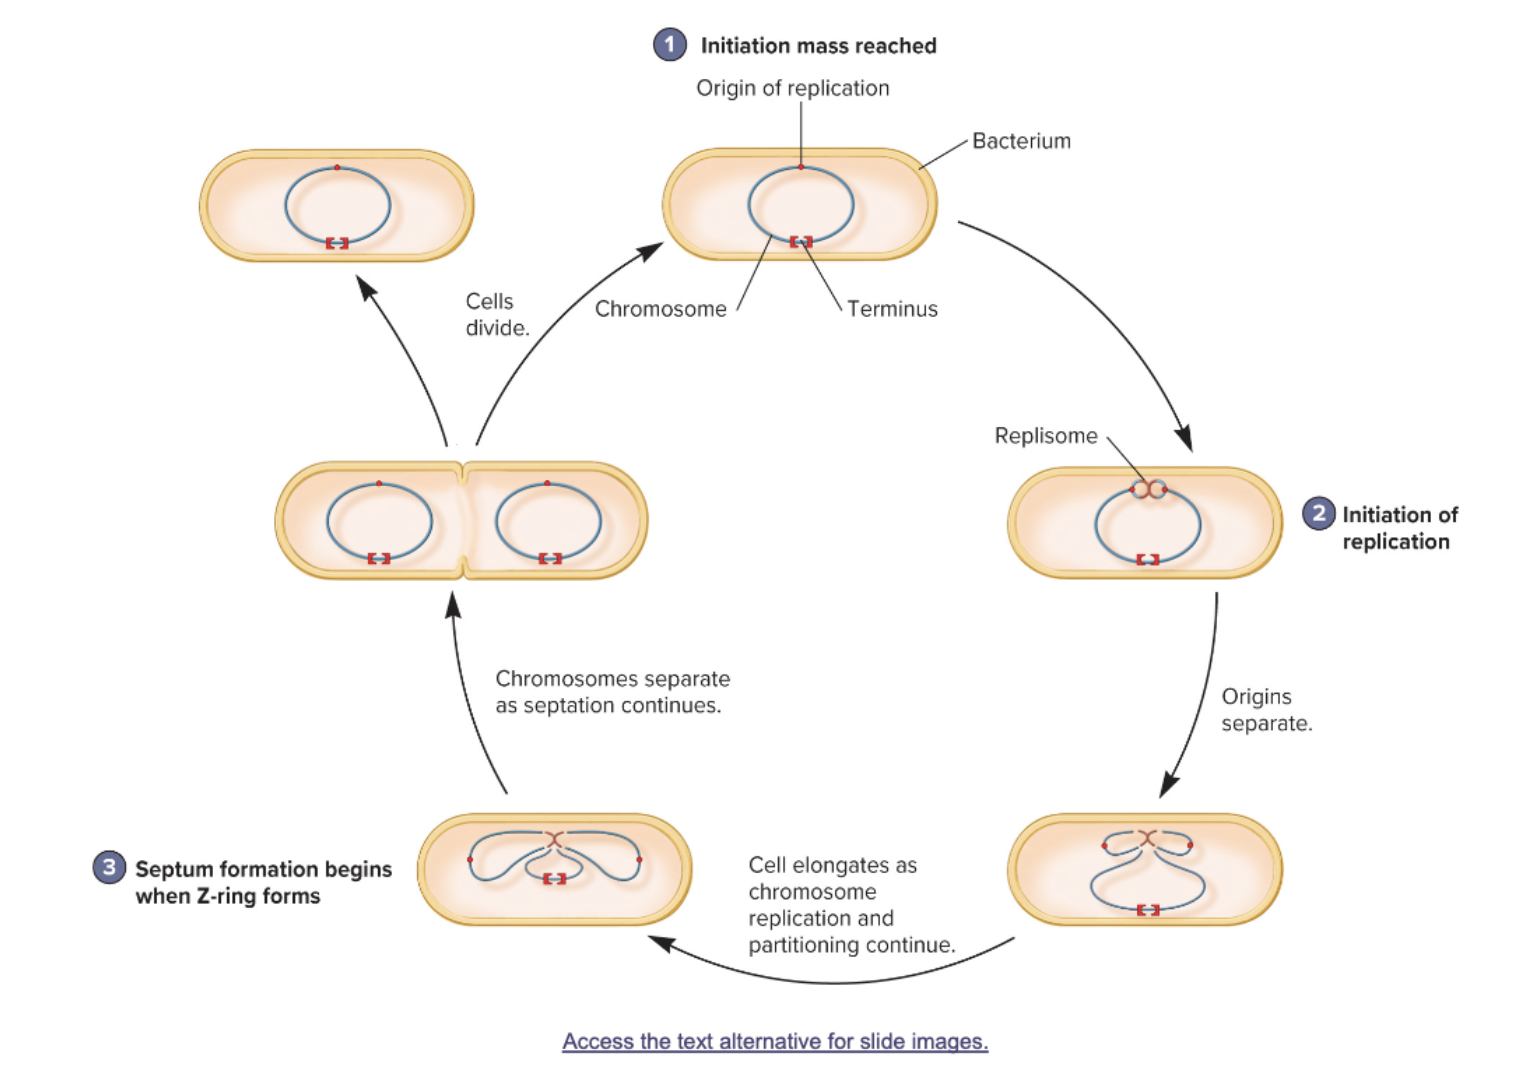
• Most bacterial have a single circular chromosome.
• Single origin of replication—site at which replication begins.
• Terminus—site at which replication is terminated, located opposite of the origin.
• Replisome—DNA synthesis machinery.
• DNA replication proceeds in both directions from the
origin.
• Origins move to opposite ends of the cell, and the rest of
each chromosome follows.
7.2 Bacterial Cell Cycles Are Divided into Three Phases
Cell Cycle of E. coli
7.2 Bacterial Cell Cycles Are Divided into Three Phases
Partitioning System
Three components:
• ParA protein
• ParB protein
• parS region on chromosome

7.2 Bacterial Cell Cycles Are Divided into Three Phases
Chromosome Partitioning—An Example
C. crescentus
parS sites are close together near origin of replication.
Being early in duplication, it directs the segregation of the two daughter chromosomes.
ParB proteins bind the parS site and nearby.
One partition complex remains at the stalk pole, whereas other is guided by ParA to opposite pole.
Similar to a baton being passed in relay.

7.2 Bacterial Cell Cycles Are Divided into Three Phases
Cytokinesis and Septation
Cytokinesis—formation of two daughter cells following cell
division.
Septation—formation of cross wall between two daughter
cells.
Septation steps:
• Selection of site for septum formation.
• Assembly of Z-ring (composed of protein FtsZ).
• Assembly of cell wall-synthesizing machinery.
• Constriction of cell and septum formation.
7.2 Bacterial Cell Cycles Are Divided into Three Phases
Z-Ring Formation
FtsZ protein
• Involved in assembly of Z-ring.
• Early, FtsZ filaments are heterogeneous in size and widely distributed around the plasma membrane.
• Min system keeps oscillating between left and right pole without allowing FtsZ at the poles.
• First protein to localize to the future division site.
• FtsZ monomers polymerize.
• Localize with Min system to establish division site at midcell.

7.2 Bacterial Cell Cycles Are Divided into Three Phases
Importance of Z-Ring Timing
Location of FtsZ polymerization must coordinate with timing.
• Too early, Z-ring could constrict preventing proper partitioning.
Nucleoid occlusion
Coordinates chromosome movement and cell separation.
SlmA coats chromosome except at the replication termination region.
Z-ring can form when SlmA-tagged chromosome has moved away.

7.2 Bacterial Cell Cycles Are Divided into Three Phases
Nucleoid occlusion
Nucleoid occlusion is a crucial bacterial defense mechanism that stops cell division (cytokinesis) fr happening over the chromosome (nucleoid), preventing its breakage and ensuring proper cell division.
It works through DNA-binding proteins like Noc or SlmA that bind to specific sites on the DNA, preventing the formation of Z-ring (the division machinery) in that area.
This ensures the septum forms at the correct mid-cell location, coordinating cell division with chromosome replication and segregation for faithful inheritance of the genome.
How it works:
Inhibition of Z-ring assembly:
Proteins like SlmA (in E. coli) or Noc (in B. subtilis) bind to specific DNA sequences on nucleoid.
Physical blocking:
These bound proteins physically interfere with the assembly of FtsZ, the key protein that forms the Z-ring, preventing it from forming over the DNA.
Temporal and spatial regulation:
By marking the nucleoid, these proteins act as spatial and temporal regulators, ensuring the septum forms away from the DNA, often at mid-cell once replication is complete.
Coordination with replication:
This mechanism links cell division to the cell cycle, preventing division until the chromosome is properly replicated and segregated, thus avoiding catastrophic chromosome breakage
7.2 Bacterial Cell Cycles Are Divided into Three Phases
Divisome Formation
Divisome formation is a two-stage process in bacteria (in E. coli) where a protein complex assembles at the mid-cell to mediate cell division (septation).
It begins with the formation of the Z-ring (FtsZ) at the membrane, followed by the recruitment of division proteins (FtsA, ZipA, FtsQLB, FtsW, FtsI, FtsN) that synthesize the septum.
Key Stages and Compoents of Divisome Formation:
Stage 1: Z-ring Assembly: The tubulin-like protein FtsZ polymerizes into a ring structure (Z-ring) at the future site of division, tethered to the inner membrane by FtsA and ZipA.
Stage 2: Divisome Maturation & Recruitment: Early proteins (FtsZ, FtsA, ZipA) recruit late proteins, including the FtsQLB complex, FtsW (transglycosylase), FtsI (transpeptidase), and finally FtsN. FtsN triggers the activation of septal peptidoglycan synthesis.
Function: The divisome acts as a "machine" that synthesizes new cell
wall and membrane material, constricting the cell into two daughter cells
7.2 Bacterial Cell Cycles Are Divided into Three Phases
Peptidoglycan Synthesis Critical in Determination of Shape
Peptidoglycan synthesis scheme:
• NAG-NAM-pentapeptide synthesized.
• MurJ flips the carrier-bound building block across membrane.
• NAG-NAM inserted into peptidoglycan strand.

7.2 Bacterial Cell Cycles Are Divided into Three Phases
Cell Shape Determination
Cellular location of peptidoglycan synthesis plays role in determining cell shape.
Coccus
Peptidoglycan only forms at central septum.
FtsZ localization placement involved.

7.2 Bacterial Cell Cycles Are Divided into Three Phases
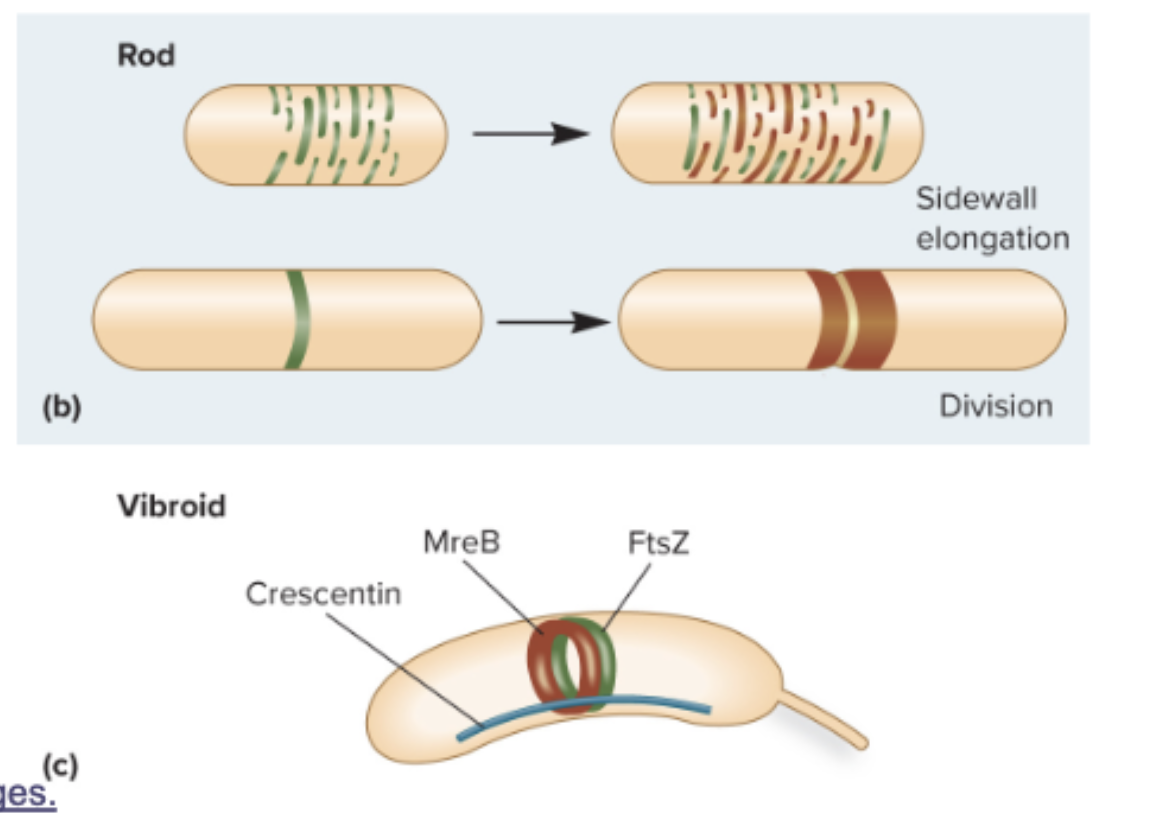
Rod and Curved Cell Shape
Rod
Elongasome (rod complex)
MreB is scaffold, by creating filaments along cytoplasmic face of plasma membrane.
Growth occurs in numerous bands around cell, not at the poles.
Curved
Crescentin localizes to one side of the cell, resulting in asymmetric cell wall and vibroid shape
7.3 Archaeal Cell Cycles Are Unique
Archaeal Cell Cycles Resemble Eukaryal Cell Cycles –Except in Segregation of Chromosomes
Studies in Sulfolobus spp. indicate a cycle similar to a mitotic cycle.
Growth phase (G1) followed by DNA replication (S phase), then G2 phase, segregation of chromosomes, and cytokinesis.
Segregation occurs via use of SegA/SegB protein system that is similar to bacterial partitioning systems.
SegA similar in structure and function to ParA.
SegB is unique to archaea, but thought to function similarly to ParB.
DNA sequences similar to parS have yet to be found in archaea.
7.3 Archaeal Cell Cycles Are Unique
Archaeal Cytokinesis Similar to Eukaryotes
• CdvA—Bind the membrane and forms a non-contractile
ring at midcell.
• CdvB—Ring constricts to separate the daughter cells.
• CdvC—Recruited with CdvB to the site of division.
• FtsZ—Z-ring associates with the new S-layer
7.4 Growth Curves Consist of Five Phases
Growth
Increase in cellular constituents that may result in:
• Increase in cell number.
• Increase in cell size.
Growth most commonly referred to as population growth rather than growth of individual cells
7.4 Growth Curves Consist of Five Phases
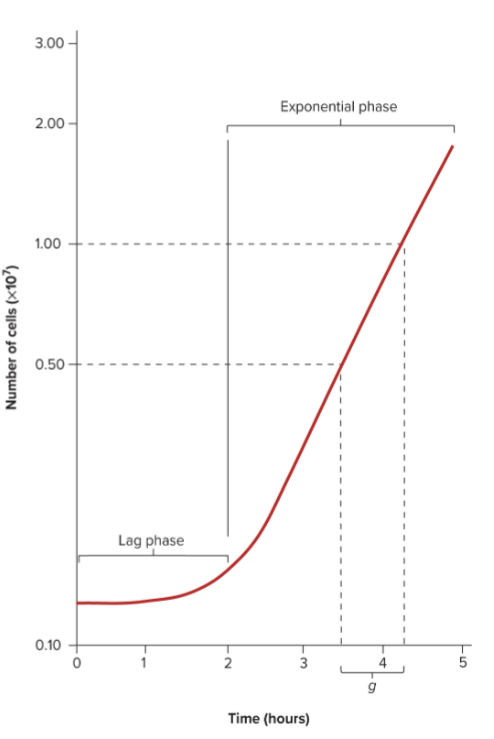
Microbial Growth Curve
Observed when microorganisms are cultivated in liquid (broth) culture.
Batch culture—incubated in a closed vessel with a single batch of medium.
Usually plotted as logarithm of cell number versus time

7.4 Growth Curves Consist of Five Phases
Five Phases of Growth
1. Lag Phase
Cell synthesizing new components.
Replenish spent materials (that is, ribosomes and ATP).
To adapt to new medium or other conditions.
Eventually, cells replicate their DNA, increase in mass, and divide.
2. Exponential Phase
Rate of growth and division is constant and maximal.
Population is most uniform in terms of chemical and physical
properties during this phase.
7.4 Growth Curves Consist of Five Phases
Exponential Phase Growth Rate Depends on Nutrient Availability
During exponential phase, cells grow as quickly as they can for the conditions available.
• Final net growth increases with the initial amount of the limiting nutrient present.
• Growth rate increases with nutrient concentration, but it saturates.

7.4 Growth Curves Consist of Five Phases
Phases of Growth—Stationary Phase
3. Stationary Phase
In a closed system, growth eventually ceases.
Total number of viable cells remains constant.
• Balance between cell division and cell death.
• Population may cease to divide but remain metabolically active.
Reasons for stationary phase:
• Nutrient limitation
• Limited oxygen availability
• Toxic waste accumulation
• Critical population density reached
7.4 Growth Curves Consist of Five Phases
Critical population density
Critical population density" refers to a threshold level in ecology, microbiology, and
behavioral science where a population's density triggers a significant, often rapid,
change in behavior or state. This threshold is a fundamental mechanism for moving from
disorganized, individual actions to highly synchronized group, swarm, or herd behavior.
•Ecological and Microbiological Impact:
• Bacterial Quorum Sensing: Bacteria use this density to switch on group behaviors,
such as biofilm formation, which can be critical for survival.
• Predator-Prey Interactions: The rapid propagation of this density can cause abrupt,
widespread shifts in the balance between predators and prey.
• Antibiotic Resistance: Bacterial populations that reach a certain critical density can
withstand otherwise effective antibiotic treatments.
7.4 Growth Curves Consist of Five Phases
Phases of Growth
4. Death Phase
Number of viable cells declines exponentially, with cells dying
at a constant rate.
Nutrient deprivation and the buildup of toxic wastes cause
irreparable harm to the cells.
5. Long-Term Stationary Phase
Bacterial population continually evolves.
Process marked by successive waves of genetically distinct
variants.
Natural selection occurs within a single culture.
7.4 Growth Curves Consist of Five Phases
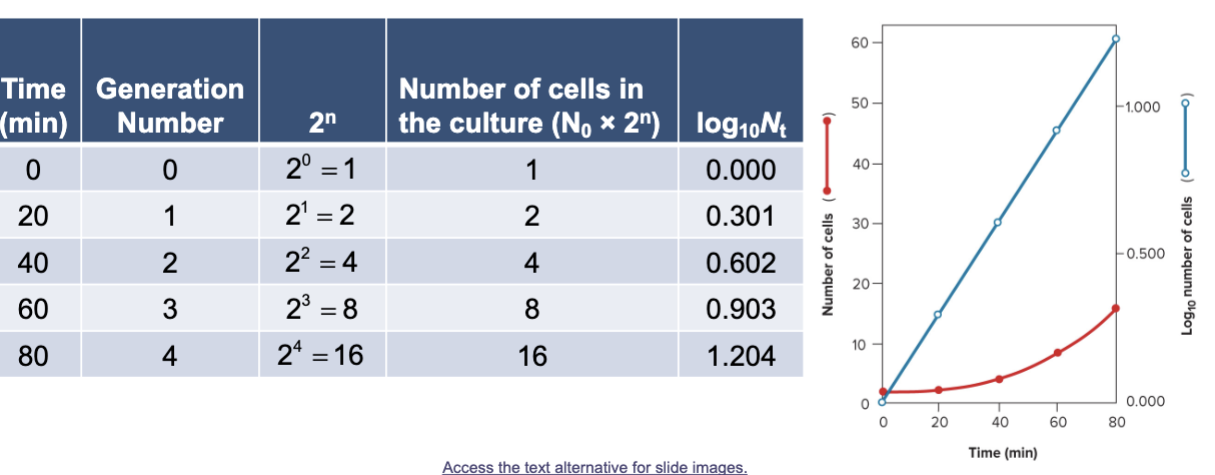
Mathematics of Growth
Generation (doubling) time
• Time required for the population to double in size.
• Varies depending on species of microorganism and environment.
7.4 Growth Curves Consist of Five Phases
Calculation of Growth Rate
Calculation of the growth rate constant (k)—number of
generations per unit time.
• Let N0 = the initial population number
• Nt = the population at time t
• n = the number of generations in time t
For populations reproducing by binary fission:
• !
" #!" "= !
Solving for n, the number of generations, where all logarithms are
to the base 10,
• log Nt = log N0 + n * log 2
• n = (log Nt − log N0)/log 2 = (log Nt − log N0)/0.301
Overall:
k = (n/t) = (log Nt − log N0)/0.301t
7.4 Growth Curves Consist of Five Phases
Calculation of Generation Time
Calculation of generation (doubling) time:
If a population doubles, then
• Nt = 2 N0
Substitute 2N0 into the growth rate
constant equation and solve for
• k = (log (2N0) − log N0)/0.301g =
(log 2 + log N0 − log N0)/0.301g
• k = 1/g
The generation time is the reciprocal
of the growth rate constant.
• g = 1/k
7.5 Environmental Factors Affect Microbial Growth
The Influence of Environmental Factors on Growth
• Most organisms grow in fairly moderate environmental conditions.
• Extremophiles—Grow under harsh conditions that would killmost other organisms.
• All microbes must respond to changes in their environment.
• Microbes have an optimal range of an environmental parameter for best growth.

7.5 Environmental Factors Affect Microbial Growth
Solutes Affect Osmosis and Water Activity
Changes in osmotic concentrations in the environment may
affect microbial cells.
Hypotonic solution
Lower solute concentration outside the cell than inside the
cell.
Water enters the cell and may burst.
Hypertonic solution
Higher solute concentration outside the cell than inside the cell.
Water leaves the cell and membrane shrinks
7.5 Environmental Factors Affect Microbial Growth
Microbes Adapt to Changes in Osmotic Concentrations
Most microbes live in hypotonic environment.
• Protected by cell wall, preventing overexpansion of
plasma membrane.
Mechanisms to lower solute concentration in cytoplasm:
• Mechanosensitive (MS) channels in plasma membrane
allow solutes to leave.
• Protists use contractile vacuoles to expel excess water
7.5 Environmental Factors Affect Microbial Growth
Osmophiles
Halophiles
Require NaCl at a concentration above about 0.2 M.
Extreme halophiles
Require salt concentrations between 3 M and 6.2 M.
Salt-in
Accumulate K and Cl in cytoplasm.
Proteins need these high salt levels.
Salt-out
Keep salt ions outside of cell.
Synthesize compatible solutes that do not interfere with growth.

7.5 Environmental Factors Affect Microbial Growth
Solutes and Water Activity
Water activity (aw)
Measure of the degree of water availability.
Low water activity means most water is bound, not available tomicroorganisms.
1/100 the relative humidity of solution.
Equal to ratio of solution’s vapor pressure (Psoln) to that of pure water (Pwater).
Most microorganisms only grow well at water activities around 0.98.
Osmotolerant—microorganisms that can grow over wide ranges of water activity but optimally at higher levels.
Xerotolerant—microbes that withstand high solute concentrations.
7.5 Environmental Factors Affect Microbial Growth
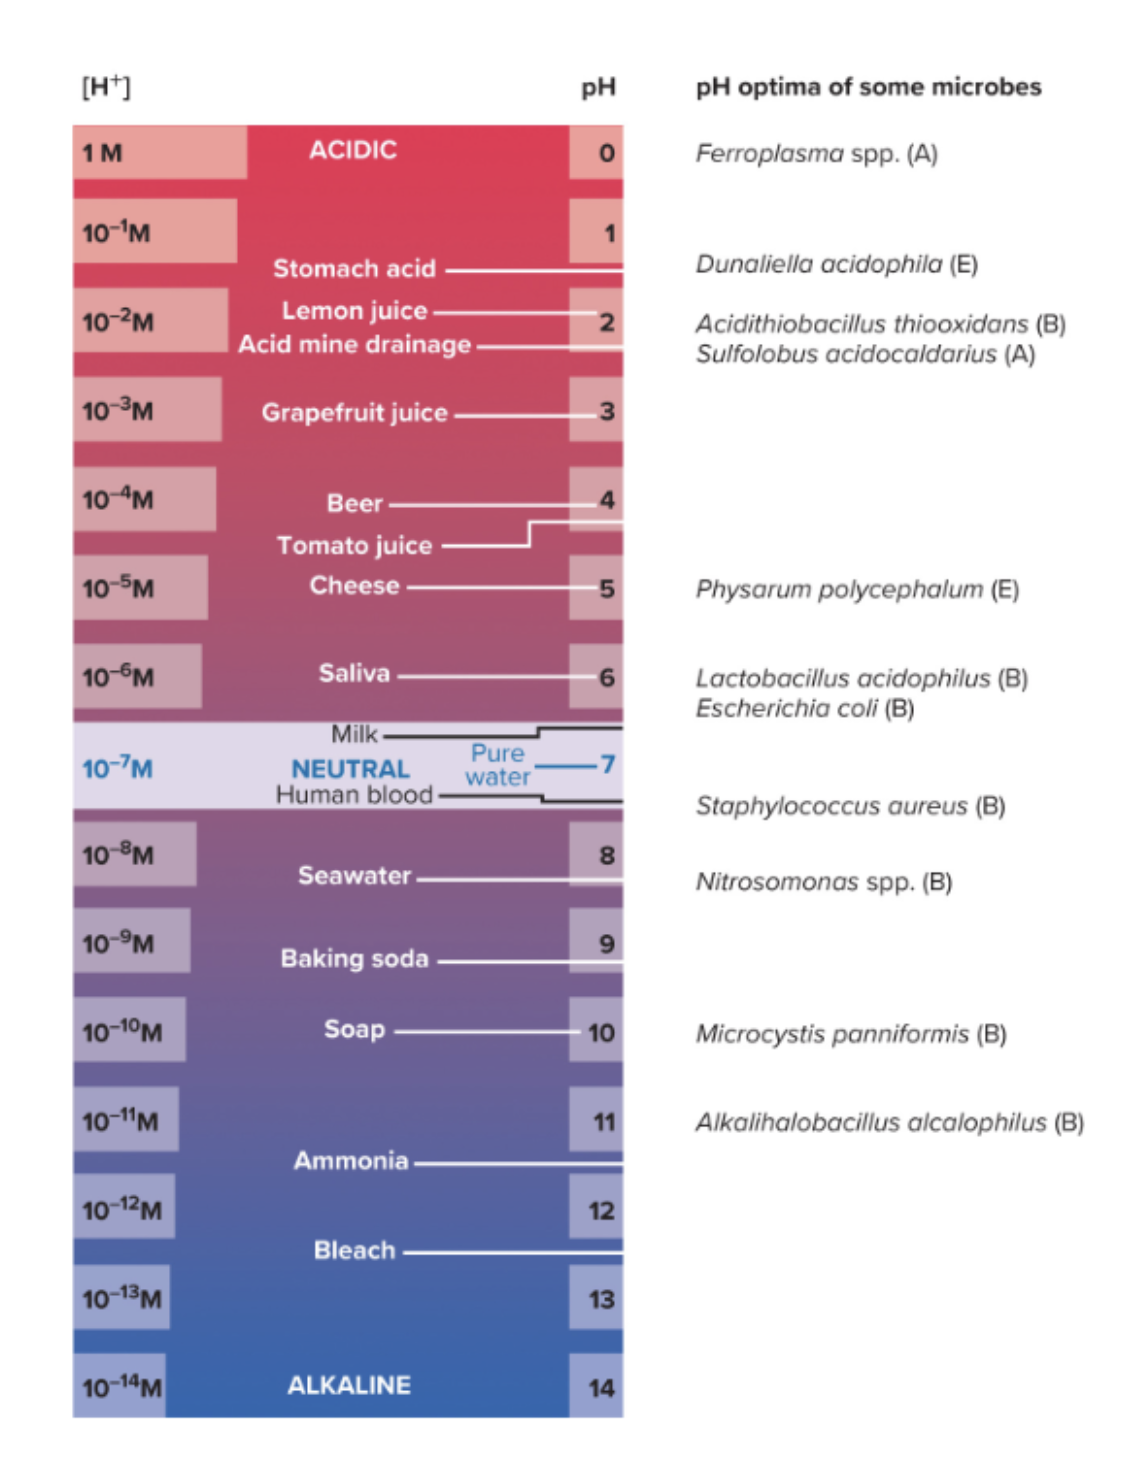
pH
pH is a measure of the relative acidity of a solution.
• Negative logarithm of the hydrogen ion concentration.
Acidophiles
• Growth best between pH 0 and 5.5.
Alkaliphiles (alkalophiles)
• Growth best between pH 8 and 11.5.
7.5 Environmental Factors Affect Microbial Growth
pH Preference of Microorganisms
Most bacteria and protists are neutrophils.
Most fungi prefer more acidic surroundings, about pH 4 to 6.
• Photosynthetic protists also seem to favor slight acidity.
Some archaea are acidophiles.
Alkaliphiles are distributed among all three domains of life (Bacteria, Archaea and Eukarya).
7.5 Environmental Factors Affect Microbial Growth
pH Tolerance Mechanisms of Microbes
Microorganisms respond to external pH changes using
mechanisms that maintain a neutral cytoplasmic pH.
Neutrophiles exchange potassium for protons
Acidophiles
Pump protons (H+) out of the cell.
Alkaliphiles
• Exchange internal !"+ ions for external protons
7.5 Environmental Factors Affect Microbial Growth
Temperature
Microbes cannot regulate their internal temperature.
Enzymes have optimal temperature at which they function
optimally.
Below optimum temperature, enzyme is not catalytic.
High temperatures may inhibit enzyme functioning and be lethal.
Cardinal temperatures
• Minimum
• Maximum
• Optimal

7.5 Environmental Factors Affect Microbial Growth
Temperature Ranges for Microbial Growth
• Psychrophiles—0degC to 20degC
• Psychrotrophs—0degC to 35degC
• Mesophiles—20degC to 45degC
• Thermophiles—45degC to 85degC
• Hyperthermophiles—85degC to 100degC
7.5 Environmental Factors Affect Microbial Growth
Adaptations of Thermophiles
Heat-stable enzymes and protein synthesis systems that
function at high temperatures.
Protein structure stabilized by a variety of means.
• More H bonds.
• More proline, less flexible peptides.
• Chaperones aid in folding.
Membrane stabilized by variety of means.
• More saturated, more branched and higher molecular weight.
• Ether linkages, resistant to hydrolysis.
7.5 Environmental Factors Affect Microbial Growth
Oxygen Concentration
Growth in presence of different oxygen concentrations
depends on a microbe’s metabolic processes, electron
transport chains (ETC), terminal electron acceptor used.
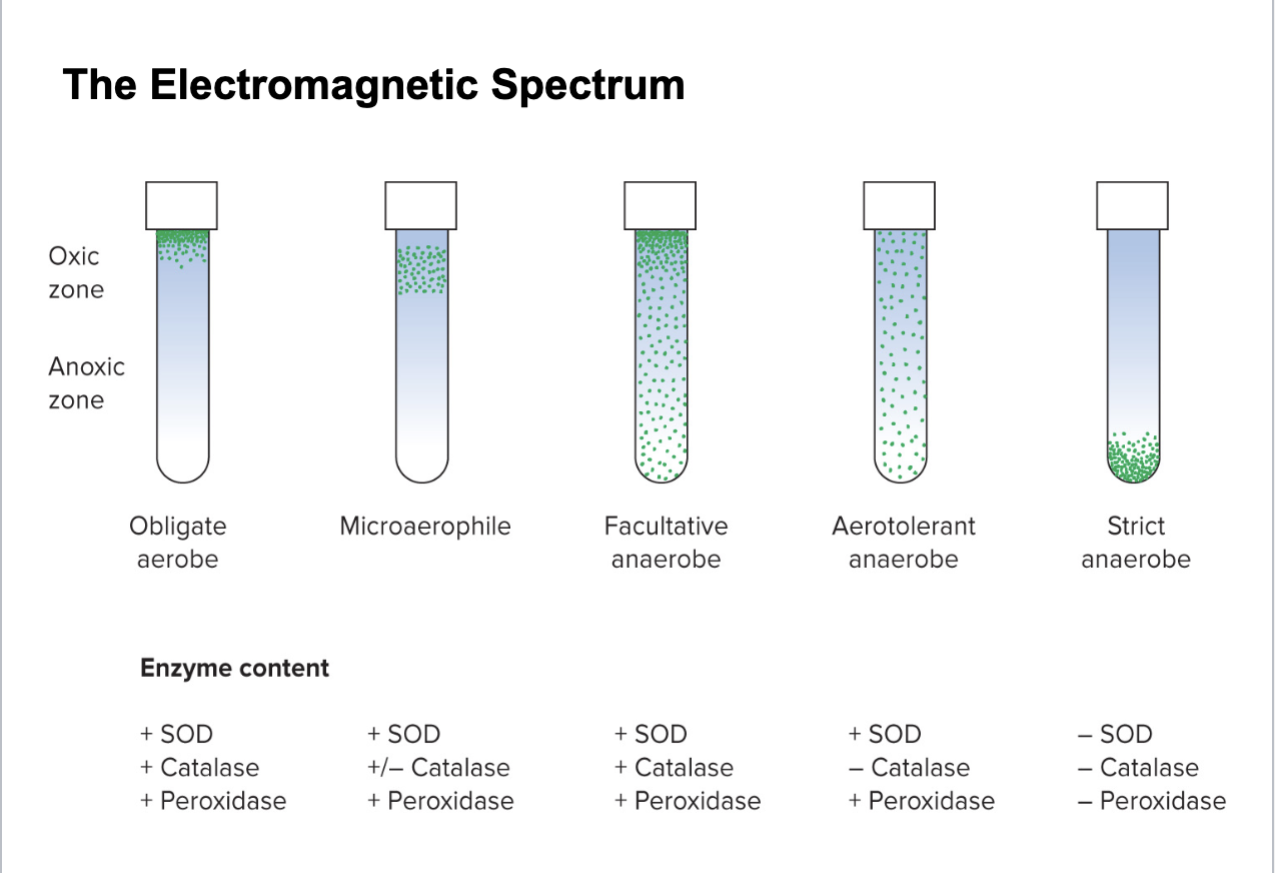
Five types of relationships to O2
• Obligate aerobe—requires O2.
• Obligate anaerobe—usually killed in presence of O2.
• Microaerophile—requires 2 to 10% O2.
• Facultative anaerobes—do not require O2 but grow better in its presence.
• Aerotolerant anaerobes—grow with or without O2

7.5 Environmental Factors Affect Microbial Growth
Basis of Different Oxygen Sensitivities
Oxygen reduced to reactive oxygen species (ROS).
• Superoxide radical
• Hydrogen peroxide
• Hydroxyl radical
Microorganisms must be able to protect itself from ROS.
Aerobes produce protective enzymes
Superoxide dismutase (SOD)
Catalase
Peroxidase
7.5 Environmental Factors Affect Microbial Growth
Pressure
Microbes that live on land and water surface live at a
pressure of 1 atmosphere (atm).
Some Bacteria and Archaea live in deep sea with very high
hydrostatic pressures.
Barotolerant—adversely affected by increased pressure, but
not as severely as nontolerant organisms.
Peizophilic (barophilic)—requires high pressure for growth.
Change membrane fatty acids to adapt to increasing pressure.
Lipids become more unsaturated and shorter
7.5 Environmental Factors Affect Microbial Growth
Harmful Radiation
Ionizing radiation
X-rays and gamma rays
Cause mutations that indirectly result in death.
Disrupts chemical structure of many molecules.
Breaks H-bonds and destroys ring structures.
Bacterial endospores and Deinococcus radiodurans are extremely resistant to ionizing radiation.
7.5 Environmental Factors Affect Microbial Growth
Radiation Damage—UV and Visible Light
Ultraviolet (UV) radiation
• Most lethal wavelength is 260 nm because it is absorbed
by DNA.
• DNA damage can be repaired by several repair
mechanisms.
Visible light
• At high intensities generates singlet oxygen (1O2), a powerful oxidizing agent.
• Carotenoid pigments protect many light-exposed microorganisms from photooxidation
7.6 Microbial Growth in Natural Environments
Microbial environments:
• Are complex and constantly changing.
• Expose a microorganism to overlapping gradients of nutrients and environmental factors.
• Contain both micro- and macroorganisms.
7.6 Microbial Growth in Natural Environments
Most Microbes Live in Growth-Arrested States
Few microbes live in nutrient rich (eutrophic) environments.
Most microbes inhabit low nutrient (oligotrophic)
environments.
Microbes have evolved many responses to starvation and
environmental stress:
• Morphological changes (that is, endospore formation)
• Growth arrest—enter stationary phase.
• Can use cellular components as nutrients.
• Numerous proteins that help.
• Viable but not culturable state—resume growth once
nutrients return.
• Persisters
7.6 Microbial Growth in Natural Environments
Biofilms Are Common in Nature
lots of questions here
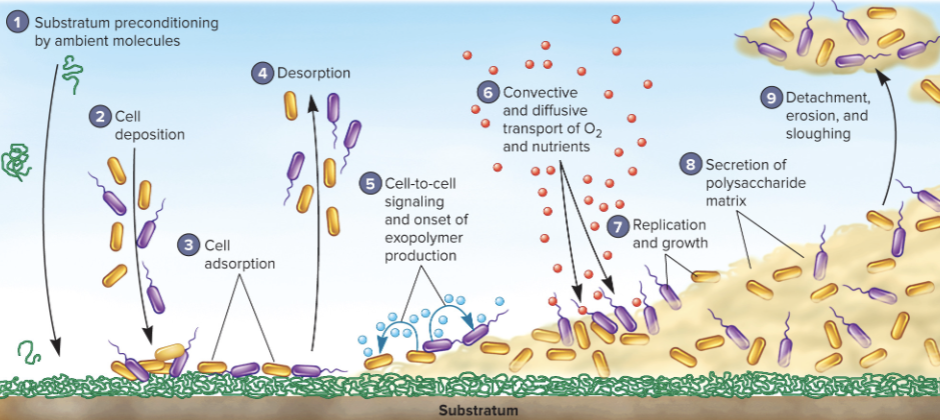
• Most microbes grow attached to surfaces (sessile) rather
than free floating (planktonic).
• These complex, slime enclosed communities of microbes
are called a biofilm.
• Biofilms are ubiquitous in nature in water.
• Can be formed on any conditioned surface.
7.6 Microbial Growth in Natural Environments
Biofilm Formation
lots of questions here
• Microbes reversibly attach to conditioned surface and release polysaccharides, proteins, and DNA to form the extracellular polymeric substance (EPS).
• Additional polymers are produced as microbes reproduce
and biofilm matures.
7.6 Microbial Growth in Natural Environments
Heterogeneity in Biofilms
A mature biofilm is a complex, dynamic community of microorganisms.
Heterogeneity is differences in metabolic activity and locations of microbes.
Interactions occur among the attached organisms.
• Use molecules to communicate and DNA uptake can occur in community
7.6 Microbial Growth in Natural Environments
Biofilm Microorganisms
• Emergent properties
• Properties could not be predicted from studying single cell.
• Physiological changes and EPS protect microbes from
harmful agent (that is, UV).
• When formed on medical devices, such as implants,
antibiotic treatment fails.
• Chunks of biofilm can be sloughed off which can
contaminate a drinking water system
7.6 Microbial Growth in Natural Environments
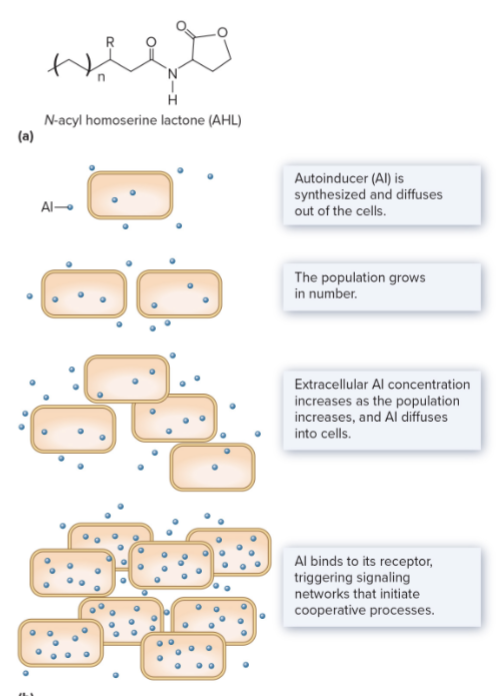
Cell-Cell Communication Within Microbial Populations
Quorum sensing
Bacterial cells communicate via small molecules that diffuse
in the environment.
• In order to conduct business, a sufficient number of
microbes must be present and participating
7.6 Microbial Growth in Natural Environments
Quorum Sensing Systems
N-acylhomoserine lactone (AHL)
Autoinducer
Normally, moves across the plasma membrane from the cytoplasm to the outside of the cell.
When cell population is high, AHL diffuses in the cell which induces specific gene expression.
Pseudomonas aeruginosa uses this to express virulence factors.
Bioluminescent bacteria use this to light.
Autoinducing peptides (AIPs)
Gram positive bacteria
Autoinducing short peptides
7.7 Laboratory Culture of Microbes Requires Conditions that Mimic Their Normal Habitats
Culture Media
Culture medium—solid or liquid mixture of nutrients andother compounds.
• Need to grow, transport, and store microorganisms in lab.
Must contain all growth factors microorganism requires.
Use knowledge about microbe's normal habitat when
selecting culture media.
Classified based on chemical composition, physical nature
and their function
7.7 Laboratory Culture of Microbes Requires Conditions that Mimic Their Normal Habitats
Types of Media
Defined/synthetic medium
• Each ingredient can be defined with a chemical formula.
Complex media
• Contain some ingredients of nonspecific chemical
composition.

7.7 Laboratory Culture of Microbes Requires Conditions that Mimic Their Normal Habitats
Some Media Components
Peptones—partial proteolytic digestion of protein sources.
Extracts—aqueous extracts that contain amino acids,
peptides, nucleotides, organic acids, vitamins, and minerals.
• Usually beef or yeast.
Agar—sulfated polymer solidifying agent.
• Most microorganisms cannot degrade it

7.7 Laboratory Culture of Microbes Requires Conditions that Mimic Their Normal Habitats
Functional Types of Media
Supportive media (that is, tryptic soy broth and agar)
• Sustain growth of many microorganisms.
Enriched media (that is,
blood agar)
• Supportive media supplemented with special nutrients.
7.7 Laboratory Culture of Microbes Requires Conditions that Mimic Their Normal Habitats
Selective and Differential Media
Selective media—allow the growth of particular microorganisms,
while inhibiting the growth of others.
• Gram-negative bacteria can grow on bile salts, while Gram-
positive bacteria cannot.
Differential media—distinguish among different groups of
microbes and even permit tentative identification of microbes
based on their biological characteristics.
• Blood agar—distinguish
between hemolytic versus
nonhemolytic bacteria.
• MacConkey agar—distinguish
between lactose fermenters
versus nonfermenters.
7.7 Laboratory Culture of Microbes Requires Conditions that Mimic Their Normal Habitats
Cultivation of Anaerobic Microbes
These microbes cannot tolerate O2 and must be grown
without O2.
• Anaerobic media with reducing agents
• Anaerobic chamber
• Hard transparent containers sealed tightly.
• Candle Jar
7.7 Laboratory Culture of Microbes Requires Conditions that Mimic Their Normal Habitats
Isolation of Pure Cultures
• Pure or axenic culture—population of cells arising from a
single cell.
• Allows for the study of single type of microorganism in
mixed culture.
• To isolate a single bacteria, microbiologists enrich for the
microbe of interest and then follow with methods to obtain
a pure culture
7.7 Laboratory Culture of Microbes Requires Conditions that Mimic Their Normal Habitats
Enrichment Cultures
Enrichment culture
• Encourages growth of microbes with a particular
characteristic, while inhibiting growth of others.
Three factors considered:
• A suitable source of microbes.
• Nutrients that should and should not be included in the
culture medium.
• Environmental conditions
7.7 Laboratory Culture of Microbes Requires Conditions that Mimic Their Normal Habitats
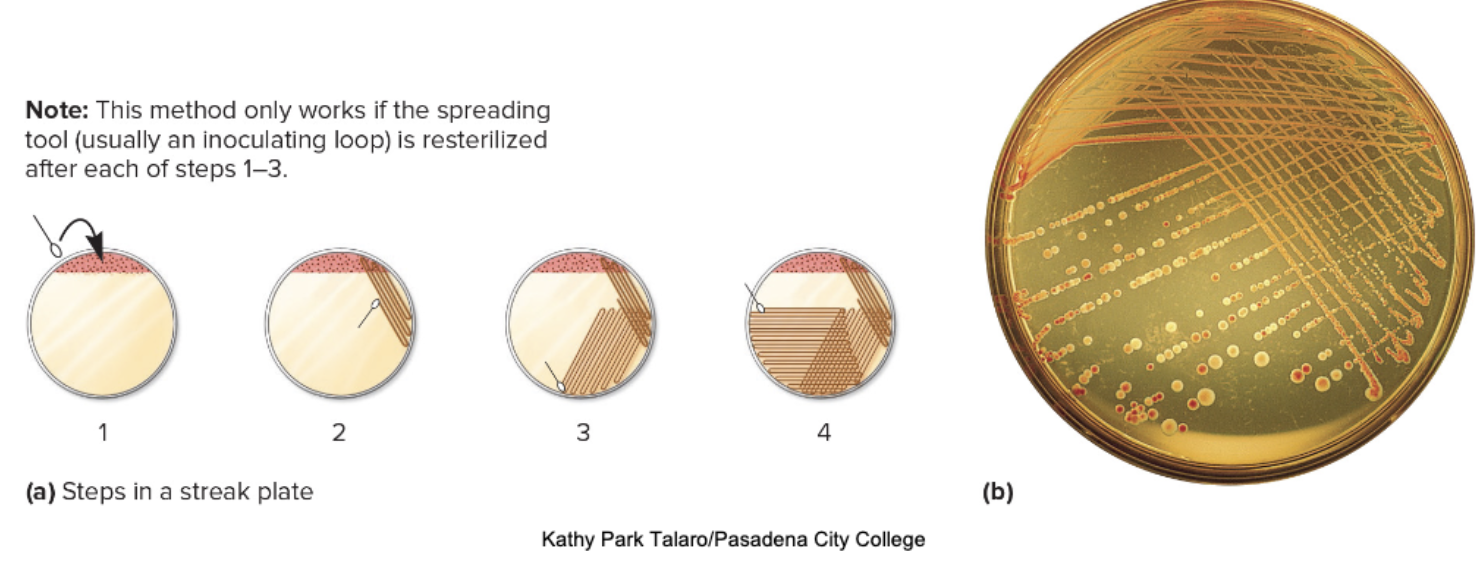
Streak Plate
Technique of spreading a mixture of cells on an agar surface
using an inoculating loop or swab.
• Goal is to obtain individual cells that are separated from
each other.
Each cell can reproduce to form a separate colony (visible
cluster of microorganisms).
7.7 Laboratory Culture of Microbes Requires Conditions that Mimic Their Normal Habitats
Spread Plate
Small volume of diluted mixture is transferred to the center of
an agar plate and spread evenly over surface with a sterile
bent rod.
• Dilution made by serial dilution

7.7 Laboratory Culture of Microbes Requires Conditions that Mimic Their Normal Habitats
Pour Plate
• Sample is serially diluted and mixed with liquid agar.
• This mixture of cells and agar is poured into sterile culture dishes.
• Useful when sampling a heterogeneous population of microbes that might produce overgrown colonies.

7.7 Laboratory Culture of Microbes Requires Conditions that Mimic Their Normal Habitats
New Approaches to Culturing Microbes
Culturomics
• Use miniature cultures and incubate in many different conditions to find the best one.
Bring natural environment into the lab (that is, seawater).
Diffusion chamber that slows nutrients to diffuse but retains the microbes.
Dilution can contain a single cell.
Co-culturing
• Growth on animals or tissues in lab.
7.8 Microbial Population Size Can Be Measured Directly or Indirectly
Measurement of Microbial Growth and Direct Measurement of Cell Numbers
Microbial growth can be measured by changes in number of
cells or mass.
Direct measurement of cell Numbers
Direct counts
Counting chambers—special slides and cover slips with grids to facilitate counting.
Membrane filter technique—microbes are filtered and then stained.
Flow cytometry—stream of cells so narrow that one cell at a time passes through the laser beam.
Electronic counters—the Coulter counter
7.8 Microbial Population Size Can Be Measured Directly or Indirectly
Counting Chambers
Number of microbes calculated from chamber’s volume and dilutions.
Advantages
• Easy, inexpensive, and relatively quick.
• Gives information about the size and morphology of microorganisms.
Disadvantages
• Population must be large and
evenly dispersed.
7.8 Microbial Population Size Can Be Measured Directly or Indirectly
Direct Counts on Membrane Filters
Cells filtered through special membrane that provides dark
background for observing cells.
Cells are stained with fluorescent dyes.
• DAPI
With certain dyes, can distinguish living from dead cells
7.8 Microbial Population Size Can Be Measured Directly or Indirectly
Flow Cytometry
Microbial suspension forced through small orifice with a laser
light beam.
Scattered light detected by flow cytometer.
Each light scattering event is detected independently, thus the number of events represents the number of cells.
Cells of differing size, internal complexity, and other characteristics within a population can also be counted.
7.8 Microbial Population Size Can Be Measured Directly or Indirectly
Electronic Counters—Coulter Counter
• Microbial suspension is forced through a small hole.
• Electrical current flows through the hole, and electrodes
placed on both sides of the hole measure electrical
resistance.
• Every time a microbial cell passes through the hole,
electrical resistance increases (that is the conductivity
drops), and the cell is counted
7.8 Microbial Population Size Can Be Measured Directly or Indirectly
Viable Counting Method—Standard Plate Counts
Spread and pour plate techniques
• Diluted sample of bacteria is spread over solid agar
surface or mixed with agar and poured into Petri plate.
• After incubation, the numbers of organisms are
determined by counting the number of colonies multiplied
by the dilution factor.
• Results expressed as colony forming units (CFU)
7.8 Microbial Population Size Can Be Measured Directly or Indirectly
Viable Counting Method—Membrane Filter Method
Membrane filter technique
• Bacteria from aquatic samples are trapped on
membranes.
• Membrane soaked in culture media.
• Colonies grow on membrane.
• Colony count determines number of bacteria in sample
7.8 Microbial Population Size Can Be Measured Directly or Indirectly
Measurement of Cell Mass
Dry weight
• Time consuming and not very sensitive.
• Cells from liquid culture are pelleted by centrifuged and weighed.
Spectrophotometry
• Amount of light scattering is directly
proportional to cell biomass.
Concentration of a particular cell constituent
• Concentration of protein or nitrogen
proportional to number of cells
7.9 Chemostats and Turbidostats are Used for Continuous Culture of Microorganisms
Continuous Culture of Microorganisms
Continuous culture system
Maintains cells in exponential growth at a known rate for
extended periods.
Advantages
• Allow study of microbial growth at very low nutrient
concentrations, close to those present in natural
environment.
• Very useful in microbial ecology
7.9 Chemostats and Turbidostats are Used for Continuous Culture of Microorganisms
Chemostats and Turbidostats
• Chemostat
• Rate of incoming medium = rate of
removal of medium from vessel.
• An essential nutrient is in limiting
quantities.
• Most stable and effective at lower
dilution rates.
• Turbidostat
• Regulates flow rate of media through
vessel to maintain predetermined
turbidity.
• Dilution rate varies.
• Contains all nutrients in excess.
• Operates best at high dilution rates

7.9 Chemostats and Turbidostats are Used for Continuous Culture of Microorganisms
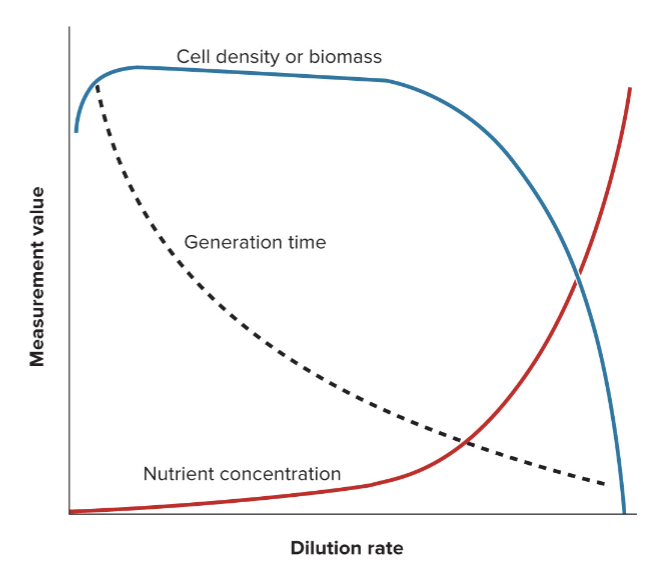
Dilution Rate and Microbial Growth
• Dilution rate—rate at
which medium flows
through vessel.
• Note: cell density
maintained at wide
range of dilution rates.
• Population size and
generation time are
related to the dilution
rate.