Edexcel A-level Geography - Water cycle
1/79
There's no tags or description
Looks like no tags are added yet.
Name | Mastery | Learn | Test | Matching | Spaced |
|---|
No study sessions yet.
80 Terms
Global water budget
balance of water fluxes and size of water stores involved in hydrological cycle each year
Closed system
Transfer of energy but no matter between the system and its surroundings
Open system
Receives inputs from and transfers outputs of energy and matter to other systems
Oceans water store
96.9%
Continents water store
3.02% (Groundwater 1.1%, River/Lake 0.1%, Soil moisture 0.01%, Atmosphere moisture 0.001%, Biological 0.0001%)
Fluxes
Martime to Continental Atmosphere 40 (10(3)km3)
Continental Atmos. to Continents 113 (reverse 73)
Continents to Oceans 40
Oceans to Maritime Atmos. 413 (reverse 373)
Fossil water
Water contained in an undisturbed space for longer than 1,000 years
Blue water
Water in its liquid form (Rivers)
Green water
Water evaporated from soil and plants
Grey water
Relatively clean water waste from baths, sinks and kitchen appliances
Ogallala Aquifer USA
Used for agriculture in Midwest, declined 300ft in some areas since 1940s, would take 6,000 years to replenish
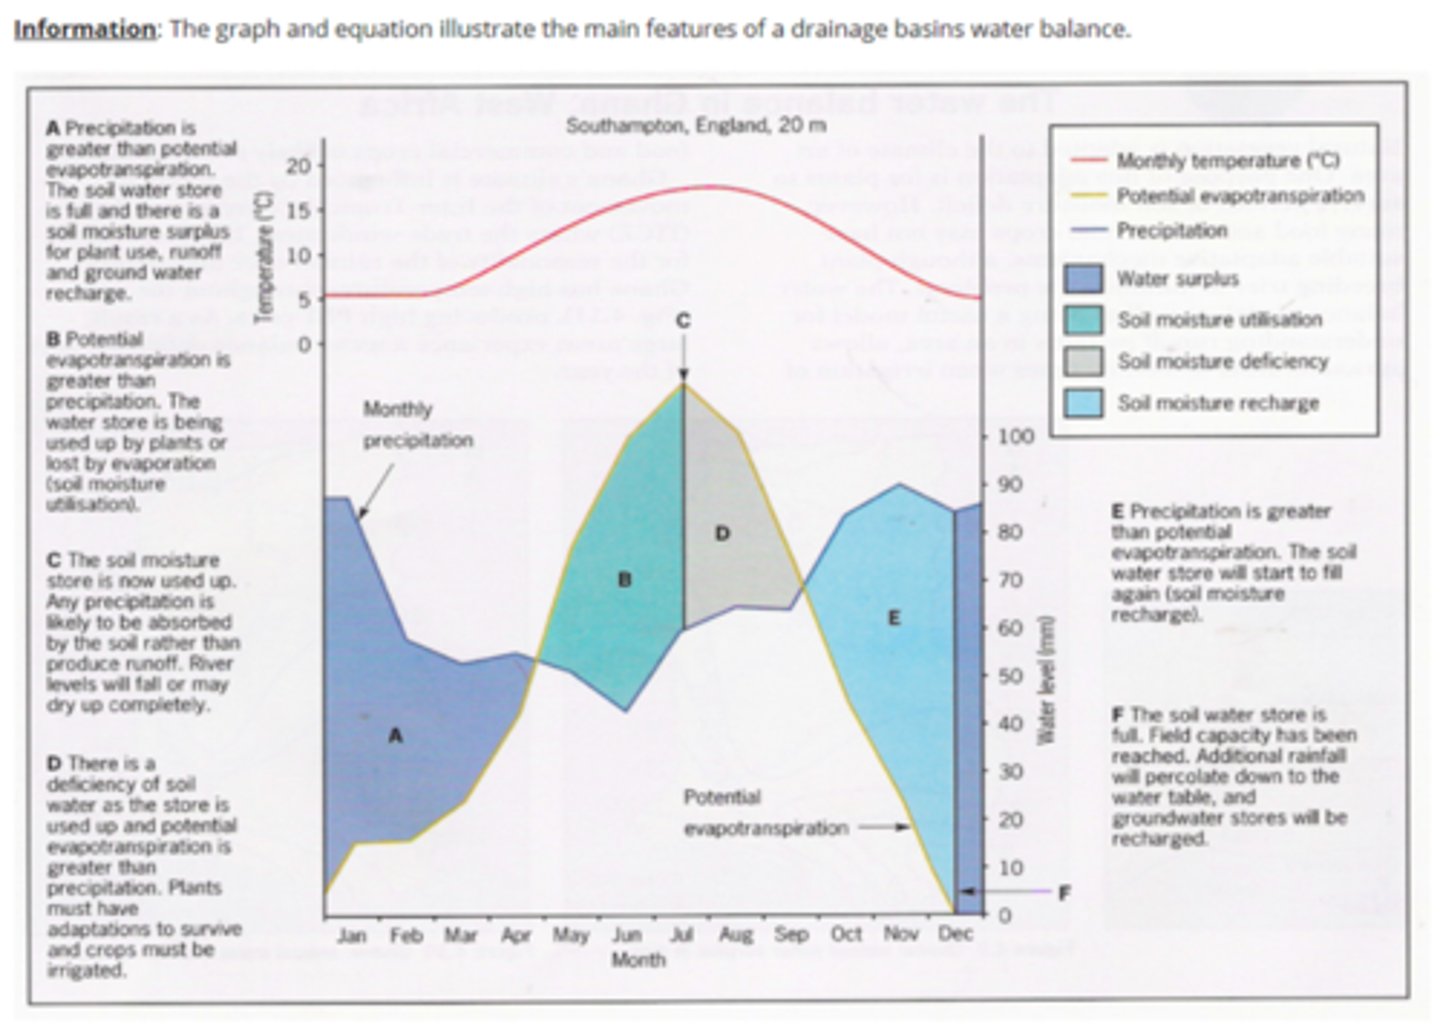
Water budget equation
Precipitation (Input) = Channel discharge + evapotranspiration (Output) +/- changes in storage
Drainage Basin
Area drained by a river and its tributaries, separated by high land called watershed (open system)
Interception
Water impeded by vegetation, varies due to temperature, leaf type, age and density
Infiltration
Rate water enters pores in the soil (mm/hour) - changes due to saturation levels
Overland flow
Water moving across the surface
Saturated overland flow
Rainwater forced to run off the surface when maximum soil saturation is reached
Infiltration-excess overland flow
When rainfall intensity is higher than infiltration capacity, causing the additional water to run over the surface
Groundwater flow
Slow movement of percolated water through rocks to a river
Percolation
Water moving vertically downwards through rocks
Evapotranspiration
Total amount of water removed from a drainage basin from liquid water to gas and water in the soil taken through plants that is e from the stomata
Channel runoff
Total water output from the catchment at river mouth
Human disruption to interception
Varied crops, deforestation, urbanisation
Human disruption to infiltration
Trampling, urbanisation, deforestation, ploughing
Human disruption to channel runoff
River extraction reducing flow (Colorado River)
Human disruption to evapotranspiration
Dams, global warming, vegetation changes
London Aquifer
Decline 65m 1845-1967
Water table rise became threat - 1998 increase in abstraction (70 million litres / day)
Convectional rainfall
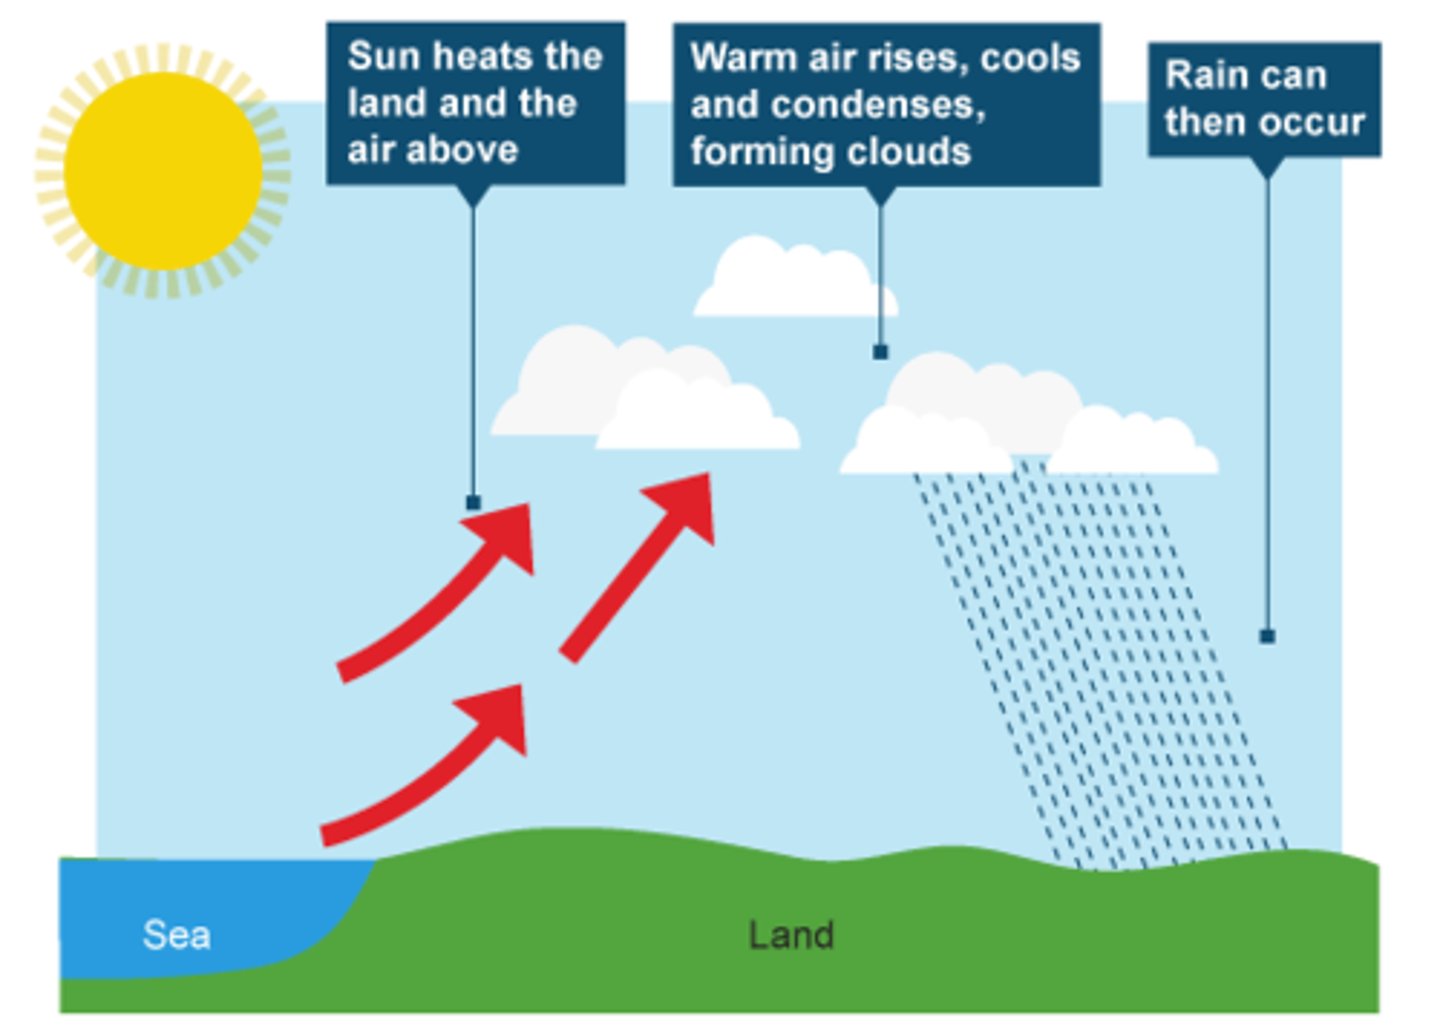
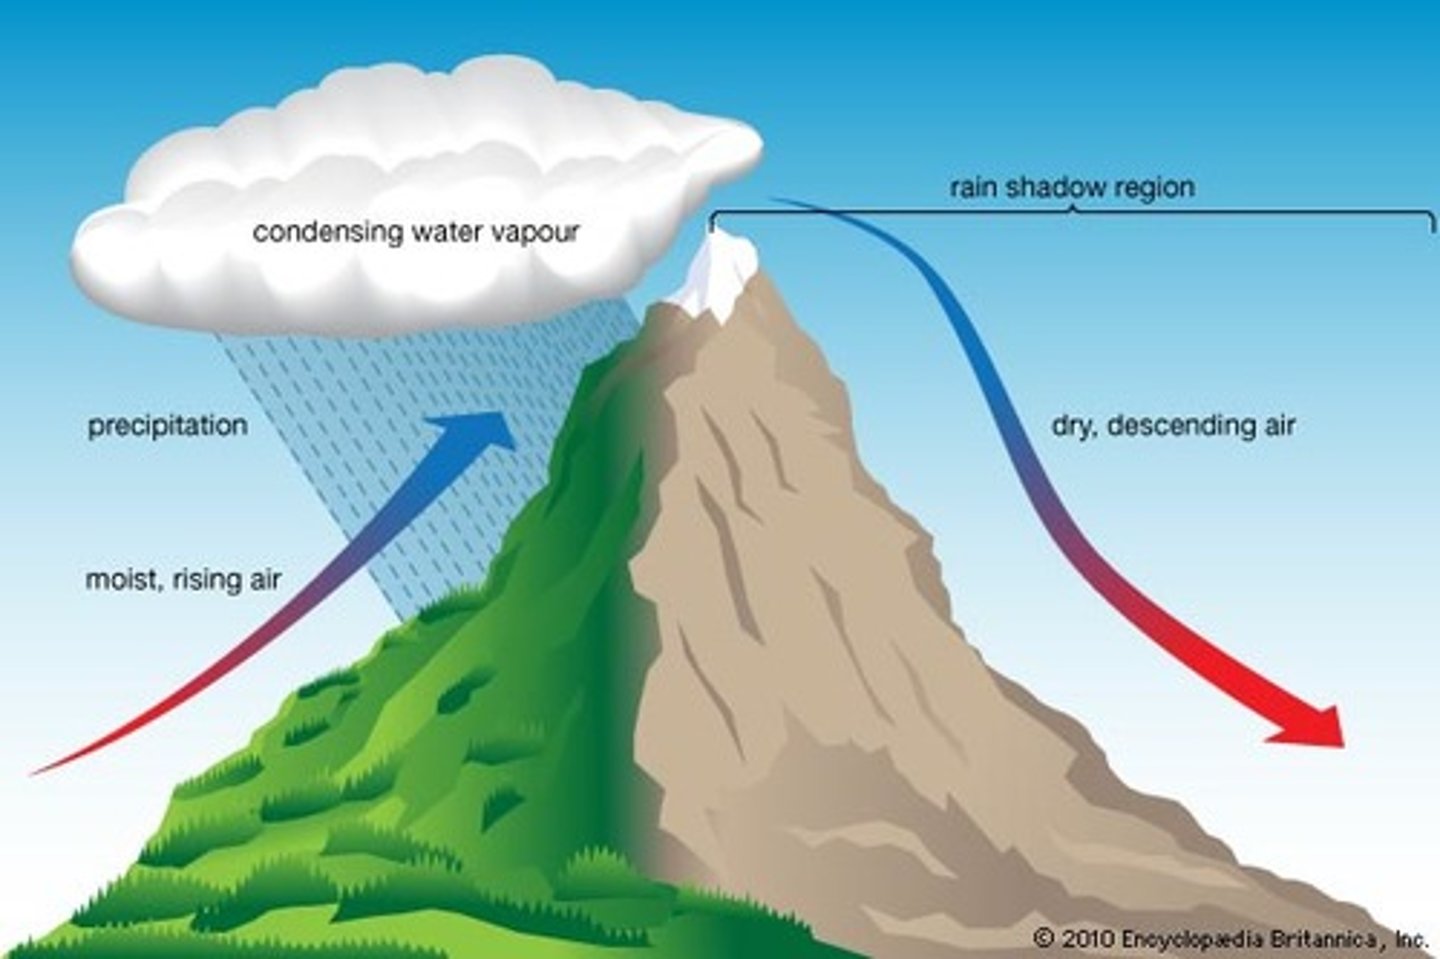
Relief rainfall
Frontal rainfall

Soil moisture budget
Used to compare inputs and outputs from soil
Soil moisture graph
River regime
Annual variation in discharge per year (displayed in hydrograph)
Perennial Channel
River with continual flow all year
Intermittent Channel
River with lack of flow for a few weeks/months a year
Ephemeral Channel
River that only flows for a few hours/days (Wadi)
River regime factors
Climate (desert mostly ephemeral), drainage area, altitude, geology, land use
River Wye Regime
Lowest flow in late summer (more evapotranspiration), highest flow in winter
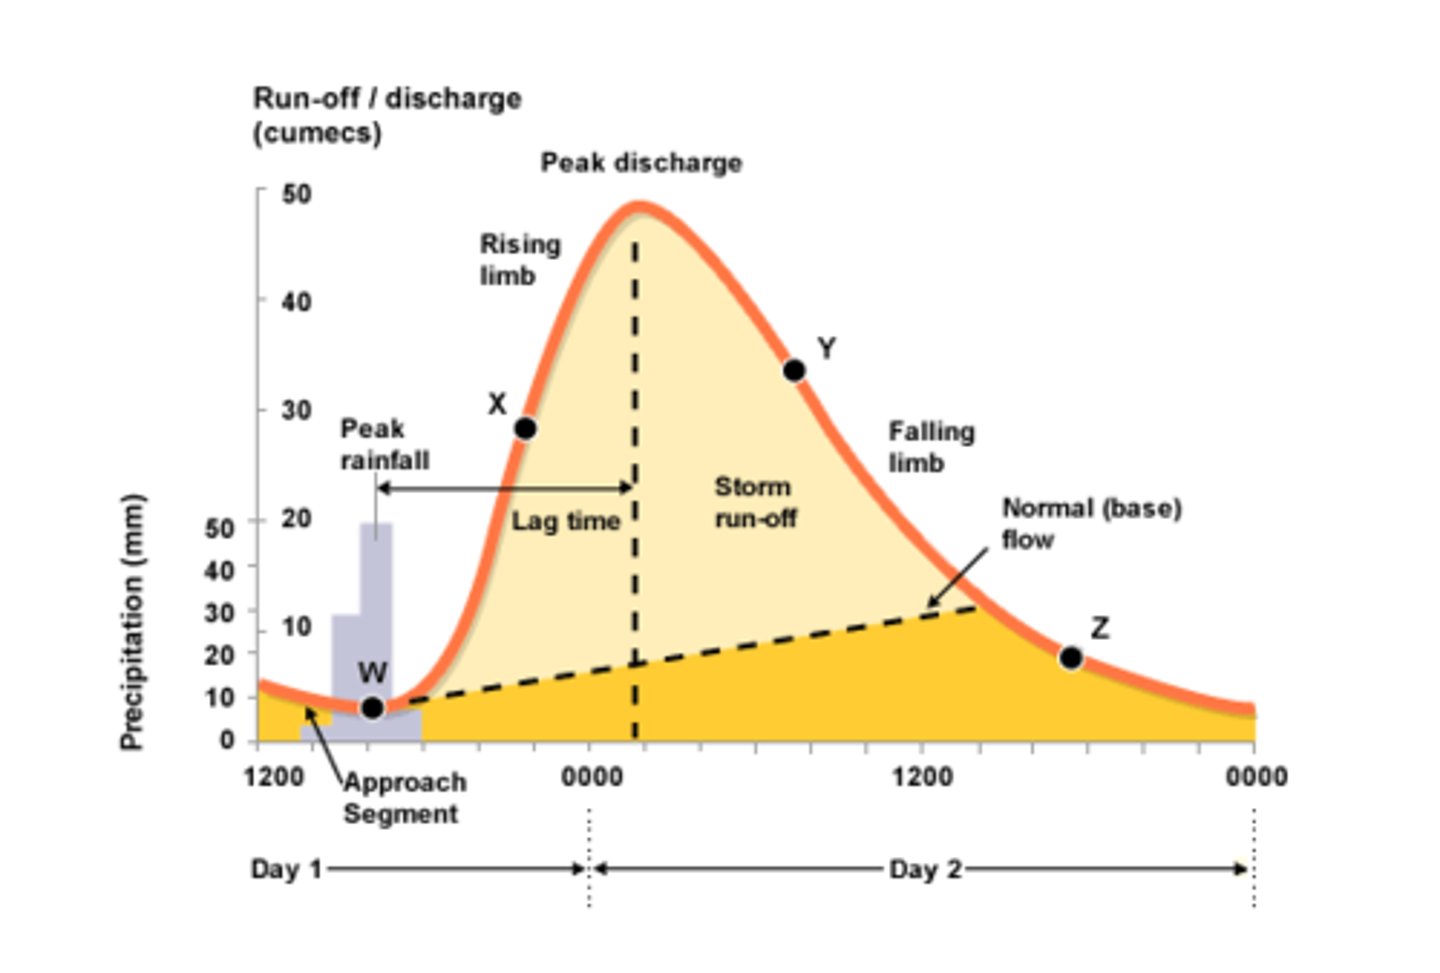
Storm Hydrograph
Amazon drought
Rainfall decline causing reduced nutrient input into streams and rivers
2005 = 70 million ha forest experienced drought
Canopy dieback occured
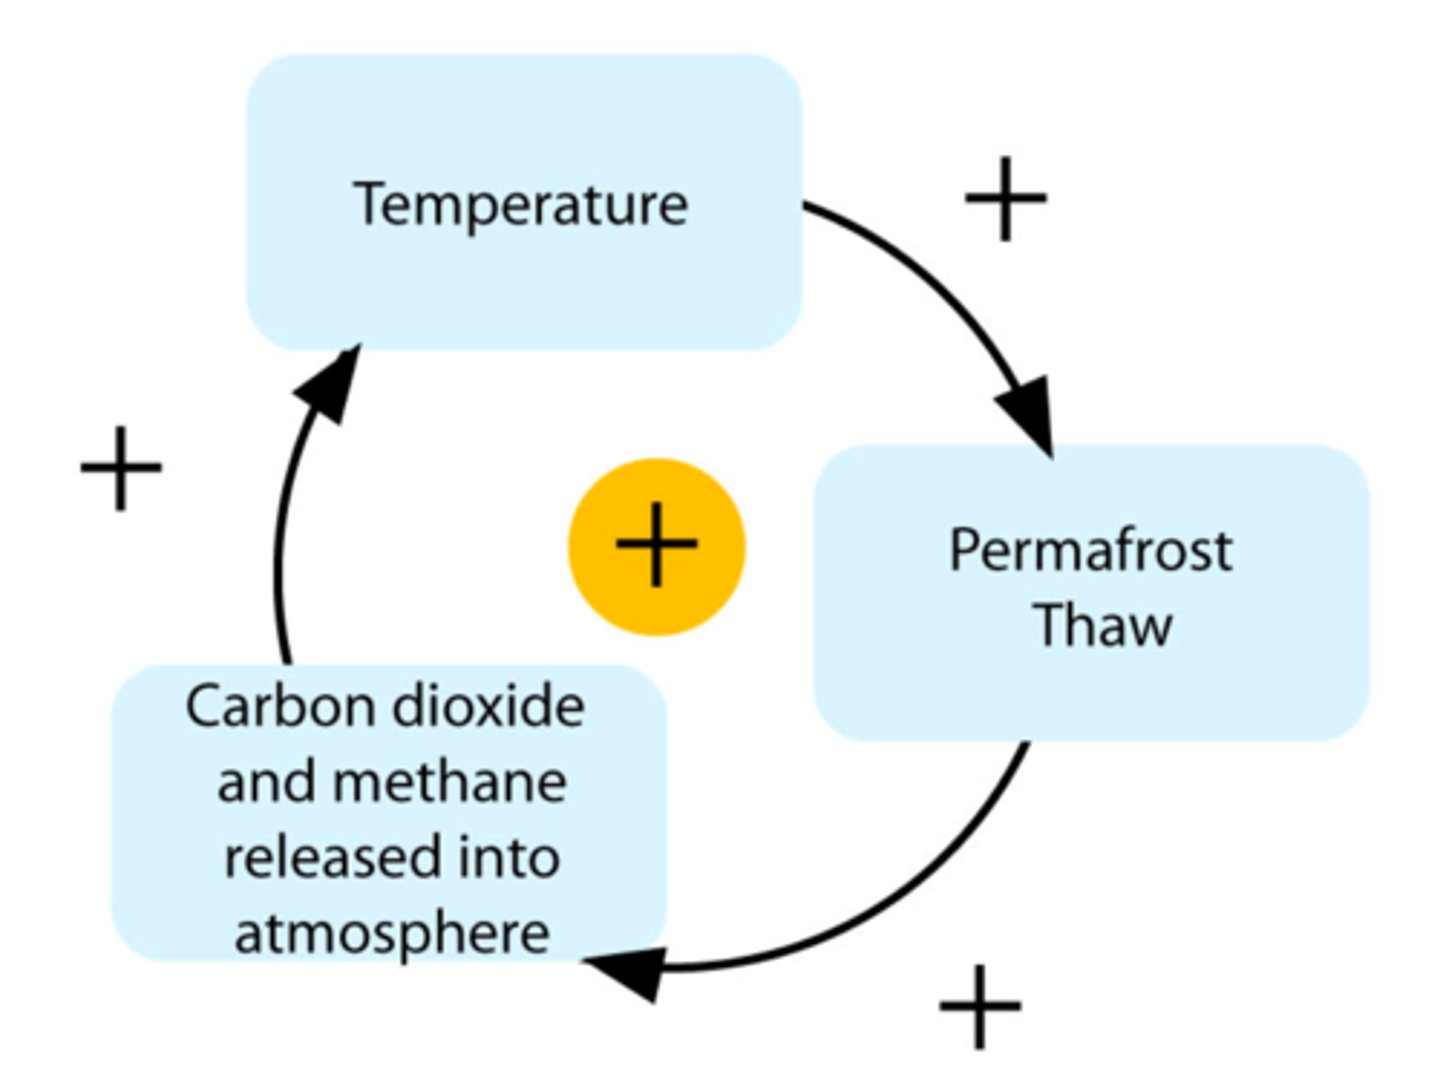
Positive feedback loop
Wetlands
Areas of marsh, fen or peatland
Lack resilience to drought
Serious struggle UK 1976
Meteorological Drought
When long-term precipitation is much lower than normal (region specific)
Agricultural Drought
Insufficient soil moisture to meet crop needs - normally evident after m. drought
Hydrological Drought
Deficiencies in surface and subsurface water supplies that originates from precipitation shortfall
Socio-economic Drought
When water demand for crops/HEP exceeds water availability
Intertropical Convergence Zone
Belt of low pressure at the equator that moves north or south seasonally. Intense heat causes air rise, creates wet season (when it arrives) and dry season (when is leaves)
Mid-Latitude blocking anticyclones
High pressure system that brings stable weather conditions with little precipitation, forcing rain-depressions around them. (UK)
Coriolis Force
Sahel drought
Decline in rainfall and crops since 1960s (50% crop decline)
Causes = overcultivation from high population, reduction in vegetation, overgrazing, El Nino caused rainclouds to fail
Bangladesh flooding 1998
Human causes = deforestation in headwater areas, agriculture diversion
Physical causes = monsoon climate, spring snow melt, 10% land lakes and rivers, 3 rivers with same peak, 80% only 1m high, silted rivers
Natural flooding
Intense rainfall in short time, prolonged rainfall, tropical storms and snowmelt
Human-caused flooding
Deforestation, urban growth, farmland and river mismanagement
Positive flooding
Recharge groundwater, fill wetlands, prevent future floods by ground level raise (Mississippi)
Negative flooding
Lost of property (economic damage), eutrophication and contamination (2012 Welsh Cattle)
UK flooding 2007
Jet stream abnormally south (depressions)
Result = June 136 mm, saturated soil, flash flooding in July at Ludlow, Hull
Effects = £3.2 billion (infrastructure £230 million), Local gov't £140 million cost, loss of 400,000 pupil days, no water supply to 350,000 in Gloucestershire
Climate change impact on water cycle
Decreased snow cover
Increased precipitation in low pressure areas
Increased flood risk
Decreased humidity and precipitation in high pressure areas (drought)
ENSO Cycle
El Nino Southern Oscillation every 7 years -
Warm equatorial water moves east to Americas causing greater precipitation and evaporation in Americas, Dry in West Pacfic
La Nina
Opposite of ENSO - droughts in Americas and flooding in West Pacific, more hurricanes in Caribbean, colder snowy winters in the UK
El Nino 1997/8
Each 12 days in March, Peru received 6 months of normal rain (killed 292 and destroyed 13,200 houses)
Forest fires in Indonesia
Droughts in Sahel, India and Southern Africa
Wet, mild and windy winters in Britain and NW Europe
Water Security
Capacity of a population to safeguard sustainable access to adequate quantities of water
Water Scarcity
When water resources are below 1000m3/person (water demand increasing twice as fast as population)
Water Scarcity factors
Availability - physical lack of resources
Access - failure of reliable supply
Utilisation - inadequate infrastructure/ finance issues
Absolute water scarcity
If water supplies are very low, less than 500m3/ person - normally causing water rationing
Physical water scarcity
When more than 75% of a countries river flows are being used
Economic water scarcity
When development of water resources is limited by human/ financial capabilities (1 billion people use less than 25% river flow) and water prices are expensive for citizens (Buenos Aires 217% price hike)
Causes of water insecurity
Physical = Climate (rain varies by region and season)
Human = Deforestation, overuse of Aquifers
Contamination = 300 million in China use contaminated water (1/3 rivers and 75% lakes polluted), 20% waterwells contain arsenic Bangladesh
Nile conflicts
Shared by 11 nations, very valuable as flows through arid areas (95% water for Egypt)
Egypt + Sudan significant veto power from 1929 Nile Agreement
1999 Nile Initiative for co-operation on use angered Egypt and Sudan
Agricultural water pressure
74% World supply use
Wasteful use of water
Pollution can reduce river quality
Industrial water pressure
18% World supply use
Water can be recycled (some efficiency)
Domestic water pressure
8% World supply use
Huge variations by country
Most rapidly growing sector
China water supply
8% World freshwater but 22% of World population
66% cities don't have enough water all year
60% freshwater contaminated
Abstraction
Removal of water from rivers/ groundwater stores (Aquifers) - can cause saltwater incursion
Saltwater Incursion
Movement of saline water into freshwater aquifers due to water tables lowering, reducing pressure and pulling seawater into Aquifer
Hard engineering schemes
Structures to increase supply (megadams, water transer and desalination plants)
Soft engineering schemes
Work with local people to develop projects that restore water supplies
China water transfer
Issue = North China has water scarcity (particularly Hai Basin) and contains 1/2 population and 2/3 farms
Plan = 1,000km + pipeline that will transport 25 billion m3 water/year from Yangtze
Concerns = $80 billion cost and high maintenance cost, 300,000 displaced people, doesn't address pollution or inefficiency
Water management
Water harvesting jars Uganda with 1,500 litre capacity
Smart irrigation increased water productivity of fruit trees by 60%
Drought mitigation by re/afforestation and wetland restoration
Restore mangroves (Madagascar)
Singapore water management
Issue = abundant rainfall (2,400mm/year) but lack of collection/ storage
Plan = National water agency (PUB) imports water from Malaysia until 2061, NEWater recycled water fills 30% demand, more water collection through drains, canals, rivers and ponds
Integrated drainage basin management
Aim to establish framework for co-operation between all administrations and stakeholders with agreed policies and strategies
E.g 1956 Colorado River management = cover river regulation, HEPs, water rights and irrigation