Chapter 18 – Population and Evolutionary Genetics
1/84
There's no tags or description
Looks like no tags are added yet.
Name | Mastery | Learn | Test | Matching | Spaced |
|---|
No study sessions yet.
85 Terms
Mendelian population
A group of interbreeding, sexually reproducing individuals that have a common set of genes.
Gene pool
Set of all genes in a population
A great deal of variation exists at the molecular level, owing in part to the redundancy of the genetic code, which allows different codons to specify the same amino acid. Thus
two members of a population can produce the same protein, even if their DNA sequences are different.
genotypic frequency
Proportion of a particular genotype within a population
𝑓(𝐴𝐴)=𝑁𝑢𝑚𝑏𝑒𝑟 𝑜𝑓 𝐴𝐴 𝐼𝑛𝑑𝑖𝑣𝑖𝑑𝑢𝑎𝑙𝑠 / 𝑛 (𝑡𝑜𝑡𝑎𝑙 𝑛𝑢𝑚𝑏𝑒𝑟 𝑜𝑓 𝑖𝑛𝑑𝑖𝑣𝑖𝑑𝑢𝑎𝑙𝑠)
𝑓(𝐴𝑎)=𝑁𝑢𝑚𝑏𝑒𝑟 𝑜𝑓 𝐴𝑎 𝐼𝑛𝑑𝑖𝑣𝑖𝑑𝑢𝑎𝑙𝑠 / 𝑛
𝑓(𝑎𝑎)=𝑁𝑢𝑚𝑏𝑒𝑟 𝑜𝑓 𝑎𝑎 𝐼𝑛𝑑𝑖𝑣𝑖𝑑𝑢𝑎𝑙𝑠 / 𝑛
The sum of all the genotypic frequencies always equals 1
allelic frequencies
Proportion of a particular allele within a population.
There are always fewer alleles than genotypes, so the gene pool of a population can be described in fewer terms when allelic frequencies are used.
𝐹𝑟𝑒𝑞𝑢𝑒𝑛𝑐𝑦 𝑜𝑓 𝑎𝑛 𝑎𝑙𝑙𝑒𝑙𝑒 = 𝑛𝑢𝑚𝑏𝑒𝑟 𝑜𝑓 𝑐𝑜𝑝𝑖𝑒𝑠 𝑜𝑓 𝑡ℎ𝑒 𝑎𝑙𝑙𝑒𝑙𝑒 / 𝑛𝑢𝑚𝑏𝑒𝑟 𝑜𝑓 𝑐𝑜𝑝𝑖𝑒𝑠 𝑜𝑓 𝑎𝑙𝑙 𝑎𝑙𝑙𝑒𝑙𝑒𝑠 𝑎𝑡 𝑡ℎ𝑒 𝑙𝑜𝑐𝑖
For a locus with only two alleles (A and a), the frequencies of the alleles are usually represented by the symbols p and q. The frequencies can be calculated as follows:
𝑝=𝑓(𝐴)=2𝑛𝐴𝐴+𝑛𝐴𝑎 / 2𝑁
𝑞=𝑓(𝑎)=2𝑛𝐴𝐴+𝑛𝐴𝑎 / 2N
Explain how allelic frequencies can be calculated from the genotypic frequencies
This method is useful if the genotypic frequencies have already been calculated and the numbers of the different genotypes are not available
𝑝=𝑓(𝐴)=𝑓(𝐴𝐴)+1/2𝑓(𝐴𝑎)
𝑞=𝑓(𝑎)=𝑓(𝑎𝑎)+1/2𝑓(𝐴𝑎)
How do we calculate the allelic frequencies from the numbers of genotypes,
we count up the number of copies of an allele by adding twice the number of homozygotes to the number of heterozygotes that possess the allele, then dividing this sum by twice the number of individuals in the sample. For a locus with three alleles (A1, A2, A3) and six genotypes (𝐴1 𝐴1, 𝐴1𝐴2, 𝐴2𝐴2, 𝐴1𝐴3, 𝐴2𝐴3, 𝐴3𝐴3) the frequencies (p, q, and r) of the alleles are:
■ 𝑝=𝑓(𝐴1)=2𝑛𝐴1𝐴1+𝑛𝐴1𝐴2+𝑛𝐴1𝐴3 / 2𝑁
■ 𝑞=𝑓(𝐴2)=2𝑛𝐴2𝐴2+𝑛𝐴1𝐴2+𝑛𝐴2𝐴3 / 2𝑁
■ 𝑟=𝑓(𝐴3)=2𝑛𝐴3𝐴3+𝑛𝐴1𝐴3+𝑛𝐴2𝐴3 / 2𝑁
Hardy–Weinberg law
Principle of population genetics stating that if a population is large, randomly mating, and not affected by mutation, migration, or natural selection, then allelic frequencies of a population do not change and the genotypic frequencies stabilize after one generation in the proportions p2 (the frequency of AA), 2pq (the frequency of Aa), and q2 (the frequency of aa), where p equals the frequency of allele A and q equals the frequency of allele a.
For an autosomal locus with two alleles, the Hardy– Weinberg law can be stated as follows:
Assumptions If a population is large, randomly mating, and not affected by mutation, migration, or natural selection, then
Prediction 1 the allelic frequencies of a population do not change; and
Prediction 2 the genotypic frequencies stabilize (will not change) after one generation in the proportions p2 (the frequency of AA), 2pq (the frequency of Aa), and q2 (the frequency of aa), where p equals the frequency of allele A and q equals the frequency of allele a.
The Hardy–Weinberg law indicates that, when its assumptions are met, reproduction alone does not
alter allele or genotype frequencies, and the allelic frequencies determine the frequencies of genotypes
The statement that the genotypic frequencies stabilize after one generation means
that they may change after the first generation, because one generation of random mating is required to produce Hardy–Weinberg proportions of the genotypes. Afterward, the genotypic frequencies, like the allelic frequencies, do not change as long as the population continues to meet the assumptions of the Hardy–Weinberg law
A population cannot evolve if it meets the Hardy–Weinberg assumptions because
evolution consists of change in the allelic frequencies of a population. Therefore, the Hardy–Weinberg law tells us that reproduction alone will not bring about evolution. Other processes—such as mutation, migration, and natural selection—or chance events are required for populations to evolve.
when a population is in Hardy–Weinberg equilibrium, the genotypic frequencies are determined by ______. The heterozygote frequency never exceeds ___ when the population is in Hardy–Weinberg equilibrium. Furthermore, when the frequency of one allele is low, homozygotes for that allele will be _______
by the allelic frequencies; 0.5; rare, and most of the copies of a rare allele will be present in heterozygotes
a single generation of random mating produces the equilibrium frequencies of
p2, 2pq, and q2.
To determine whether a population’s genotypes are in Hardy– Weinberg equilibrium, the genotypic frequencies expected under the Hardy–Weinberg law must be compared with the observed genotypic frequencies, to do this we…
first calculate the allelic frequencies, then find the expected genotypic frequencies by using the square of the allelic frequencies, and finally compare the observed and expected genotypic frequencies by using a chi-square goodness-of-fit test
Chi-square goodness-of-fit test formula
x2= Σ(Observed-expected)2/ expected
Estimating Allelic Frequencies with the Hardy–Weinberg Law
𝑞= Square root (𝑓(𝑎𝑎))
Before evolution can take place, genetic variation must
exist within a population; consequently, all evolution depends on processes that generate genetic variation. Although new combinations of existing genes may arise through recombination in meiosis, all genetic variants ultimately arise through mutation.
Mutation can infl uence the rate at which
one genetic variant increases at the expense of another.
In G1 → G2 forward mutations ____ increases while __ decreases
G2; G1
In G2 → G1 backwards mutations ___. increases while _____ decreases
G1; G2
Equilibrium
Situation in which no further change takes place; in population genetics, refers to a population in which allelic frequencies do not change.
When the only evolutionary force acting on a population is mutation, allelic frequencies change over time because
some alleles mutate into others. Eventually, these allelic frequencies reach equilibrium and are determined only by the forward and reverse mutation rates.
The Hardy–Weinberg law tells us that when the allelic frequencies reach equilibrium, the genotypic frequencies will
also remain the same.
The mutation rates for most genes are low, so change in allelic frequencies due to mutation in one generation is
very small, and long periods are required for a population to reach mutational equilibrium.
if mutation is the only force acting on a population for long periods, mutation rates will determine
allelic frequencies
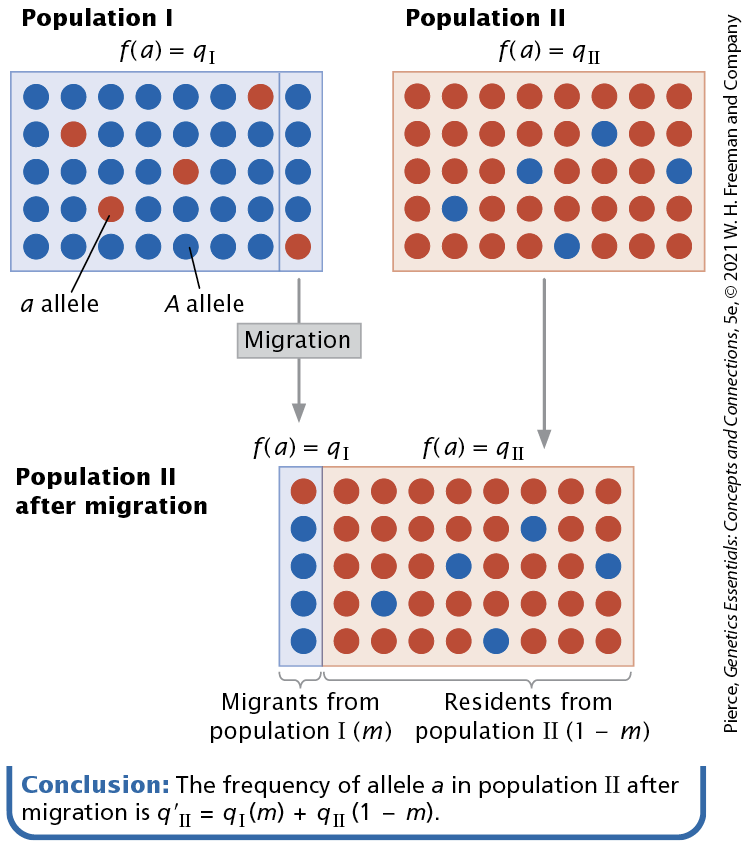
Migration or gene flow
Movement of genes from one population to another
The overall effect of migration is twofold, meaning
It prevents populations from becoming genetically different from on another
it increases genetic variation within populations.
The amount of change in allelic frequencies due to migration between populations depends on the difference between
the populations in their allelic frequencies and on the extent of migration
Migration has two major effects, which are
it causes the gene pools of different populations to become more similar.
Genetic drift and natural selection lead to genetic differences between populations; migration counteracts these evolutionary forces and tends to keep populations homogeneous in their allelic frequencies.
migration adds genetic variation to populations.
Different alleles may arise in different populations owing to rare mutational events, and these alleles can be spread to new populations by migration, increasing the genetic variation within the recipient population.
The smaller the gametic sample, the greater the chance that its composition will
deviate from that of the parental gene pool
sampling error
Deviations from expected ratios due to chance when the sample size is small. May lead to genetic drift
genetic drift
changes in allelic frequencies
The amount of change resulting from genetic drift is determined largely by
the population size (N): genetic drift is higher when the population size is small.
effective population size (Ne)
Effective number of breeding adults in a population; influenced by the number of individuals contributing genes to the next generation, their sex ratio, variation between individuals in reproductive success, fluctuations in population size, age structure of the population, and whether mating is random
a population may be reduced in size for a number of generations because of
limitations in space, food, or some other critical resource
Founder effect
Sampling error that results from the establishment of a population by a small number of individuals; leads to genetic drift.
Genetic bottleneck
Sampling error that arises when a population undergoes a drastic reduction in size; leads to genetic drift.
The Effects of Genetic Drift
produces change in allelic frequencies within a population.
Because genetic drift is random, the frequency of any allele is just as likely to increase as it is to decrease and will wander with the passage of time (hence the name genetic drift).
the reduction of genetic variation within populations. Through random change, an allele may eventually reach a frequency of either 1 or 0, at which point all individuals in the population are homozygous for one allele. When an allele has reached a frequency of 1, we say that it has reached fixation
Fixation
When one allele reaches a frequency of 1 in a population, at which point all individuals in the population are homozygous for one allele
Given enough time, all small populations will become fi xed for one allele or another. different populations diverge genetically from one another over time
Natural Selection
the differential reproduction of genotypes
The effect of natural selection on the gene pool of a population depends on
the fitness values of the genotypes in the population
Fitness
the relative reproductive success of a genotype
selection coefficient(s)
the relative intensity of selection against a genotype
natural selection type 1
Fitness relation: W11 = W12 > W22
Form of selection: Directional selection against recessive allele A2
Result A1 increases, A2 decreases
natural selection type 2
Fitness relation: W11 = W12 < W22
Form of selection: Directional selection against dominant allele A1
Result: A2 increases, A1 decreases
natural selection type 3
Fitness relation: W11 > W12 > W22
Form of selection: Directional selection against incompletely dominant allele A2
Result A1 increases, A2 decreases
natural selection type 4
Fitness relation: W11 < W12 < W22
Form of selection: Directional selection against incompletely dominant allele A1
Result: A2 increases, A1 decreases
natural selection type 5
Fitness relation: W11 < W12 > W22
Form of selection: Overdominance
Result: Stable equilibrium, both alleles maintained
natural selection type 6
Fitness relation: W11 < W12 > W22
Form of selection: Underdominance
Result: Unstable equilibrium
directional selection
Selection in which one allele or trait is favored over another.
overdominance or heterozygote advantage
Selection in which the heterozygote has higher fitness than either homozygote; also called heterozygote advantage.
Underdominance
Selection in which the heterozygote has lower fitness than either homozygote.
Evolution
Genetic change that takes place in a group of organisms.
includes genetic change only. Many non genetic changes take place in living organisms, such as the development of a complex, intelligent person from a single-celled zygote
Evolution as a Two-Step Process
In the first step, genetic variation arises.
Genetic variation has its origin in the processes of mutation, which produces new alleles, and recombination, which shuffl es alleles into new combinations. Both of these processes are random and produce genetic variation continually, regardless of evolution’s requirement for it.
The second step in the process of evolution is change in the frequencies of genetic variants.
The various evolutionary forces discussed in the previous section cause some alleles in the gene pool to increase in frequency and other alleles to decrease in frequency. This shift in the composition of the gene pool common to a group of organisms constitutes evolutionary change.
Anagenesis
evolution taking place in a single lineage (a group of organisms connected by ancestry) over time.
cladogenesis
the splitting of one lineage into two.
When a lineage splits, the two branches no longer have a common gene pool and evolve independently of each other.
New species arise through cladogenesis
Species
different kinds or types of living organisms
The concept of a species has what two primary uses in biology.
A species is a particular type of organism to which a unique name has been given.
For effective communication, biologists must use a standard set of names for the organisms that they study, and species names serve that purpose.
use of the term species is in an evolutionary context
a species is considered an evolutionarily independent group of organisms.
The Biological Species Concept
Definition of a species as a group of organisms whose members are capable of interbreeding with one another but are reproductively isolated from the members of other species. Because different species do not exchange genes, each species evolves independently. Not all biologists adhere to this concept.
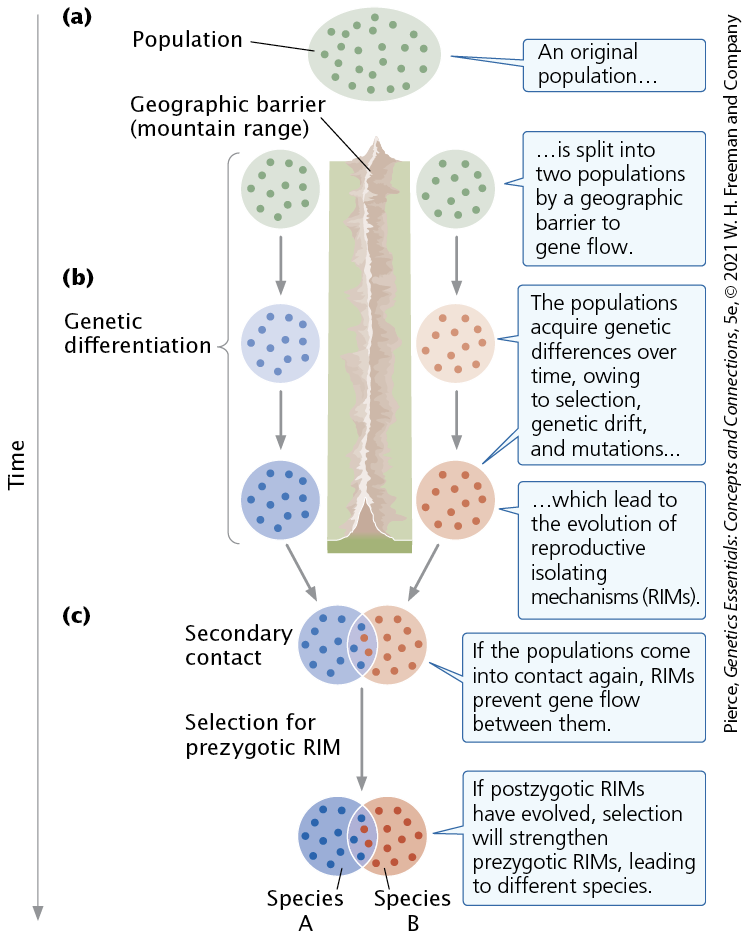
Reproductive Isolating Mechanisms
Any biological factor or mechanism that prevents gene exchange.
prezygotic reproductive isolating mechanisms
Reproductive isolating mechanism that prevents gametes from two different species from fusing and forming a hybrid zygote.This type of reproductive isolation can arise in a number of different ways
types prezygotic reproductive isolating mechanisms and what they do
Ecological: Differences in habitat; individuals do not meet
Temporal: Reproduction takes place at different times
Mechanical: Anatomical differences prevent copulation
Behavioral: Differences in mating behavior prevent mating
Gametic: Gametes are incompatible or not attracted to each other
postzygotic reproductive isolating mechanisms
gametes of two species may fuse and form a zygote, but there is no gene fl ow between the two species, either because the resulting hybrids are inviable or sterile or because reproduction breaks down in subsequent generations
types of postzygotic reproductive isolating mechanisms and what they do
Hybrid inviability: Hybrid zygote does not survive to reproduction
Hybrid sterility: Hybrid is sterile
Hybrid breakdown: F1 hybrids are viable and fertile, but F2 hybrids are inviable or sterile
Speciation
the process by which new species arise
Allopatric Speciation
occurs when a geographic barrier splits a population into two groups and blocks the exchange of genes between them. The interruption of gene flow then leads to the evolution of genetic differences that result in reproductive isolation.
Sympatric Speciation
speciation that arises in the absence of any external barrier to gene fl ow; reproductive isolating mechanisms evolve within a single population.
Phylogeny
The evolutionary relationships among a group of organisms
Phylogenetic tree
A graphical representation of a phylogeny
Branches
the evolutionary connections between organisms.
In some phylogenetic trees, the lengths of the branches represent the amount of evolutionary divergence that has taken place.
Nodes
the points where the branches split; they represent common ancestors that existed before divergence took place. In most cases, the nodes represent past ancestors that are inferred from the analysis
Rooted
When one node represents a common ancestor to all other nodes on the tree
distance approach
evolutionary relationships are inferred on the basis of the overall degree of similarity between organisms.
maximum parsimony approach
infers phylogenetic relationships on the basis of the fewest number of evolutionary changes that must have taken place since the organisms last had an ancestor in common.
maximum likelihood and Bayesian methods
infers phylogenetic relationships on the basis of which phylogeny maximizes the probability of obtaining the set of characteristics exhibited by the organisms.
Maximum likelihood and Bayesian methods incorporate models of how evolutionary change takes place.
Rates of Molecular Evolution
Findings from molecular studies of numerous genes have demonstrated that different genes, and even different parts of the same gene, may evolve at different rates.
Rates of evolutionary change in nucleotide sequences are usually measured as the rate of nucleotide substitution, which is the number of substitutions taking place per nucleotide site per year within a population.
nonsynonymous substitutions
Nucleotide changes in a gene that alter the amino acid sequence of a protein
The rate of nonsynonymous substitution varies widely among mammalian genes
synonymous substitutions
Nucleotide changes, particularly those at the third position of a codon, that do not alter the amino acid sequence of a protein
The rate of synonymous substitution also varies among genes but not as much as the nonsynonymous rate. For most protein-encoding genes, the rate of synonymous substitution is considerably higher than the nonsynonymous rate because synonymous mutations have little or no effect on fitness—that is, they are selectively neutral. Nonsynonymous mutations, on the other hand, alter the amino acid sequence of the protein and, in many cases, are detrimental to the fitness of the organism; most of these mutations are eliminated by natural selection.
Explain the different rates in which the different parts of the gene evolve
The highest rates of substitution occur in those regions of the gene that have the least effect on function, such as the third position of a codon, flanking regions, and introns
The 5′ and 3′ fl anking regions of genes are not transcribed into RNA; therefore, substitutions in these regions do not alter the amino acid sequence of the protein, although they may affect gene expression
Rates of substitution in introns are nearly as high as those in fl anking regions.
The lowest rates of substitution are seen for nonsynonymous changes in exons because these substitutions always alter the amino acid sequence of the protein and are often deleterious.
High rates of substitution occur in pseudogenes, most of which are duplicate copies of genes that have been rendered nonfunctional by mutations, Such genes no longer produce a functional product, so mutations in pseudogenes have little effect on the fi tness of the organism.
neutral-mutation hypothesis (neutral theory)
Proposal that much of the molecular variation seen in natural populations is adaptively neutral and unaffected by natural selection; that is, that individuals with different molecular variants have equal fi tness.
molecular clock
Use of molecular differences to estimate the time of evolutionary divergence between organisms; assumes a roughly constant rate at which one neutral mutation replaces another.
Multigene families
Set of genes similar in sequence that arose through repeated duplication events and often encode different protein products.
Whole-genome duplication can take place through
polyploidy