Demand and Supply curves
1/11
Earn XP
Description and Tags
Name | Mastery | Learn | Test | Matching | Spaced | Call with Kai |
|---|
No analytics yet
Send a link to your students to track their progress
12 Terms
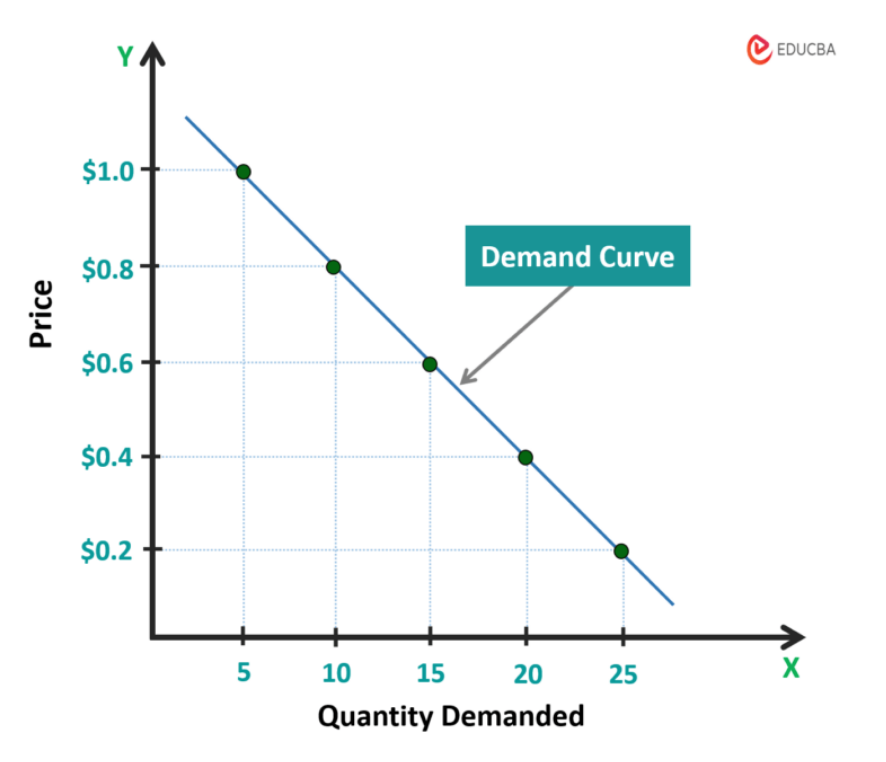
The demand curve
Shows the relationship between the price of a good and the quantity demanded by consumers at those prices, ceteris paribus (all else equal).
Draw a demand curve
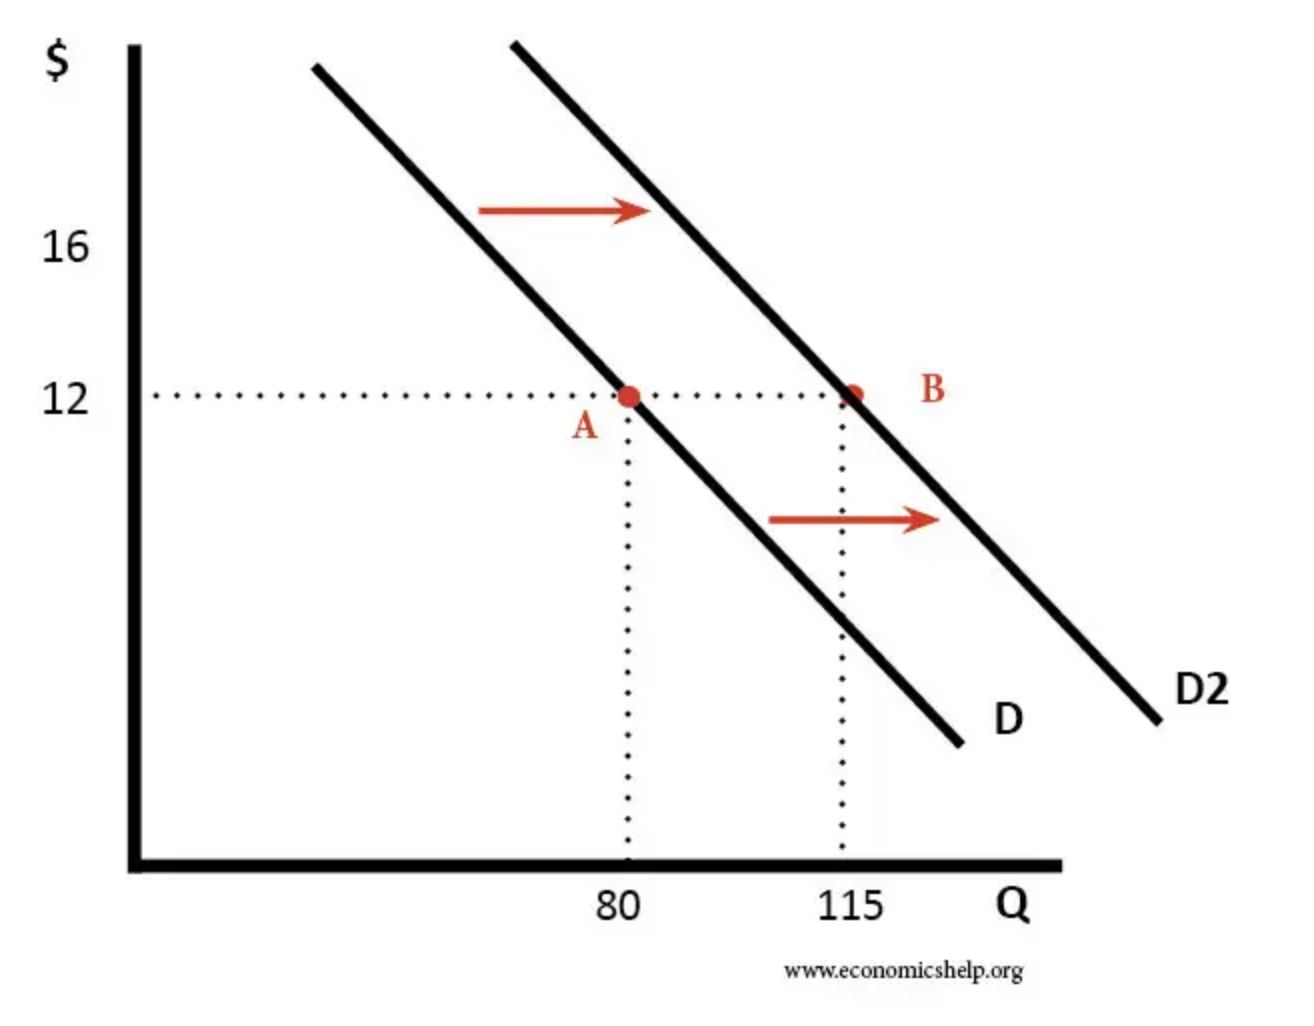
Why does the demand curve shift (in or out)
The entire curve can shift due to factors other than price changes, such as changes in consumer income, tastes, prices of related goods, and expectations.
Draw and label a demand curve showing a outwards shift.
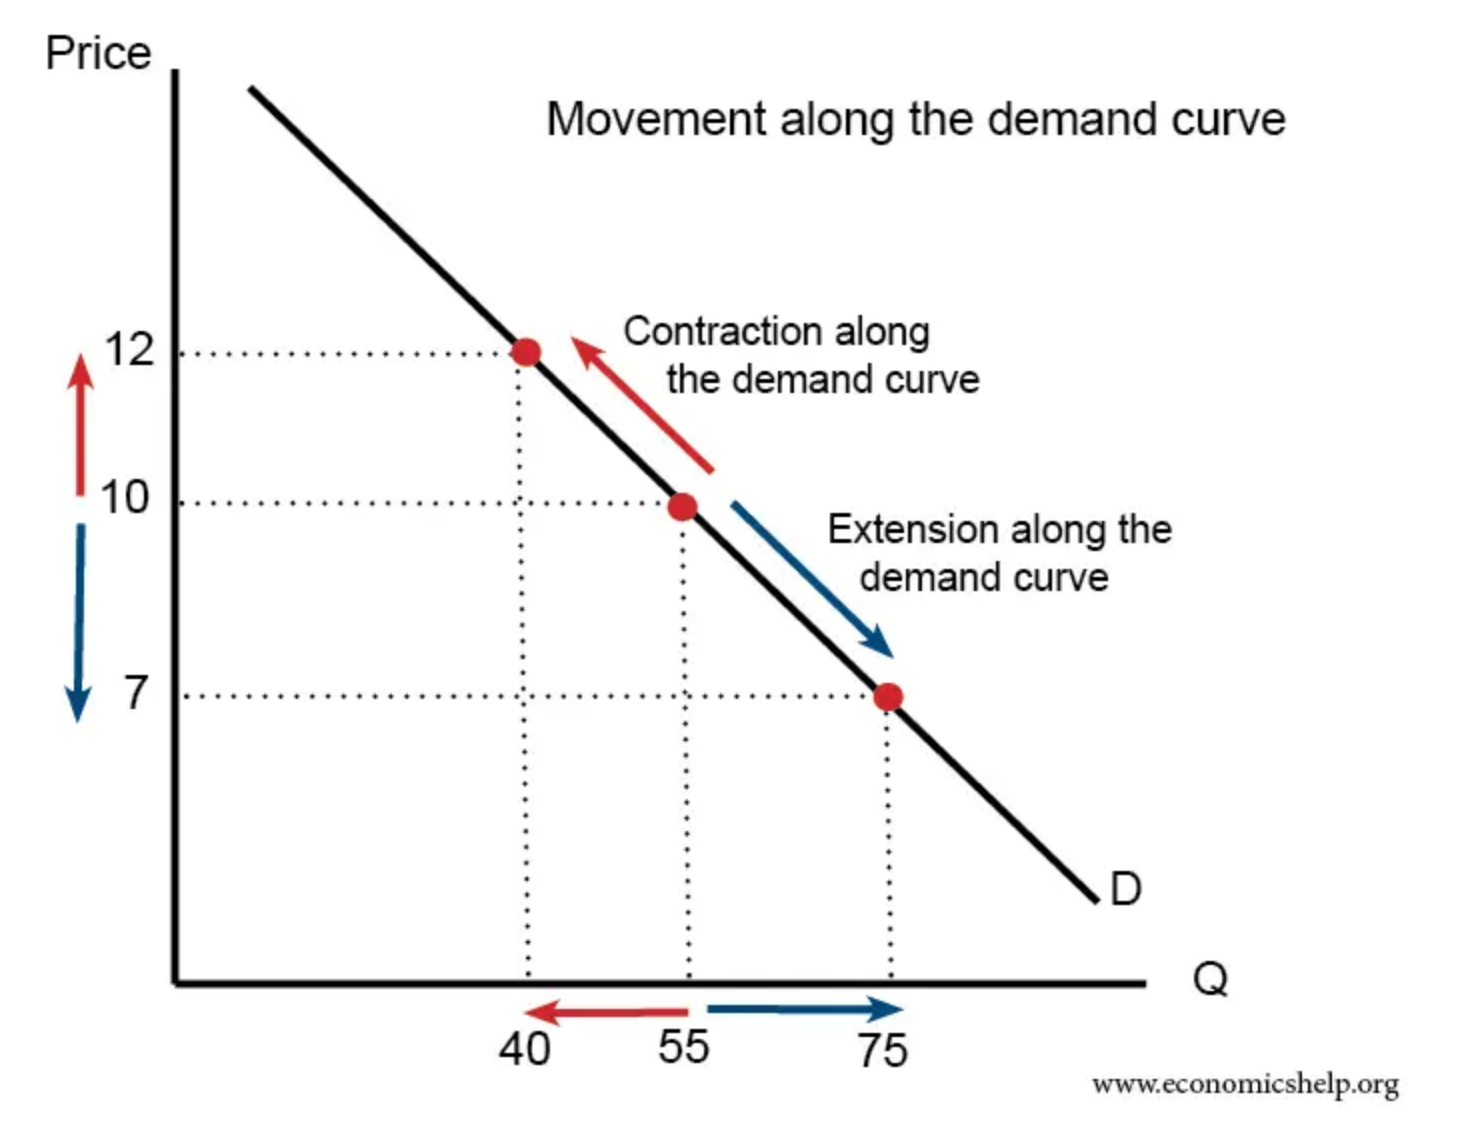
What can cause a movement along the demand curve
A change in price causes a movement along the demand curve. It can either be contraction (less demand) or expansion/extension. (more demand)
Draw a movement in the demand curve (contraction or expansion)
The supply curve
Shows the relationship between the price of a good and the quantity supplied by producers at those prices, ceteris paribus.
Causes of a shift in the supply curve
Changes in production costs, technology, and the prices of inputs.
Draw a supply curve
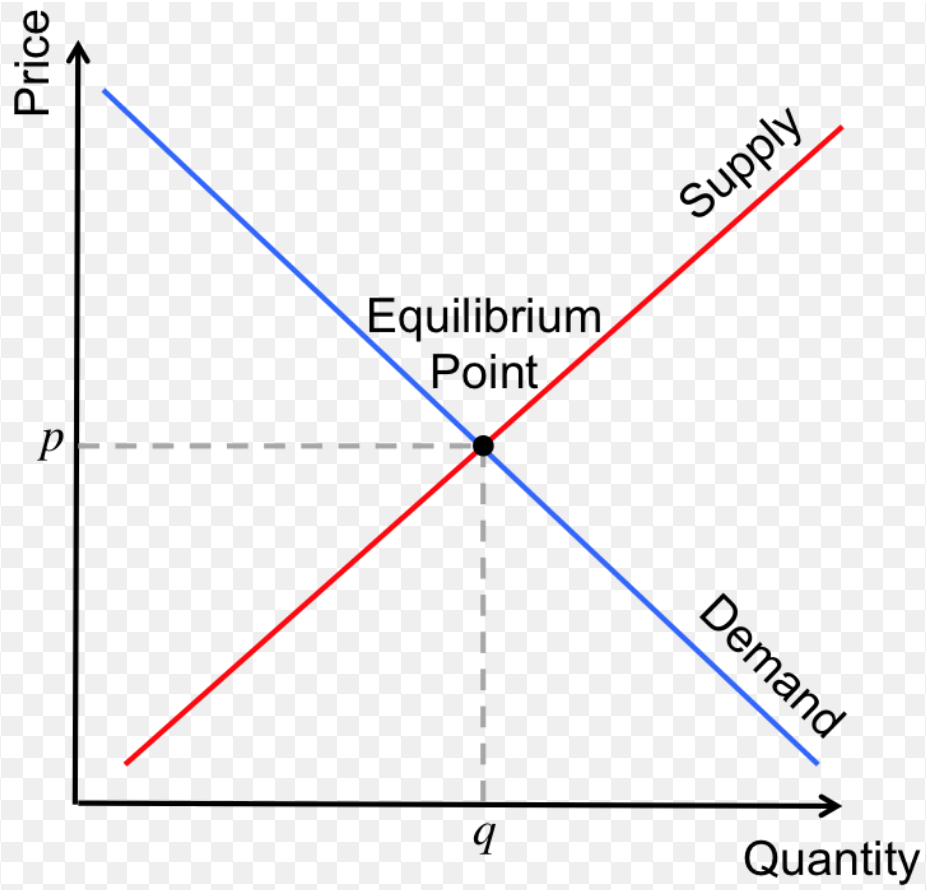
The demand AND supply curve
Show how demand and supply are affected by price and quantity supplied in relation to each other
Equilibrium
The point where the demand and supply curves intersect is the market equilibrium, representing the price at which the quantity demanded by consumers equals the quantity supplied by producers.
Draw a demand and supply curve - mark where the equilibrium is