Discounting future values
1/24
Earn XP
Description and Tags
Week 9
Name | Mastery | Learn | Test | Matching | Spaced |
|---|
No study sessions yet.
25 Terms
What is compounding of interest (annual)?
It is a process to obtain the future value (FV) of monetary value that is invested today.
What is the value of £100 in 2 years’ time, invested at 5% interest compounded annually?
In 1 year, £100 x (1 + 0.05) = £105
In 2 years, £105 x (1 + 0.05) = £110.25 = £100(1 + 0.05)(1 + 0.05)
The FV of £100 today is £110.25
What is the equation for future value (F) of the original investment given by?
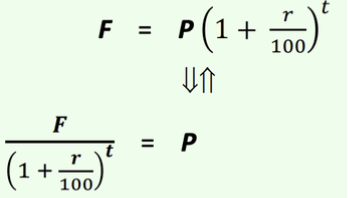
F = P(1 + r/100)^t
Principal £P
Interest rate r% per year
Time period t years
What is discounting?
Is a process to obtain the present value (PV) of monetary value that realises in the future.
What is the discount rate?
Given an FV of £F that is to realise t years from now, the relationship between the PV of £P and the annual discount rate r%
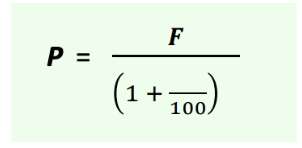
What is the equation for Present Value (PV)?

Find the PV of $100,000 that is to realise in 10 years, using the discount rate
of 5%.
F = $100,00
r = 5%
t = 10 years
P = $61,391.33
What is the equation which links present value and future value?

P = Present value
F = Future value
r = Interest or discount rate per year
t = Number of years
Why do we need to discount Future Value (FV)?
Because we generally do not perceive, e.g., £1,000 that realises today and £1,000 that realises sometime in the future, as equal in value.
Why do we not perceive Present value money and Future value money as equal?
Inflation
Time preferences
Uncertainty
Risks
How are we able to aggregate and compare monetary values with each other?
As the monetary values that realise at different points in time means different from the monetary values that release today FVs must be converted to their PV equivalent.
We assume the same value of r, for both compounding and discounting. Why?
In the private sector, it is typically assumed that they are one and the same, in equilibrium in an investment-savings market.
Who ‘supplies’ money in the Investment-Savings market?
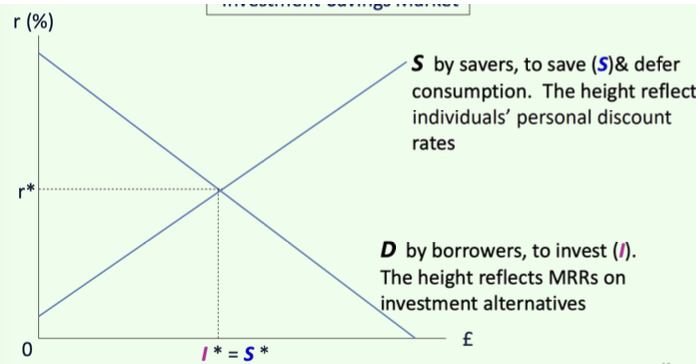
Savers. The price (the interest rate r earned) and quantity supplied (amount saved) are positively related. Savers compare r with their personal discount rates.
Who ‘demands’ money is the I-S market?
Investors. The price (interest rate r they have to pay, to borrow) and the quantity demanded (amount borrowed) are negatively related. Investors compare r with the rate of return on their investment activities, for each additional £ to be invested (Marginal Rate of Return).
What does savers line on the graph show?
To save (S) and defer consumption. The height reflects individuals’ personal discount rates.
What does demand line on the graph show?
To invest (I). The height reflects MRRs on investment alternatives.n
What does a investment saving market graph look like?

What needs to be done to evaluate investment projects by the government?
We need to discount future values and obtain their present values.
Why are discount rates employed in the government?
For the purpose of evaluating public-sector investments are called discount rates.
Do we simply take the I-S market equilibrium interest rate as rate as the social discount rate?
No
What are time preferences to be represented by the social discount rate?
Climate change policies
A nuclear power station
How long does a society continue
What are the risks of public-sector projects?
Time preference of the society
Considerations of risks.
What is the equation for time preference of the society?

What is the equation for consideration of risks?

Should the social discount rate to be employed by governments be lower or high then the private-sectors market interest rates.
Lower