Population Ecology
 Call Kai
 Learn
Learn Practice Test
 Spaced Repetition
 Match
Match Flashcards
1/49

There's no tags or description
Looks like no tags are added yet.
Name | Mastery | Learn | Test | Matching | Spaced | Call with Kai | Chat |
|---|
No analytics yet
Send a link to your students to track their progress
50 Terms
Ecology
The study of the relationships between organisms and their environment.
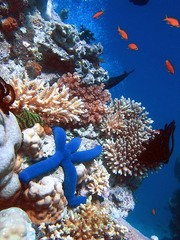
Habitat
The place an organism lives.
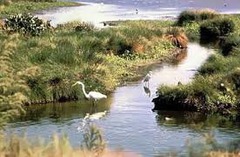
Biotic factor
A living part of the environment.
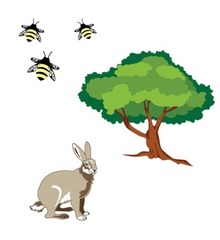
Abiotic factor
A non-living part of the environment.
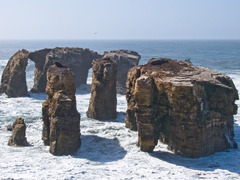
Population
All the organism of one species living in a specific area.
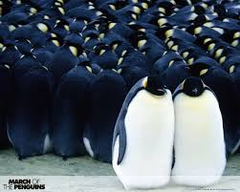
Death rate
The number of deaths in a population in a certain amount of time.
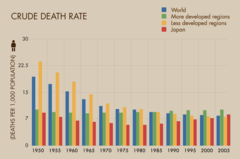
Birth rate
The number of births in a population in a certain amount of time.
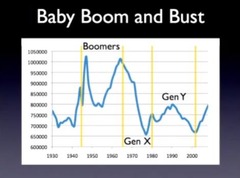
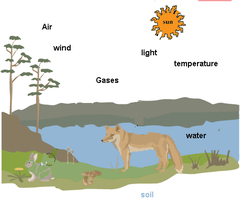
Limiting factors
The resources that organisms need to survive. When unavailable these factors limit a populations' ability to grow/increase.
Example: resources such as food, water or space become limited
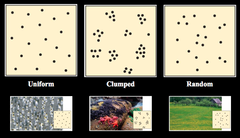
Clumped dispersion
Individuals may live close together in groups in order to facilitate mating, gain protection, or access food resources
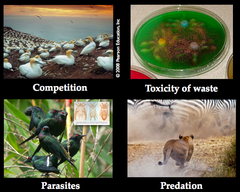
Density-dependent factors
factor that limits a population more as population density increases (competition, disease, predation)
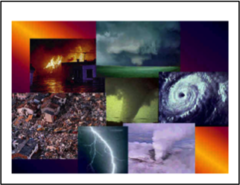
Density-independent factors
factor unrelated to population density that limits a population (natural disasters: fire, flood, mudslides)
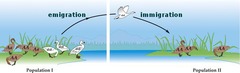
Emigration
Movement of individuals out of an area
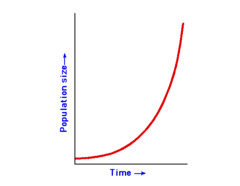
Exponential growth
Population increases by a fixed percentage every year. (J-shaped curve)
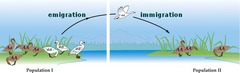
Immigration
Moving into a population
Limiting factor
An environmental factor (biotic or abiotic) that prevents a population from increasing - determines carrying capacity
Logisitic growth
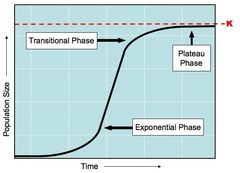
Growth of a population which may be rapid at first, but then levels off at carrying capacity due to limited resources (S-curve)
Population growth rate
explains how fast a given population grows
Random dispersion
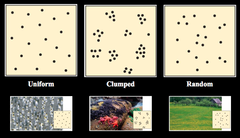
Random spacing of individuals of the same species within an area.
Uniform dispersion
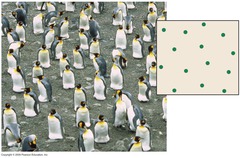
The pattern in which individuals are equally spaced throughout a habitat.
Zero population growth
when the birth rate equals the death rate

3 Types of Distribution
Clumped, Random, Even (uniform)
Reasons for clumped distribution
1) Resources such as food, water, or living spaces are clumped together. 2) A certain social behavior, such as herding animals, flocks of birds, schools of fish or hives of bees.
Reasons for random distribution
Random dispersal may result from seed dispersal by the wind or animals.
(Ex. A forest or a field of wildflowers results from the random dispersal of seeds.)
Birth Rate
the number of births occurring in a given period of time.
Death Rate
the number of deaths in a given period of time.
How will resources be limited during population growth?
1) Food will become more and more scarce.
2)There may be water shortages.
3) A predator might be introduced into the population.
4)The population will run out of space.
5) Additional predators may be attracted to the rising prey population.
6) There will be increased competition between the members of the group.
7) The accumulation of wastes could lead to an increase in diseases and poor health.
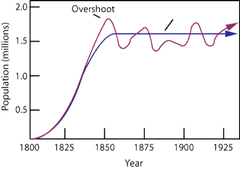
Eventually a growing population will reach this:
The carrying capacity of the environment.
Carrying Capacity
The number of individuals the environment can support over a long period of time.
The two types of limiting factors
Density-Dependent Factors and Density-Independent Factors
At any given time a population may experience these two things:
Growth or decline
Three factors that can greatly increase or decrease the size of a population.
1. The number of births.
2. The number of deaths.
3. The number of individuals that enter or leave the population (immigration or emigration)
Two processes increase the size of the population:
Increased birth rate and immigration
Two processes decrease the size of the population:
Increased death rate and emigration
The two types of population growth models
Logistic and Exponential
If all factors for reproduction and growth are ideal, the population might grow in this way:
Exponentially
This type of growth occurs when the members of the population are reproducing at a constant rate.
Exponential Growth
As the population reaches the carrying capacity, the growth rate does this:
Slows
Density independent Limiting factor - human activity
Due to humans putting increasing amount of greenhouse gases into the atmosphere and cutting down trees that would normally take up some of those gases, the Earth slowly gets warmer and changes climates around the globe
species
a group of organisms that look alike and can reproduce
population
a group of the same species in the same area at the same time
community
all of the populations in a particular area
ecosystem
all of the living things and their physical environments within a particular area
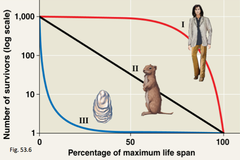
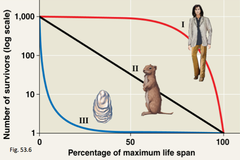
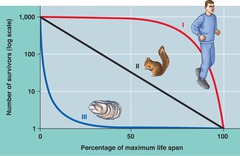
survivorship curve
curves that show how the likelihood of death varies with age
Type 1 survivorship curve
Curve for K-selected populations that have higher mortality rates at older ages. Most individuals survive at young ages and mortality rate increases with age (examples: humans, elephants).
Type II survivorship curve
A pattern of survival over time in which there is a relatively constant decline in survivorship throughout most of the life span (example: many bird species).
Type III survivorship curve
A survivorship curve in which individuals die at very high rates when they are young, but those that reach adulthood survive well later in life (examples: frogs, fish, sea turtles).
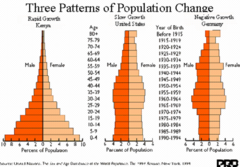
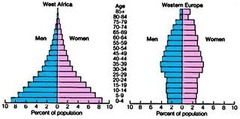
age structure diagram
graph of the numbers of males and females within different age groups of a population
Which age structure diagram shows rapid growth?
West Africa
Which age structure diagram shows stable population growth?
United States
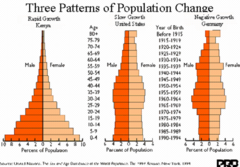
Which age structure diagram shows slowing population growth?
Germany