statistics: 4.3 HYPOTHESIS TESTING
1/15
There's no tags or description
Looks like no tags are added yet.
Name | Mastery | Learn | Test | Matching | Spaced | Call with Kai | Chat |
|---|
No analytics yet
Send a link to your students to track their progress
16 Terms
what questions does inferntial statistics serve to answer? 2 pts
is there any relationship between the variables
are there differences between groups or conditions
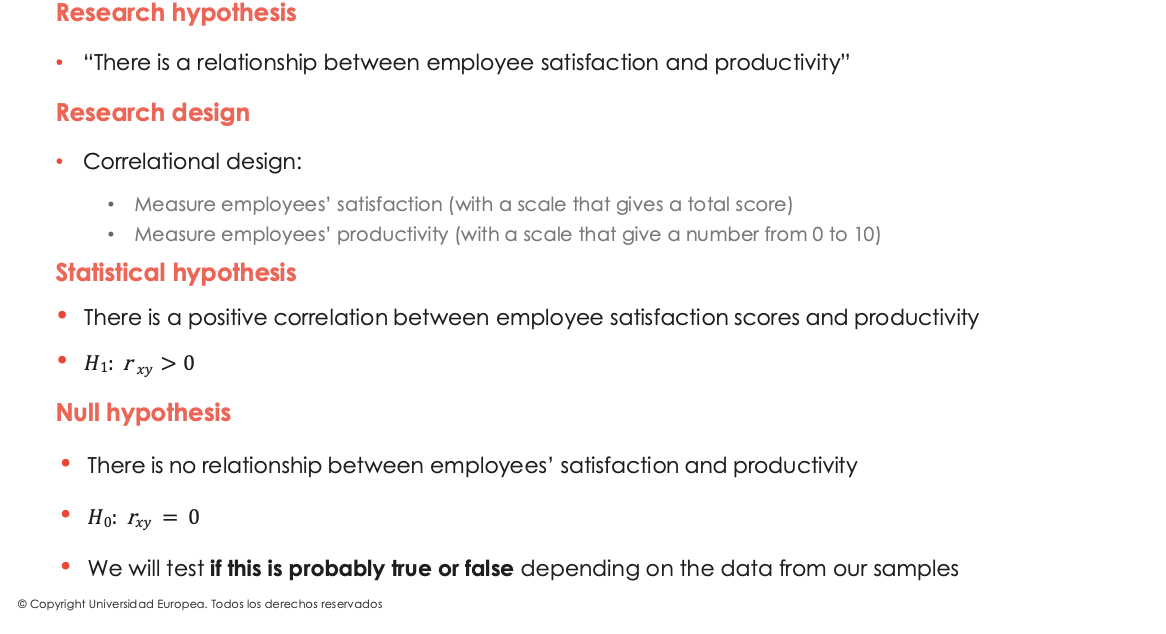
research hypothesis vs statistical hypothesis? 2 pts
research hypothesis- involves making a substantive scientific claim that can be tested (scientific claims)
statistical hypothesis- involves making a statement about the probability distribution of a population value, must be mathematically precise and have a clear correspondence with the research hypothesis, and are specific claims about the population that are expressed formally/mathematically
from research hypothesis to statistical hypothesis? 6 pts
state the research hypothesis
identify the variables
define how the variables will be measured
choose the appropriate statistical test
translate the prediction into statistical language
write the statistical hypothesis
create the null hypothesis and test if it is true or false depending on the data obtained from samples
steps of hypothesis formulation? 2 pts
a researcher has some theory about the world and wants to determine whether or not the data actually supports that theory
the researcher must then create a null hypothesis (after the alt one)
why do we have to create a null hypothesis? 1 pt
because we do not directly rest our hypothesis in stats; instead we try to reject the null hypothesis
null hypothesis vs alternative hypothesis? 2 pts
null- states there is no effect of not variable on another variable
alt- states that there is an effect of one variable on another variable
how to create a statistical hypothesis? 2 pts
there are two scenarios:
values change but you are unsure about how they change (direction of effect is unknown) → run a nondirectional/two tailed test to predict a change in scores or run a directional/one tailed test to predict the direction of scores
variable change and you predict how they change (direction); whether they will increase or decrease
hypothesis testing: decisions and consequences? 2 pts
type 1 error- rejecting a true null hypothesis (false positive)
type 2 error- accepting a null hypothesis (false negative)
what is a test procedure? 2 pts
a rule based on sample data for deciding whether to reject or retain the null hypothesis and requires:
a test statistic
a rejection region (alpha or significance level)
what is a test statistic? 1 pt
a number calculated from a statistical test of a hypothesis that tells us how far a sample result is from what the null hypothesis predicts
what is the purpose of a test statistic? 2 pts
to show how closely our sample data match the distribution under the null hypothesis of that statistical test
used to calculate the p value of your results which helps us decide whether to reject a null hypothesis or not
what is a rejection region? 1 pt
the set of all test statistic value for which the null hypothesis will be rejected; values of the test statistic that we consider to be extreme and inconsistent with the null hypothesis
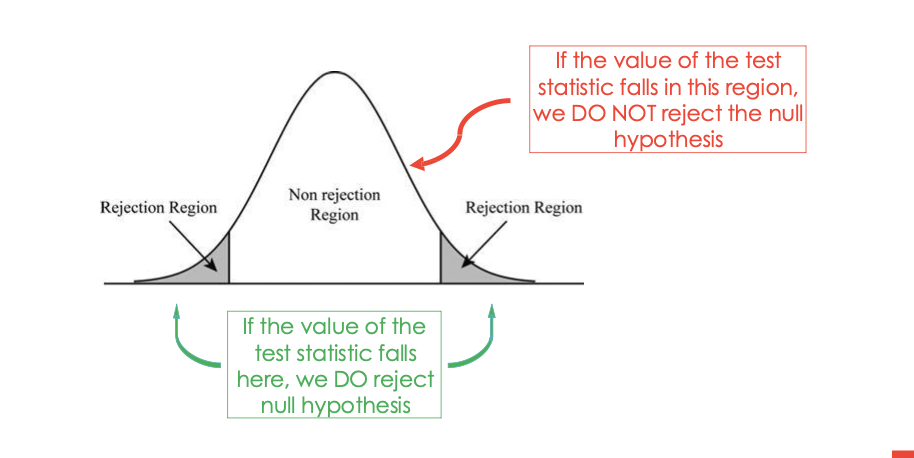
how do we choose the rejection region? 4 pts
we choose a region that minimizes the probability of error in our decision
in general we decide to allow for a 5% chance of error so we choose a rejection region that leaves behind 5% of probability
a statistic in our sample data is chosen to be calculared using statistical software which tells us the the value for the test statisitic and the probability of finding that value if the null hypothesis were true
with that info we can make a decision of rejecting or retaining the null hypothesis
what is alpha value? 1 pt
the probability that we assign to the rejection region, the amount of error that we are willing to tolerate in our decisions; strictiness varies
what is p-value? 4 pts
the probability of our results if the null hypothesis is true; how likely our data is under the hypothesis that there is no effect
the smaller the p value the less likely your data could have occured under if the null hypothesis were true
in order to reject the null hypothesis our p-value should be smaller than or equal to our alpha level e.g. alpha=5% p-value=</=0.5
if the p-value is greater than the alpha value then we acept the null hypothesis
what is the 5% rule in p-values? 2 pts
f the p-value is less than 0.05 (5%), reject the null hypothesis
The 5% level is called the significance level that tells us how much risk a researcher is willing to accept for rejecting a null hypothesis