Unit 1- STATS
1/33
There's no tags or description
Looks like no tags are added yet.
Name | Mastery | Learn | Test | Matching | Spaced | Call with Kai |
|---|
No study sessions yet.
34 Terms
Define population
The collection of all individuals or items under consideration in a statistical study
Define sample
The part of the population from which information is obtained
What is a convenience sample?
in which individuals who are easily accessible are more likely to be included in the sample than other individuals; can’t be generalized
What is a simple random sample?
A sample obtained by simple random sampling
What is an observational study? Can it be generalized to the population?
researchers merely observe and record data, without interfering with how the data arise; If this is done with a random sample, this association can be generalized to the population
What is an experimental study? Can it be generalized to the population?
researchers directly influence how data arise, such as by assigning groups of individuals to different treatments and assessing how the outcome varies across treatment groups; Depends on External Validity
What is a numerical/quantitative variable?
type of variable representing quantities that can be measured with numerical values, and can be subjected to various mathematical operations
What is a continuous variable?
can take any value within a certain range. Examples include height, weight, temperature, and time
What is a discrete variable?
can only take specific, distinct values from a finite set of options. Examples include the number of children in a family, the number of students in a classroom, or the number of pets a household owns
What is a categorical/qualitative variable?
is a type of variable representing qualities or categories that items or individuals can belong to. We can't do math with its data
What is an ordinal variable?
have a meaningful order or ranking. Examples include education levels and customer satisfaction ratings (low, medium, high, or a scale of 1-10)
What is a nominal variable?
represent categories with no inherent order or ranking among them. Examples include gender, eye color, and country of residence
What are Measures of Center?
mean and median
What are measures of spread?
standard deviation and interquartile range
What is a histogram?
A graphical representation that displays the distribution of a dataset by dividing it into a set of contiguous and non-overlapping intervals, know as bins
What does a histogram represent?
the frequency or count of data points falling within each interval, providing insights into the underlying distribution of the data
What is a boxplot?
give visual representation of measures of position and spread using quartiles
Why are the median and IQR referred to as robust estimates?
Because extreme observations have little effect on their values
What is a potential outlier?
An observation beyond the maximum reach of whiskers. It is an observation that appears extreme relative to the rest of the data
Why is it important to look for outliers?
Identify extreme skew in the distribution
Identify data collection and entry errors
Provide insight into interesting features of the data
What is modality?
A distribution is unimodal if it has one peak, bimodal if it has two peaks, and multimodal if it has three or more peaks
What does it mean for a distribution to be symmetrical?
Can be divided into two piece that are mirror images of one another (Ex. Bell shaped, Triangle, and Uniform/or rectangle)
What does it mean if a distribution is right-skewed?
The curve is towards our left; rises to its peak rapidly and comes back toward the horizontal axis more slowly
What does it mean for a distribution to be left-skewed?
The curve is towards the right; rises to its peak slowly and comes back toward the horizontal axis more rapidly
For skewed distribution it is more helpful to use what to describe the center and spread?
Median and IQR
For symmetric distribution it is often more helpful to use what to describe the center and spread?
Mean and SD
What is the relationship between mean and median if the graph is right skewed?
Mean>Median
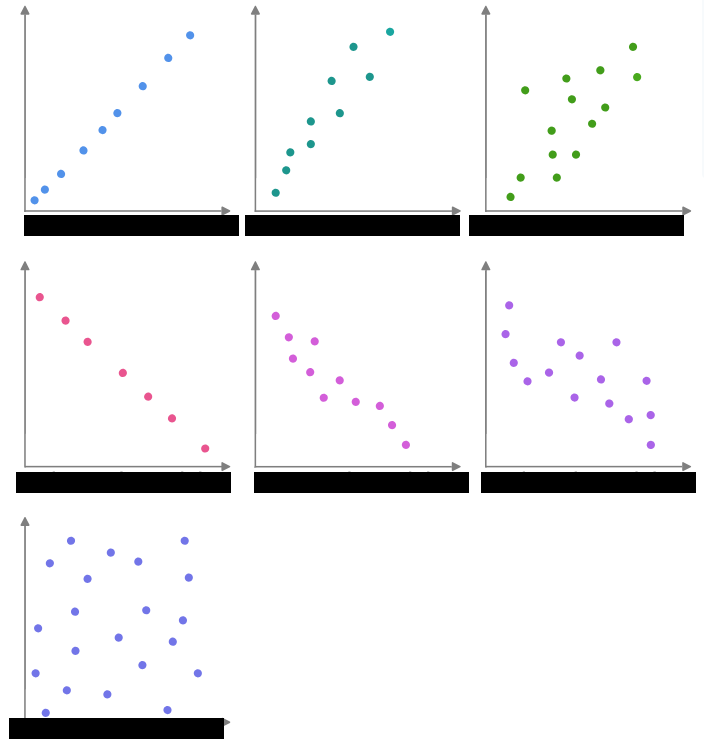
What are the linear relationships in the picture?
Perfect Positive linear correlation
Strong positive linear correlation
Weak positive linear correlation
Perfect negative linear correlation
Strong negative linear correlation
Weak negative linear correlation
No linear correlation (linearly uncorrelated)
What are the properties of Correlation Coefficient?
statistical measure with several key properties: it ranges from -1 to +1, indicating perfect negative, perfect positive, or no linear correlation