FW 453 Exam 1
1/35
Earn XP
Description and Tags
Principles of Wildlife Science NCSU
Name | Mastery | Learn | Test | Matching | Spaced | Call with Kai |
|---|
No analytics yet
Send a link to your students to track their progress
36 Terms
Q: What are the five key elements of Structured Decision Making (SDM) represented by the acronym PrOACT?
Problem: Clearly defining the decision context and scope.
Objectives: Identifying fundamental goals and measurable attributes.
Alternatives: Generating management actions/policies.
Consequences: Predicting outcomes using models/data.
Tradeoffs: Evaluating tradeoffs between objectives to select optimal actions.
Q: Explain the difference between fundamental objectives and means objectives in SDM.
Fundamental objectives: Core reasons for caring about a decision (e.g., "maximize biodiversity").
Means objectives: Strategies to achieve fundamental objectives (e.g., "increase protected habitat area").
Q: What are the four types of uncertainty in decision-making, and which is reducible through adaptive management?
Partial observability (system state uncertainty)
Environmental stochasticity (random variation)
Partial controllability (imperfect action implementation)
Scientific uncertainty (reducible via learning)
Adaptive management specifically targets scientific uncertainty.
Q: Compare passive vs. active adaptive management.
Passive: Implements "best" current model without explicit experimentation.
Active: Deliberately tests competing hypotheses through management actions.
Q: What three components make up Bayesian inference?
Prior distributions: Existing knowledge about parameters.
Likelihood: Probability of observed data given parameters.
Posterior distributions: Updated beliefs combining priors and data.
Bayesian methods formally integrate prior knowledge with new evidence.
Q: Explain Akaike’s Information Criterion (AIC) and its formula.
AIC = -2(log-likelihood) + 2(number of parameters)
Balances model fit against complexity (parameter penalty).
Lower AIC indicates better parsimony. Used for multi-model inference.
Q: What are the three main approaches to hypothesis generation in scientific modeling?
Retroduction: Observing patterns → generating explanatory hypotheses.
Induction: Building generalizations from specific observations.
Deduction: Testing predictions from theoretical principles.
Q: What four characteristics define a high-quality model in conservation biology?
Explicit objectives and boundaries
Transparent assumptions
Incorporates uncertainty
Allows sensitivity testing
Q: What is a consequence table in SDM, and what purpose does it serve?
A matrix comparing how alternatives perform against objectives using measurable attributes. Allows:
Visual tradeoff analysis
Transparent documentation of predictions
Basis for optimization
Q: Name four types of models used in ecological decision-making and their purposes.
Conceptual: Visualize system relationships (e.g., flow diagrams).
Analytical: Mathematical equations describing processes.
Empirical: Data-driven statistical models.
Graphical: Anything we might show in a graph.
Q: What are the key differences between deterministic and stochastic models?
Deterministic: Fixed outcomes for given inputs (no randomness).
Stochastic: Incorporates probabilistic events (e.g., environmental variation).
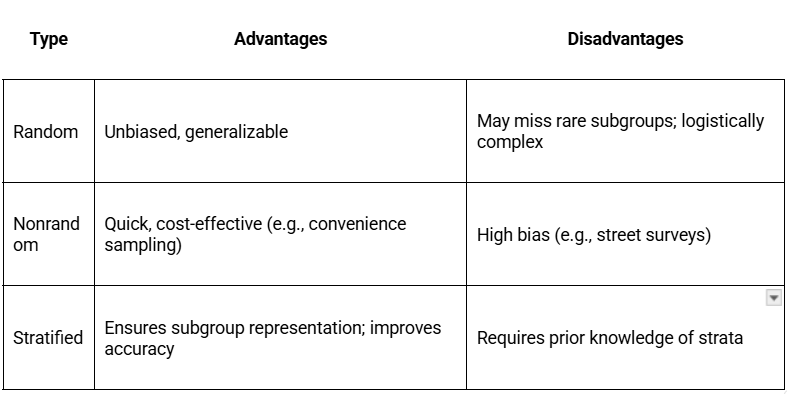
Q: What are the pros and cons of random vs. nonrandom vs. stratified sampling?
Q: Why is sensitivity analysis critical in population viability analysis (PVA)?
Identifies which vital rates (e.g., survival, fecundity) most influence population growth (λ), guiding targeted management. Combines:
Reproductive value
Stable stage distribution
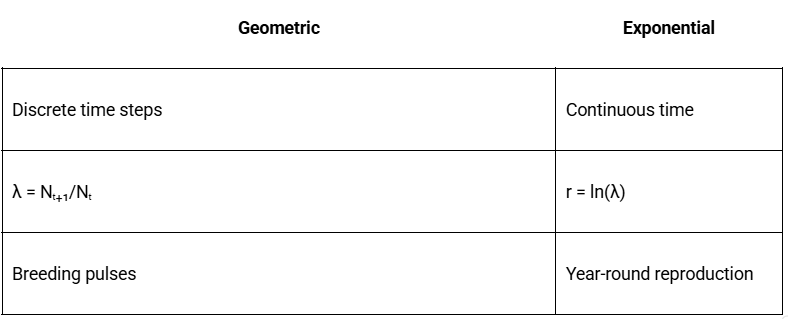
Q: Compare the geometric vs. exponential population growth models.
Q: What is the difference between arithmetic and geometric population growth, and when is each used?
Arithmetic growth adds or subtracts a fixed absolute amount each time step (e.g., +2 individuals per year).
Geometric growth multiplies or divides by a fixed rate each time step (e.g., ×2 each year).
Arithmetic is used when changes are constant in number; geometric is used when changes are proportional, which is typical for populations with discrete breeding seasons.
Q: How do you calculate the geometric growth rate (λ) and what does it represent?
The geometric growth rate (λ) is calculated as the ratio of population size in year t+1 to year t.
λ = (Nt+1)/(Nt)
It represents the proportionate change in population size per time step.
If λ = 1, population size is stable; if λ < 1, population declines; if λ > 1, population increases.
Q: What is the exponential growth rate (r) and how is it related to λ?
The exponential growth rate (r), also called the intrinsic rate of increase, describes continuous population growth.
It is mathematically related to λ by r=ln(λ) and λ=er
r is used for populations with continuous reproduction, like bacteria or rabbits, and is centered around zero, making it easier to compare across time steps.
Q: A population of highly invasive sea lampreys have been invading the great lakes for years. They have shown an annual increase of 25% in abundance per year over the past 4 years. How many lampreys would be expected if this growth of 25% was constant for 4 more years (4 time steps) and we started with 2,000 sea lampreys?
NT = N0(λ)T
NT = 2,000×(1.25)4 = ~4,883 sea lampreys after 4 years
Q: Why is the geometric mean of λ preferred over the arithmetic mean when describing variable population growth?
The geometric mean of λ (or the arithmetic mean of r) better predicts future abundance under variable (stochastic) conditions.
Using the arithmetic mean of λ can overestimate growth when there is variation; the geometric mean accounts for the compounding effects of fluctuating rates.
Q: What is the BIDE equation and what do each of its components represent?
The BIDE equation describes population change:
Nt+1=Nt+B+I−D−E
Nt: current population size
B: births
I: immigrants
D: deaths
E: emigrants
It accounts for both within-population (births, deaths) and among-population (immigration, emigration) processes.
Q: What is the difference between a census, an index, and an estimate in population studies?
Census: Complete enumeration of all individuals; detection probability = 1 (rare in wildlife).
Index: Count or measure that provides a relative scale, assumes equal detection probability across samples, but does not estimate it.
Estimate: A calculated value based on a sample and a model, includes a measure of uncertainty and accounts for detection probability.
Q: What are the main sources of error when estimating population parameters?
Spatial variation: Differences in detection or abundance across locations.
Detection probability: Not all individuals are detected; estimates must account for this to avoid bias.
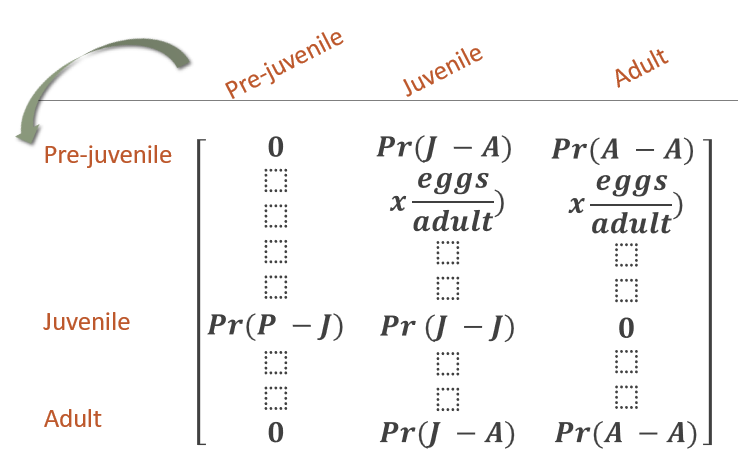
Q: What is a population projection matrix and what do its elements represent?
A population projection matrix is a structured way to project a population forward one time step.
The top row represents reproductive contribution to the next time step (offspring × survival).
Diagonals represent survival and remaining in the same stage.
Sub-diagonals represent survival and transition to the next stage.
Q: What is “reproductive value” in the context of stage-structured population models?
Reproductive value quantifies the relative importance of each stage class to future population growth.
It is a weighted average of present and future reproduction, accounting for survival and growth rates.
Not all stage classes contribute equally to population growth; management should focus on stages with highest reproductive value.
Q: What are transient dynamics, and why are they important in population modeling?
Transient dynamics refer to short-term fluctuations in population size and structure that occur before a population reaches its stable stage distribution (SSD).
Initial conditions (starting stage distribution) can greatly affect early population growth and management outcomes, even in the absence of stochasticity.
Q: What is sensitivity analysis in population modeling, and why is it important?
Sensitivity analysis evaluates how changes in vital rates (e.g., survival, fecundity) affect population growth rate (λ).
It helps identify which life stages or rates have the greatest impact on population growth, guiding effective management actions.
Q: What are the three main approaches to sensitivity analysis in structured population models?
Manual changes: Adjusting input parameters to see effects on outcomes.
Analytical sensitivity and elasticity: Measuring how infinitesimal changes in vital rates affect λ.
Life-Stage Simulation Analysis (LSA): Simulating many scenarios by drawing vital rates from distributions to assess their impact on growth rate.
Q: What is the stable stage distribution (SSD), and why does it matter?
The SSD is the proportion of individuals in each stage class that the population converges to over time, regardless of the initial stage distribution. It determines long-term population structure and growth rate. Short-term deviations from SSD cause transient dynamics
Q: What is positive density dependence (Allee effect), and what are its implications for population growth?
Positive density dependence (Allee effect) occurs when population growth rates increase as density increases, typically at low population sizes. Mechanisms include improved mate finding, predator defense, and foraging success. Below a critical threshold, populations may decline toward extinction
Q: What is negative density dependence, and how does it regulate population size?
Negative density dependence occurs when vital rates (e.g., birth, survival) decrease as population size increases, leading to a decrease in growth rate at high densities and an increase at low densities. It regulates population size by stabilizing it around carrying capacity (K).
Q: What is deterministic chaos in population dynamics, and when does it occur?
Deterministic chaos refers to erratic, unpredictable fluctuations in population size that can occur in discrete logistic models when the intrinsic growth rate (r) is very high (e.g., r>2.69), even in constant environments
Q: What are the three core principles of experimental study design
Control: Minimizes confounding variables by holding conditions constant
Randomization: Reduces bias by randomly assigning units to treatments
Replication: Ensures reliability through repeated measurements or multiple experimental units
Q: Sampling needs to be…
Accurate – leading to unbiased estimates
Repeatable – estimates lead to similar answers
Efficient – do not waste resources
Q: What is "population inertia" in the context of stage-structured population models?
Population inertia refers to the long-term effect on population size caused by an unstable stage structure, resulting in a final population that is larger or smaller than would be expected if the population had a stable stage distribution (SSD).
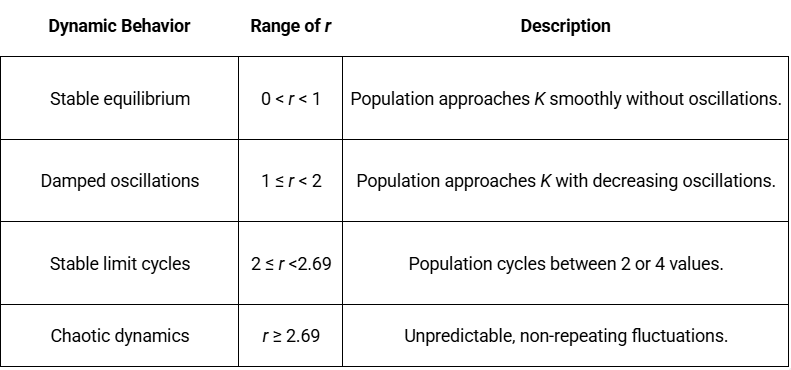
Q: What r values correspond to dynamic behaviors in the discrete logistic growth model?
Q: What are the 4 types of detection models used in distance sampling?
