EQ1- What is human development + why do levels vary from place to place?
1/27
There's no tags or description
Looks like no tags are added yet.
Name | Mastery | Learn | Test | Matching | Spaced |
|---|
No study sessions yet.
28 Terms
How is development traditionally measured?
GDP per capita: High GDP per capita is linked with high life expectancy, health, and development.
-masks income inequality between rich + poor
-doesn’t consider the informal economy e.g. 94% of Uganda’s pop. work in untaxed jobs
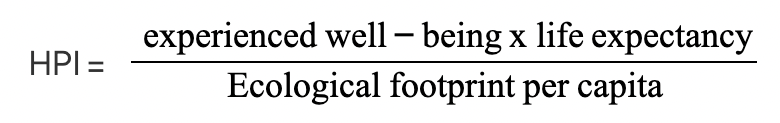
Measure of development- Happy Planet Index
A composite measure of sustainable well-being, considering long-term happiness using limited resources:
well-being: how satisfied people are
life expectancy: how long people live for on average
ecological footprint per capita: amount of land needed to sustain a person’s resource consumption
e.g. Costa Rica places 1st above more developed countries, USA places 122nd below poorer countries like Haiti
Criticisms of the HPI
-well-being is highly subjective
-ecological footprint of less developed countries tends to be lower as people can’t afford many material objects
How are western approaches to development contested?
Shariah law
Islamic law; includes rules on marriage, inheritance, derived from Qur’an teachings
contests human rights as women can be beaten + converting from Islam is punishable by death
Bolivia Law of Mother Earth
Gov. run under an indigenous person (Evo Morales) who proposed law that environment is interconnected with humans- puts nature first.
requires major changes to economy previously based on mining exports, and requires costly ecological investments
contests western economic approaches to development
What is Rosling’s approach to development?
Aim to improve:
environmental quality- vital for well-being of physical + human environment
health + life expectancy- via investment
human rights- empowers people to be economically successful
-can be achieved through economic growth + stable governance, BUT this usually leads to env. degradation e.g. 90% Europeans live in cities exposed to harmful air pollution
Human capital
The collective skills, knowledge + experience that individuals possess in a population, that contribute to productivity.
Importance of education
The main driver of development + a fundamental right to all people.
-at least 4-6% of GDP should be spent on education (UNESCO)
Importance on:
HEALTH: live longer + healthier lives, education on reproductive health lead to higher maternal mortality- ↑ quality of life
HUMAN RIGHTS: knowledge on knowing their rights, participate in decision making.
DEVELOPMENT: skilled workforce (human capital) leads to better jobs + higher wages, knowledge on disaster response + safety.
-in Pakistan, women with high literacy rate earned 95% more than those with none
Barriers to education- why levels vary between countries
Niger + Pakistan example
Gender discrimination
129M girls worldwide without access to education
Niger is 1 of 24 countries that don’t protect rights of pregnant girls to access education
Poverty
Parents prefer children to go work rather than go school
Poor infrastructure + lack of sanitary facilities in school in Niger
Extremism
In 2012, Malala Yousafzai was shot in the head for campaigning for the rights of girls in Pakistan.
Variation in health + life expectancy in developing world
Algeria (N. Africa)- 6% health exp.
LE: 76 years
22/1000 <5 mortality rate
DRC (C. Africa)- 4% health exp.
LE: 62 yrs
76/1000 <5 mortality rate
Why does health + life expectancy vary in developing countries?
Poor healthcare
lower GDP means less investment into healthcare e.g. vaccines, medical training
travel longer to access healthcare (urban areas)
Food insecurity
malnutrition means more susceptible to diseases
Poor access to clean water
waterborne diseases are prevalent e.g. cholera, exacerbated by poor sanitation
Variation in health + life expectancy in developed world
USA- 17% health exp.
LE: 76yrs (could be due to increasing no. of obesity, smoking)
Leading cause of death: heart disease
UK- 12% health exp.
LE: 80yrs
Leading cause of death: dementia/ alzheimers
Why does health + life expectancy vary in developed countries?
Lifestyle choices
smoking, alcohol, saturated fats limit LE + strains healthcare system
in USA+UK, type 2 diabetes affect large %
Deprivation
individual/ community lacks necessities- healthy diet, housing, healthcare
Quality+accessibility of healthcare
countries with ‘free’ healthcare (via taxation) means poor ppl can access services- overall better health
countries with private healthcare provide wider range of effective services
Variations in health + life expectancy- UK
Variation between North + South of England
e.g. Manchester- healthy life expectancy of 55, Richmond-upon-Thames- healthy life expectancy of 70
Variation between socio-economic group
e.g. Men in ‘professional’ group has a LE of 80, whereas those in ‘unskilled’ have LE of 72.7
Reasons for variations
Employment: northern cities that underwent deindustrialisation have lower LE due to exposure to chemicals, physically demanding jobs
Lifestyle: Wales has highest rate of alcohol consumption per day (11%) + rate of obesity (22.5%)
Healthcare: Kensington+Chelsea have lowest cancer deaths (81/100k), also has private hospitals e.g. Royal Marsden who specialise in cancer
Variations in health+life expectancy in Australia (Aboriginal)
Aboriginal LE is on avg 10.6yrs lower than non-indigenous for men
quality of life is 2nd worst in the world according to UN
low education level
Reasons for variations of health + LE in Australia (Aboriginal)
use of illicit substances- alcohol, smoking
dispossession of their traditional land
ethnic discrimination + genocide since British colonisation 1788, wasn’t accepted by gov. until 1967
led to poverty as they struggled to access services- education, housing, healthcare
politicians don’t address poor housing problem
How does gov decisions impact social + economic development?
Economic development drives and sustains social development.
gov’s determine how much of the country’s wealth is used to invest in education + healthcare (to improve productivity + skilled workforce)
Types of government + their spending on education (E), healthcare (H)
Full stable democracy (UK- 12% H, 11% E)
Flawed democracy (Romania- 6%, 9%)
Hybrid regime (Kenya- 4%, 5%)
Authoritarian gov (Russia- 8%, 9%)
Full stable democracy
gov is elected + there are laws to protect human rights
market economy
focus on citizen’s well-being
high gov spending on education, healthcare
more social development
Flawed democracy
election often rigged
gov doesn’t fully protect individual rights + freedoms
priority on economic development e.g. infrastructure
citizens pay more for healthcare+welfare
Hybrid regime
some characteristics of democracy but opposition is weak
little respect for political + civil rights
gov have a range of spending priorities
due to lack of funding, social services may not be effective
Authoritarian gov
country run by elite
population obedient to state
allocate small budget to healthcare+education, more to defence+security, economy, controlling the pop.
IGO’s role in promoting development in health + human rights
IGO’s believe improving economic development enables advancements in social development.
have often promoted neo-liberal views: free trade, capitalism, deregulation, privatisation
more recently focused on social development programmes: environment, health, education, human rights
World Bank in promoting development
Economic + Social/environmental
Economic
provides financial + technical advice to developing nations
promote economic growth to alleviate poverty
low/no interest loans issued
Social+environmental
founding member of the Global Partnership for Education(GPE): invests in early childhood education esp. disadvantaged, helps develop numeracy + literacy
climate change action plan: help developing nations develop renewable energy + achieve food security e.g. low cost solar Taxis in Ivory Coast
WTO in promoting development
Economic + Environmental
Economic
reduce barriers to trade+promote free trade
ensure trading nations keep to agreed international trade rules- enforce sanctions
-has led to environmental degradation: rainforests, water pollution
Environmental
challenge trade agreements which may impact climate change e.g. forest clearance
restrict international movement of species that are potentially harmful/ endangered
IMF in promoting development
Economic + Social
Economic
allow currency to be exchanged freely + easily between members
-criticised in the past: lending with attached conditions e.g. forced privatisation, putting financial concerns over spending on health+education
Social
moved attention to poverty reduction programme
gov.’s develop their own poverty reduction strategies
donor countries to choose nations that have good poverty reduction policies + stable gov
Success of Millennium Development Goals (MDG’s)
(2000-2015)
Goal | Target | Progress |
eradicate extreme poverty | reduce by half | extreme poverty rate 14% |
promote gender equality | women’s equal employment in national parliament | parliamentary representation +90% |
ensure environmental stability | land area covered by forest increase by 20% | land covered by forest 14% |
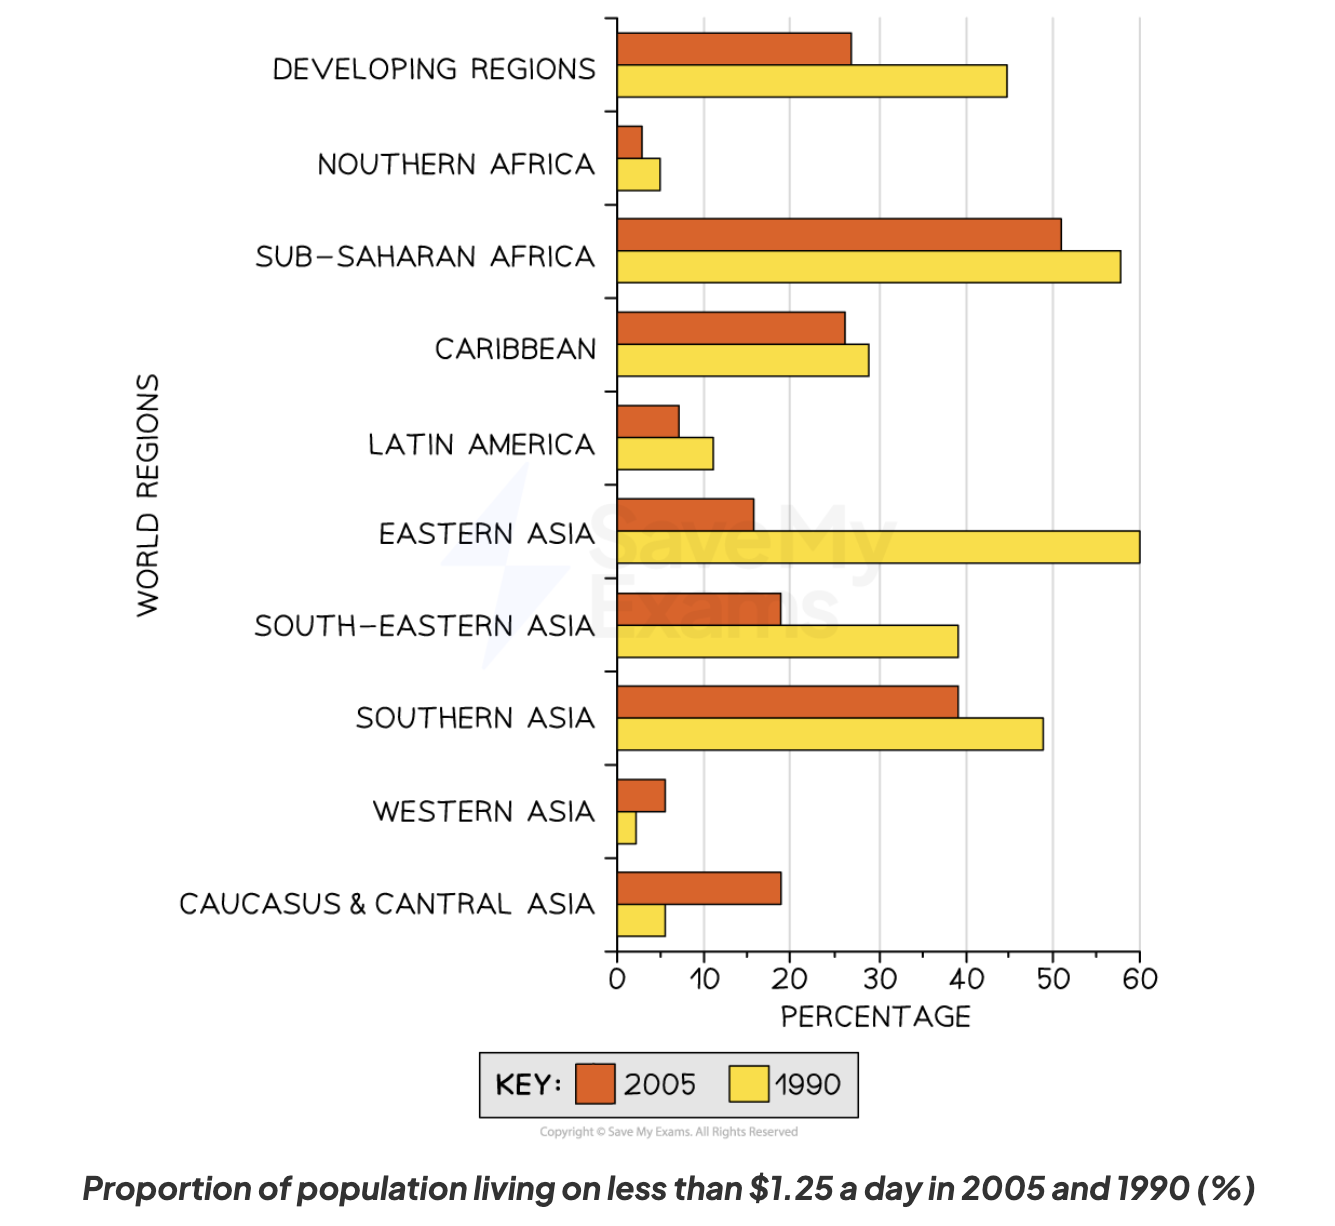
progress was uneven, esp. Sub-Saharan Africa, e.g. for poverty goal:
significant reduction in global poverty, except Central + Western Asia
great reduction in E+SE Asia
Success of Sustainable Development Goals (SDG’s)
(2015-)
SUCCESS | NOT |
|
|
replace + build on MDG’s to be achieved by 2030 as part of sustainable development- for ALL countries