chapter 4: central tendency and variability
1/27
There's no tags or description
Looks like no tags are added yet.
Name | Mastery | Learn | Test | Matching | Spaced |
|---|
No study sessions yet.
28 Terms
what is central tendency?
it is a descriptive statistic that represents the centre of a data set, ( a value that all the other data seem to be gathering around)
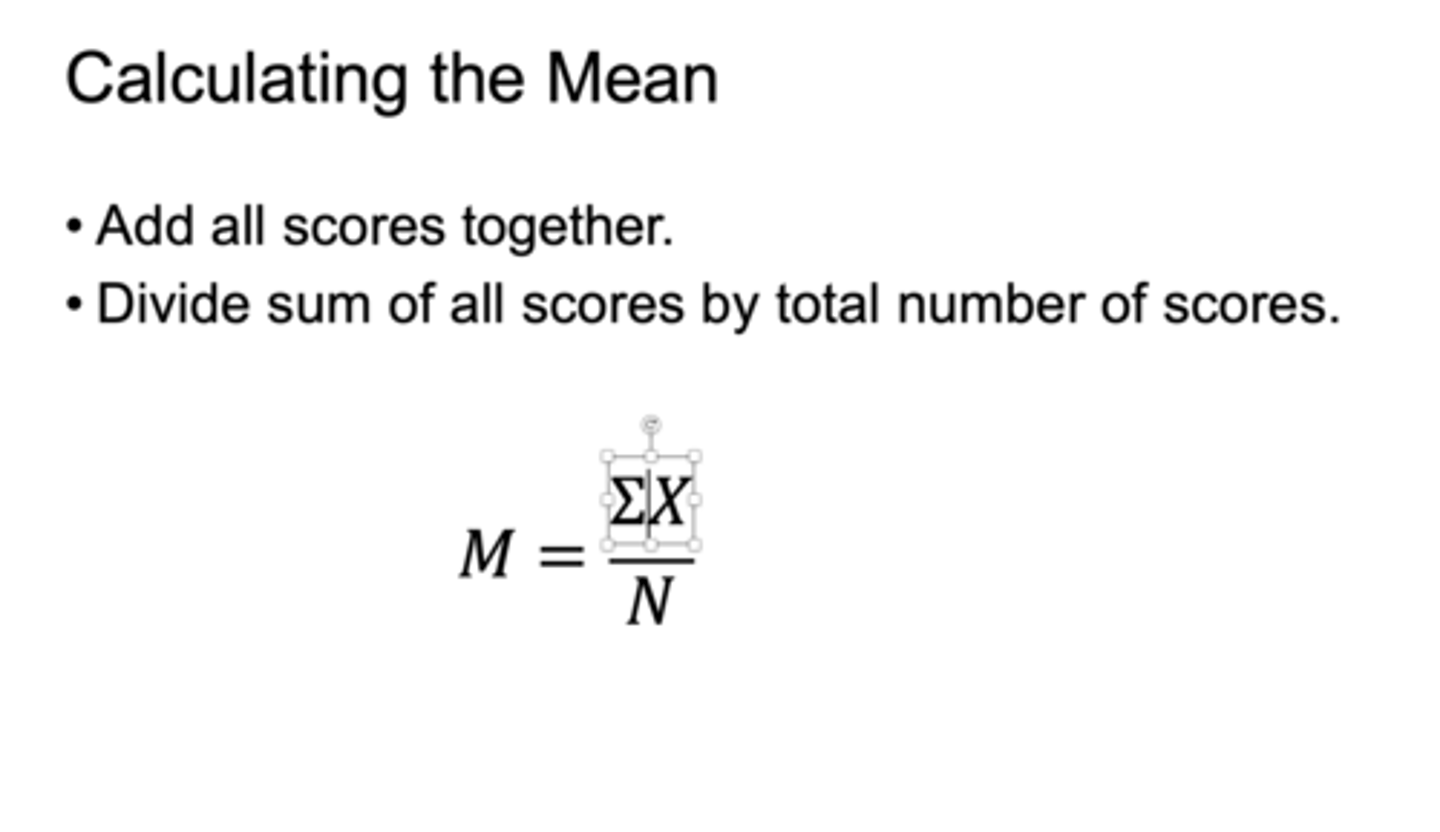
what is the mean?
how do you calculate the M?
a) arithmetic average
b) adding all the scores together and dividing by the total number of scores
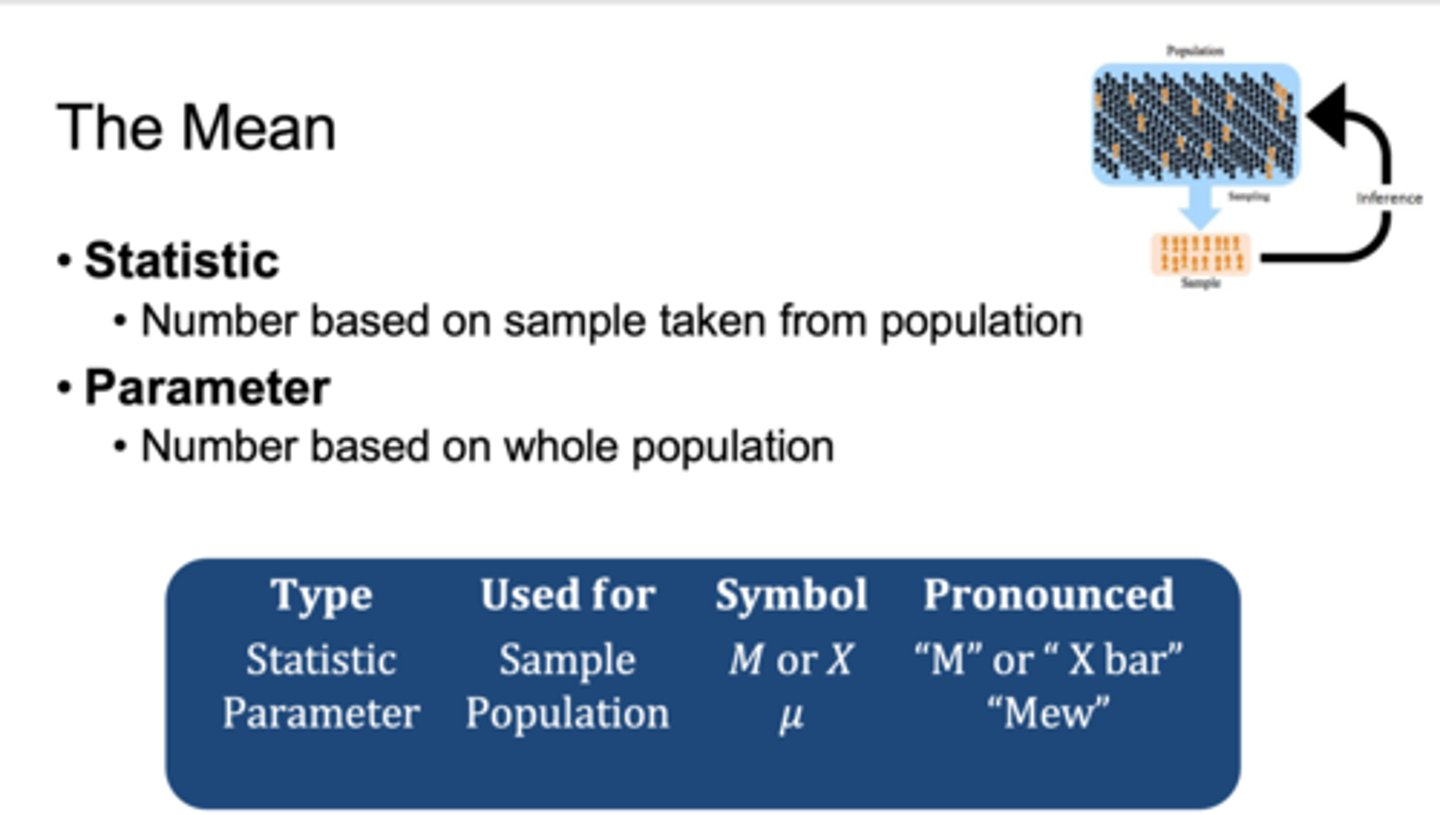
The mean of a sample is an example of a ___________, whereas the mean of a population is an example of a __________, the symbols depend on whether we are referring to the mean of a sample or a population
S=S or P=P
a)sample = statistic
b)population = parameter
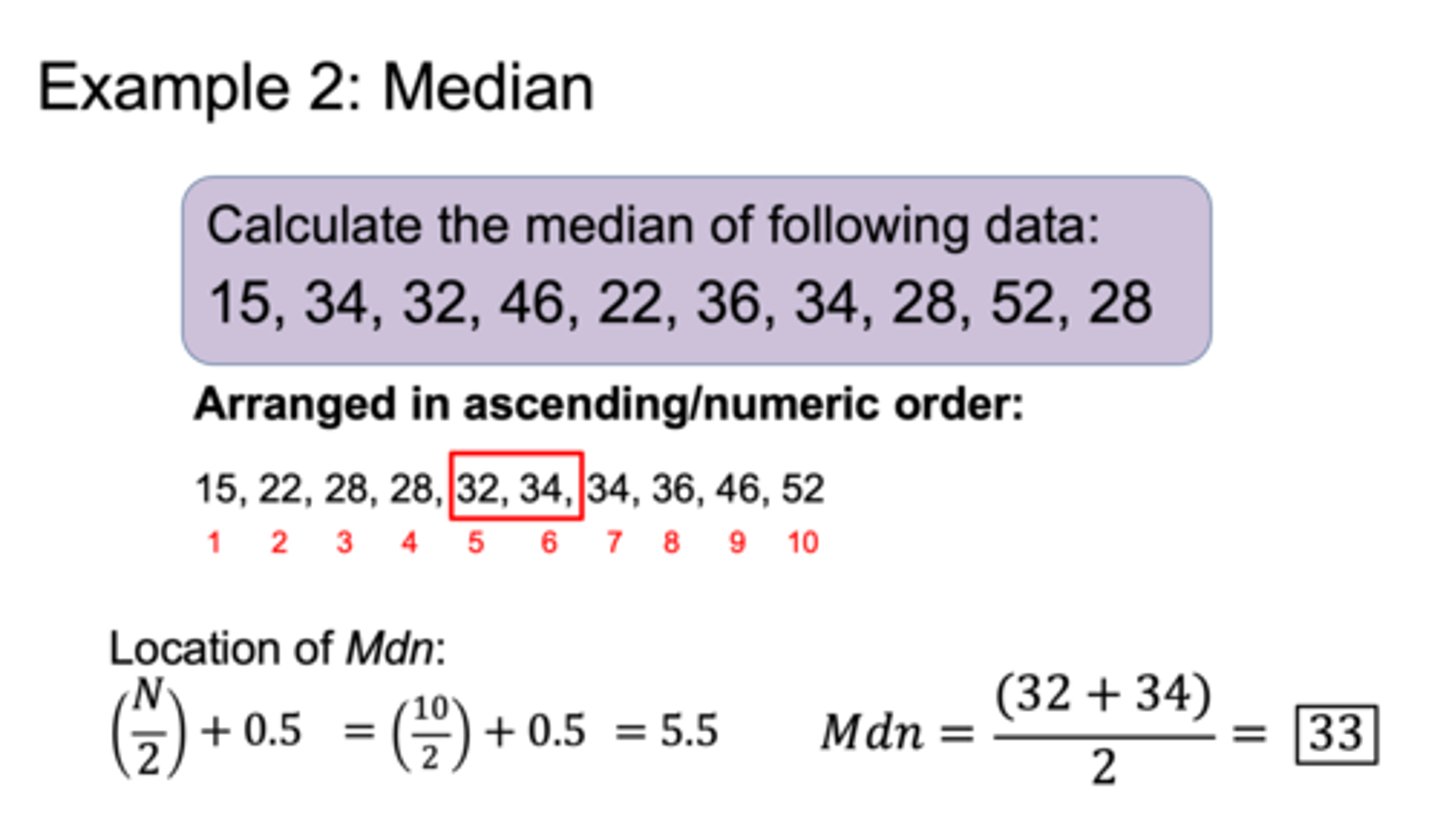
what is the median score?
how do you calculate it?
a) is the middle score of all scores in a sample when the scores are all arranged in ascending order (if there is no middle score, then the median is the mean of the two middle scores)
b) arrange in ascending order, find the middle score, when the data is even, you can take the mean of the two middle scores and divide by 2
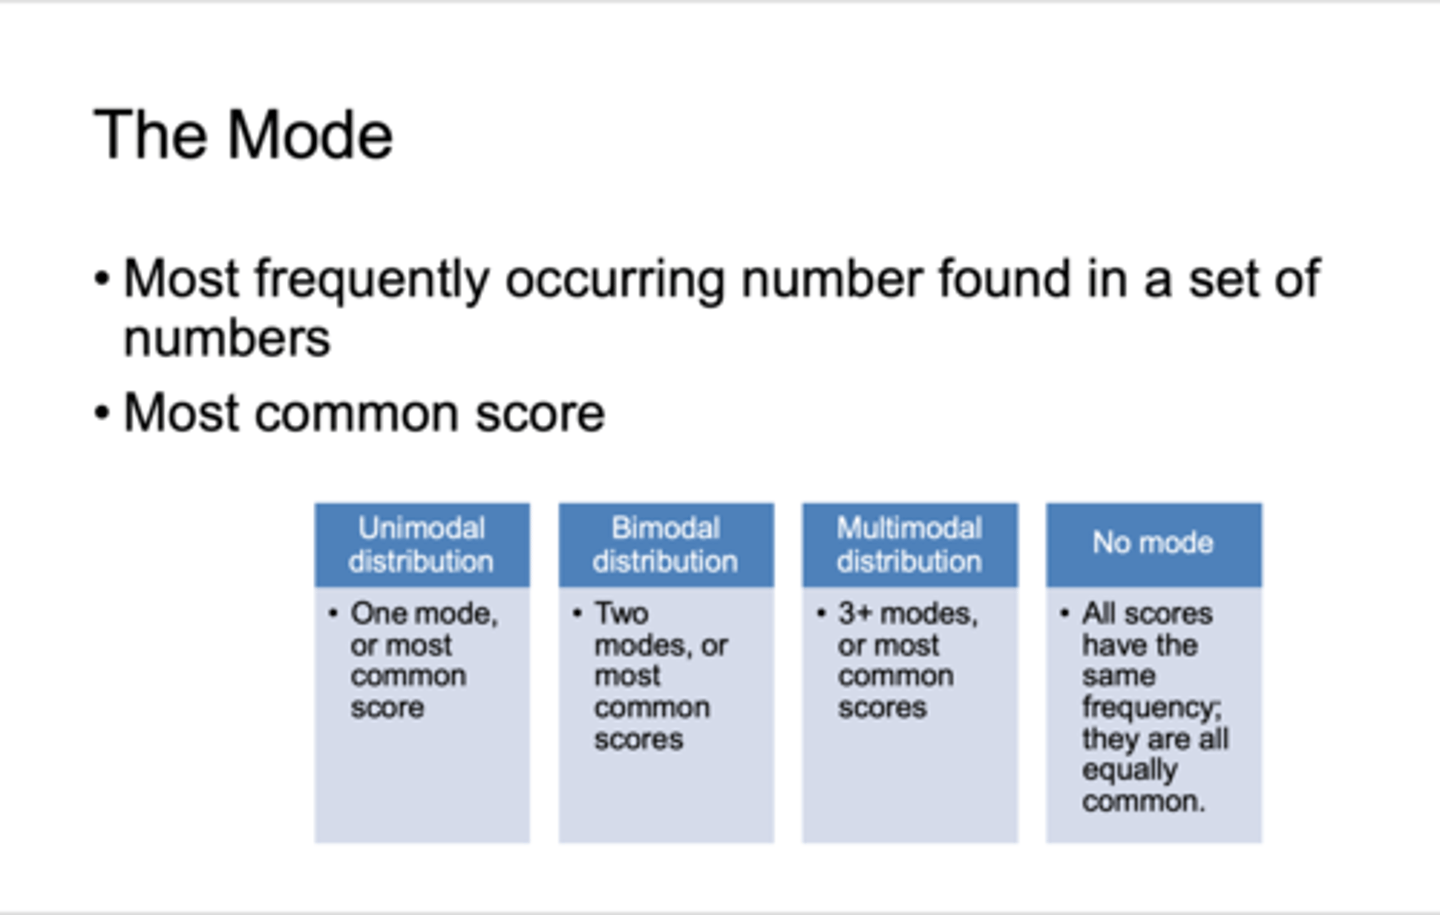
what is the mode?
how do you calculate it?
a) is the most frequent score found in a set of numbers
b) arrange data in ascending order and find the most frequent score or scores
Which measure of central tendency is best?
The choice is usually between the mean and the median. The mean usually wins, but when distributions are skewed by outliers, the median may provide a better sense of a distributions central tendency.
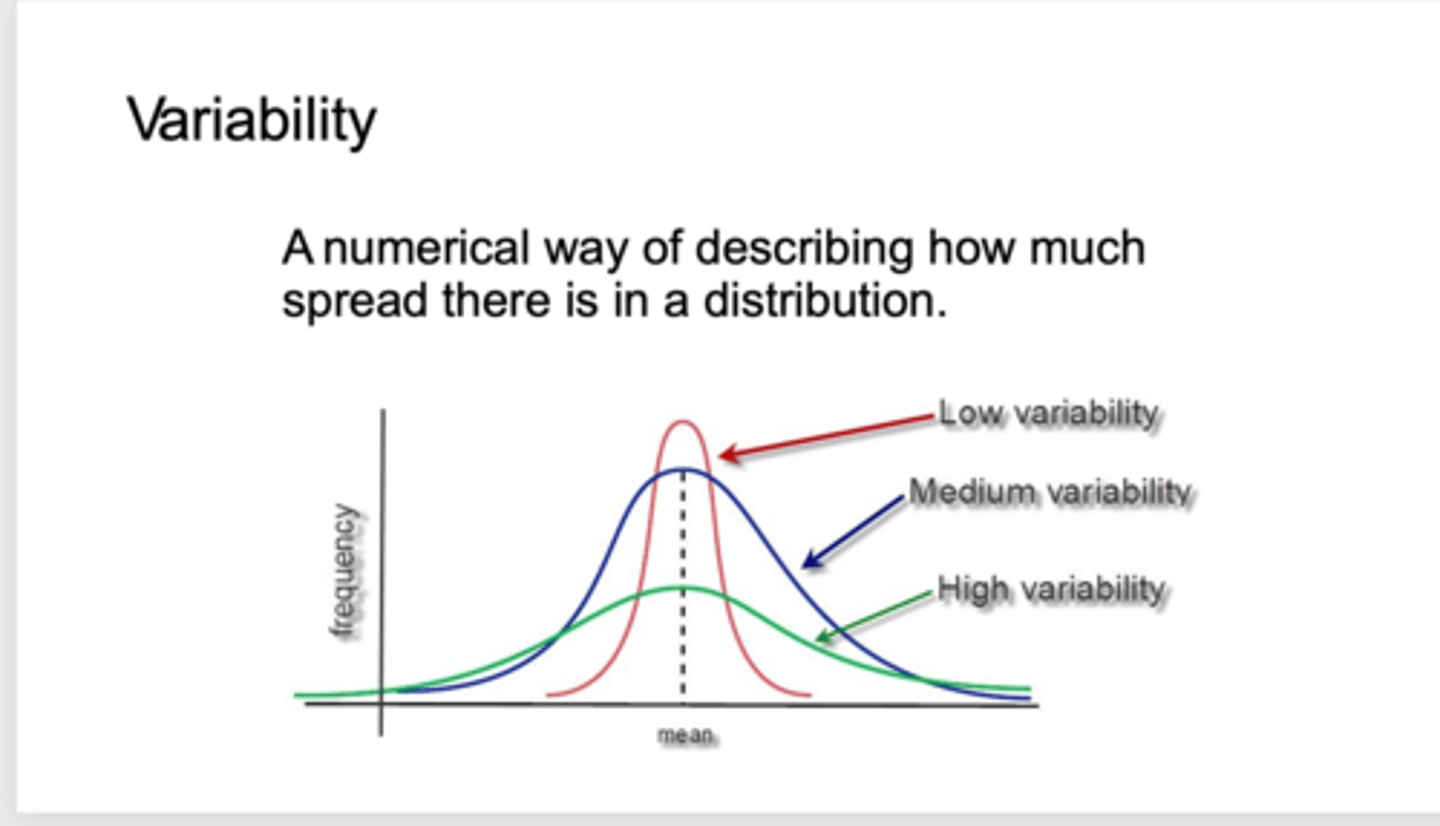
what is variability?
is a numerical way of describing how much spread there is in a data
-green is high variability
-Blue is medium variability
-red is low variability
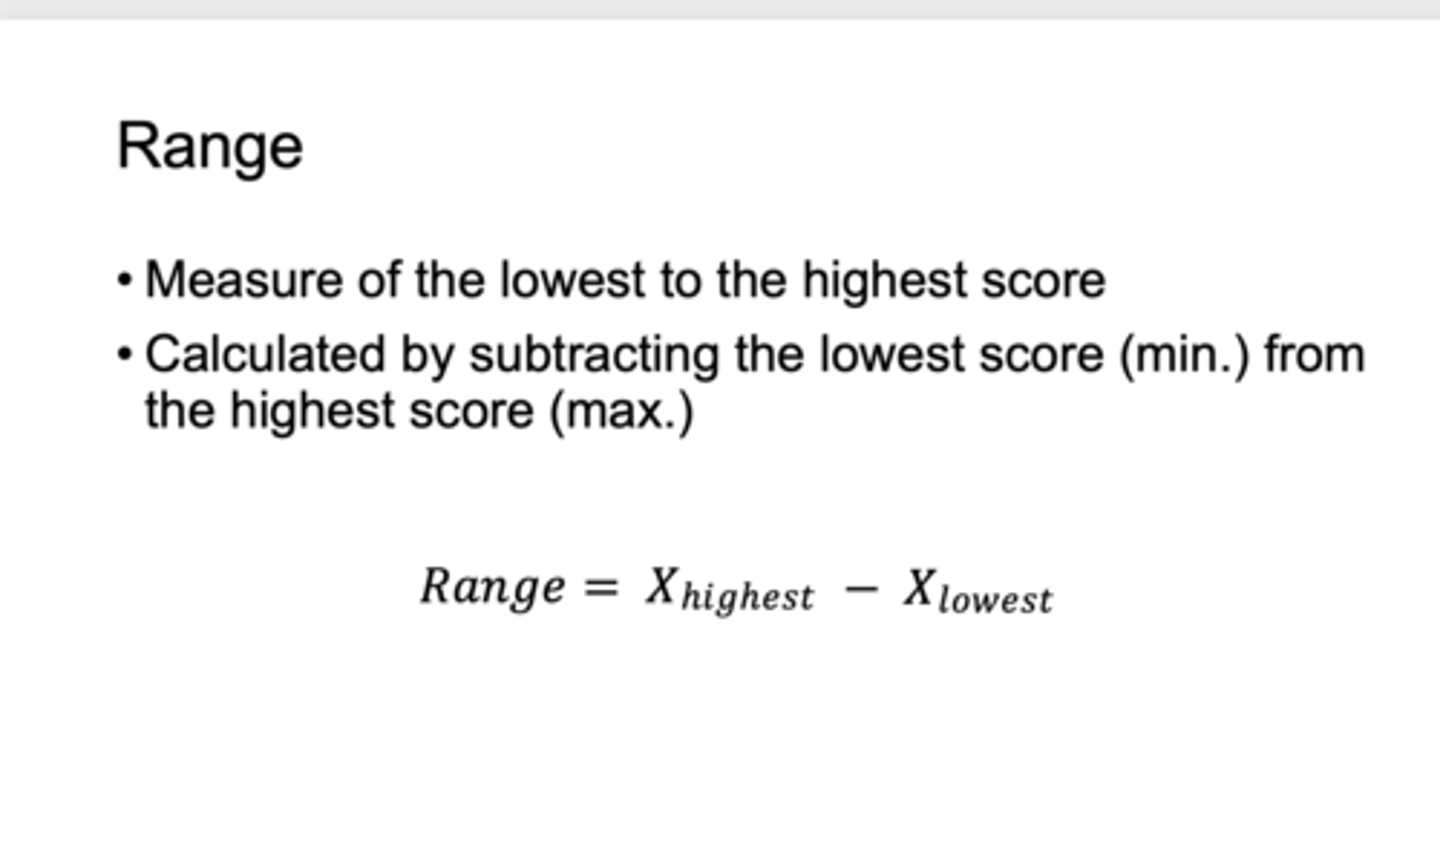
what is the Range?
the difference between the highest and lowest scores in a distribution
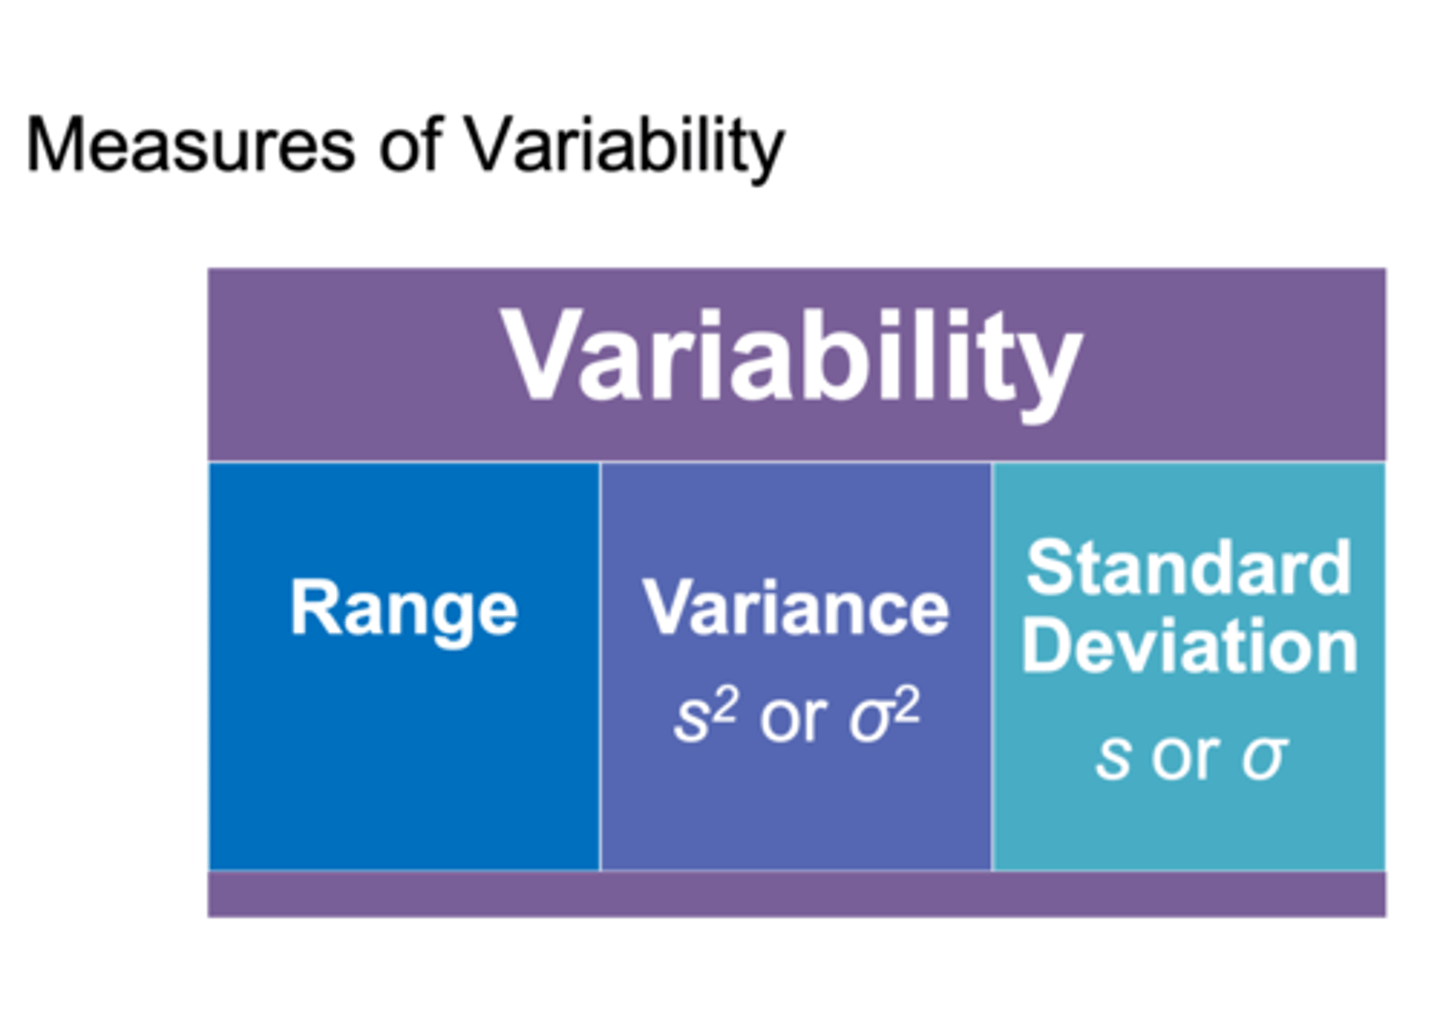
what are the measures of variability?
range, variance, standard deviation
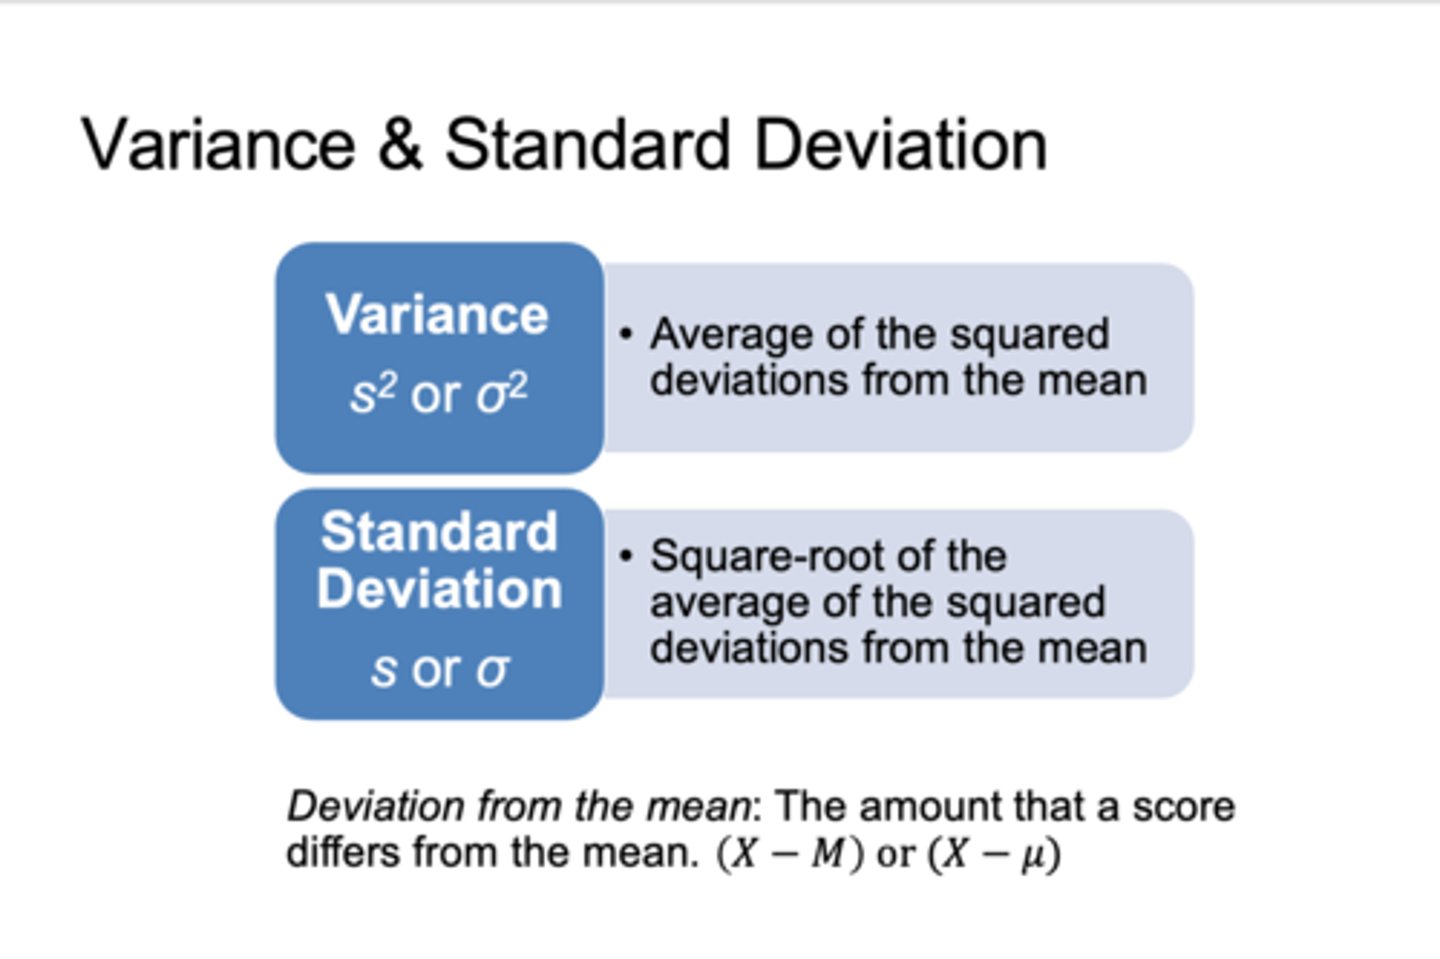
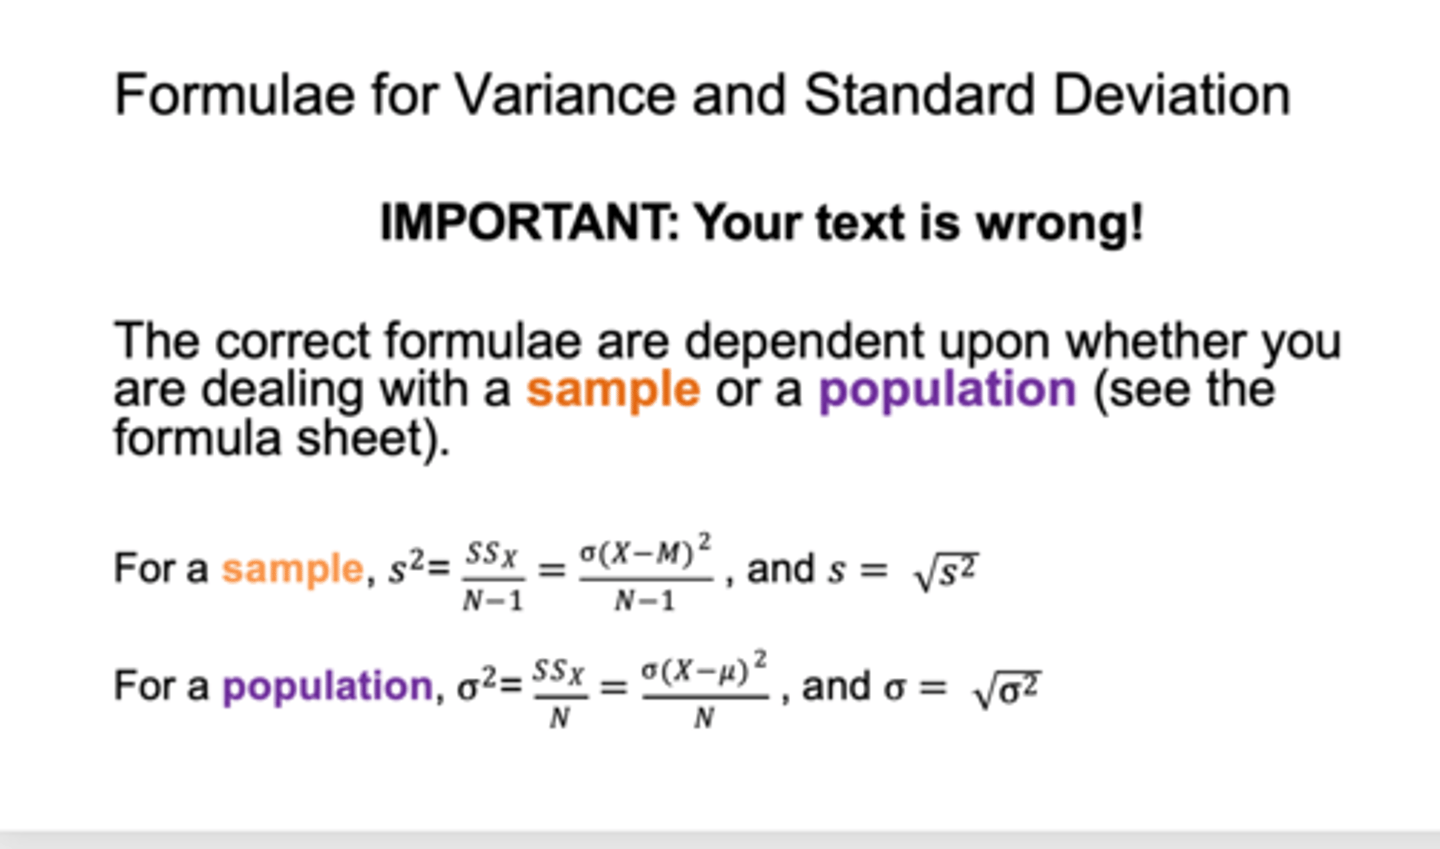
what is a variance?
what is standard deviation?
a) average of the squared deviations from the mean
b) square root of the average of the squared deviations from the mean
formula for variance
when dealing with variance sample and population variance
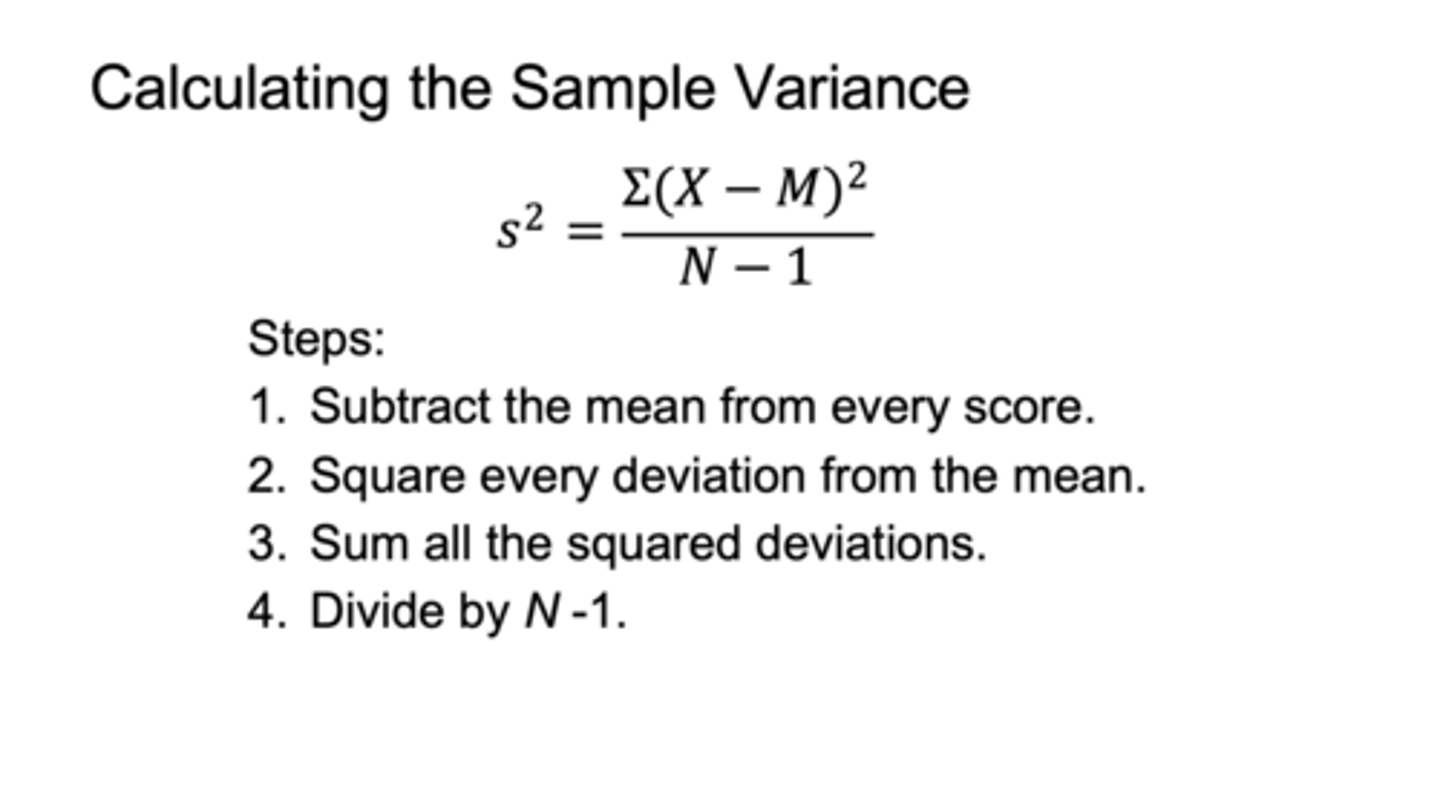
when calculating the sample variance:
1) subtract the mean from every score
2) square every deviation
3)sum all the square deviations
4)divide by N-1
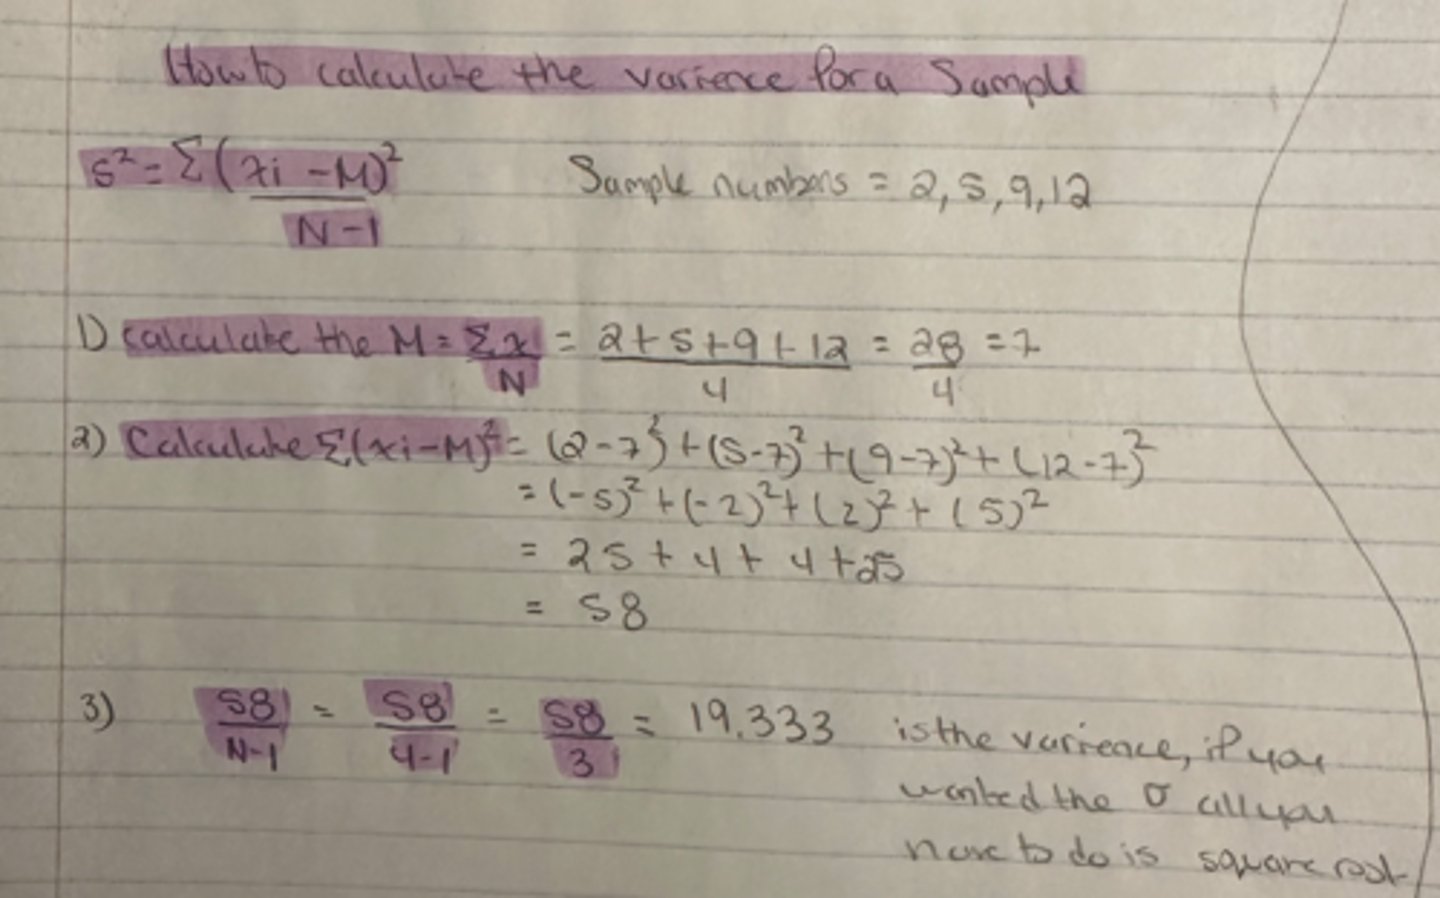
(how to calculate the variance for a sample)
sample numbers are: 2,5,9 and 12
what is the sample variance?
sample variance = 19.333
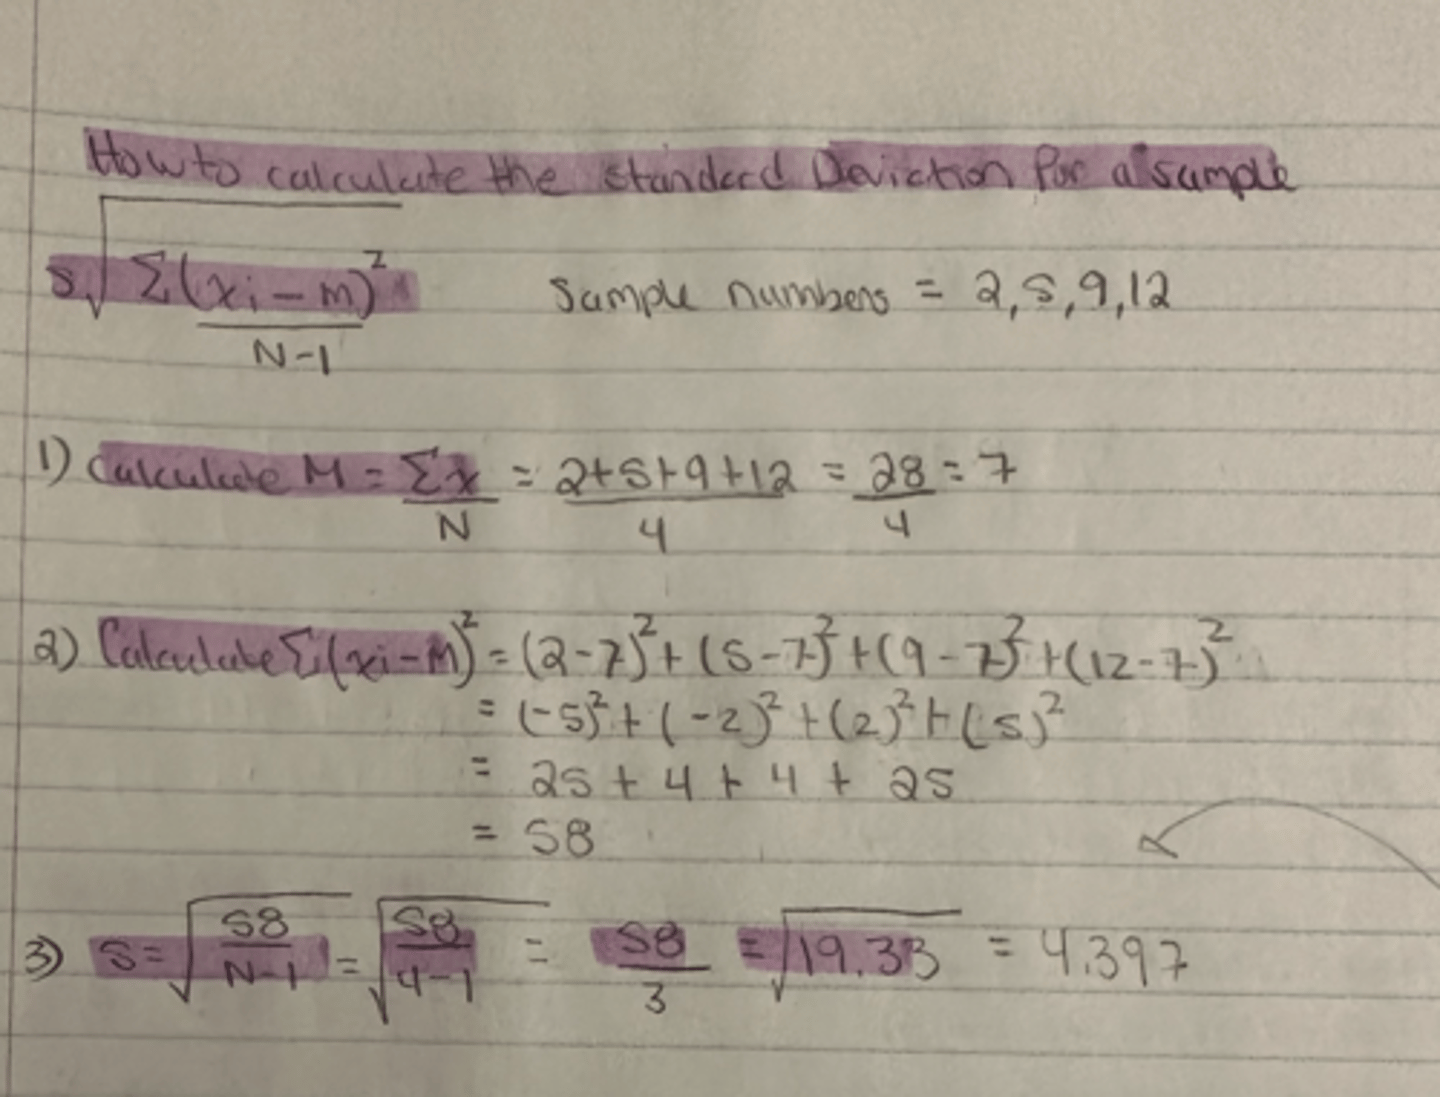
(how to calculate the standard deviation for a sample)
sample numbers are: 2,5,9 and 12
what is the standard deviation?
standard deviation for a sample = 4.397
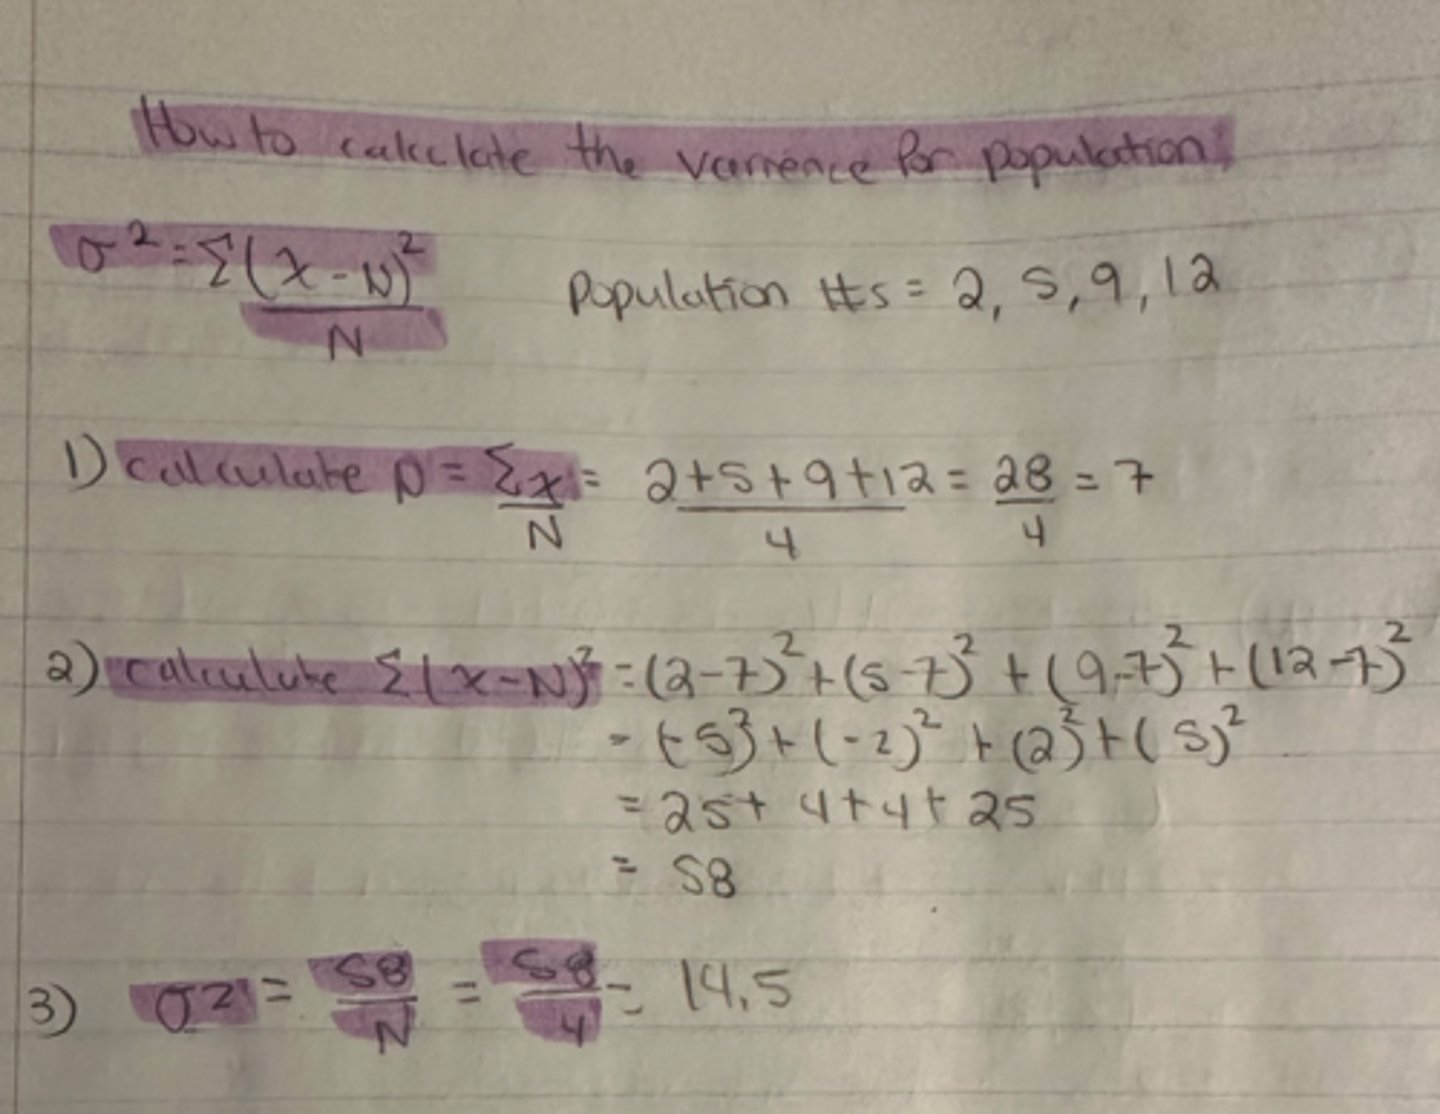
(how to calculate the variance for a population)
sample numbers are: 2,5,9, and 12
what is the population variance?
population variance = 14.5
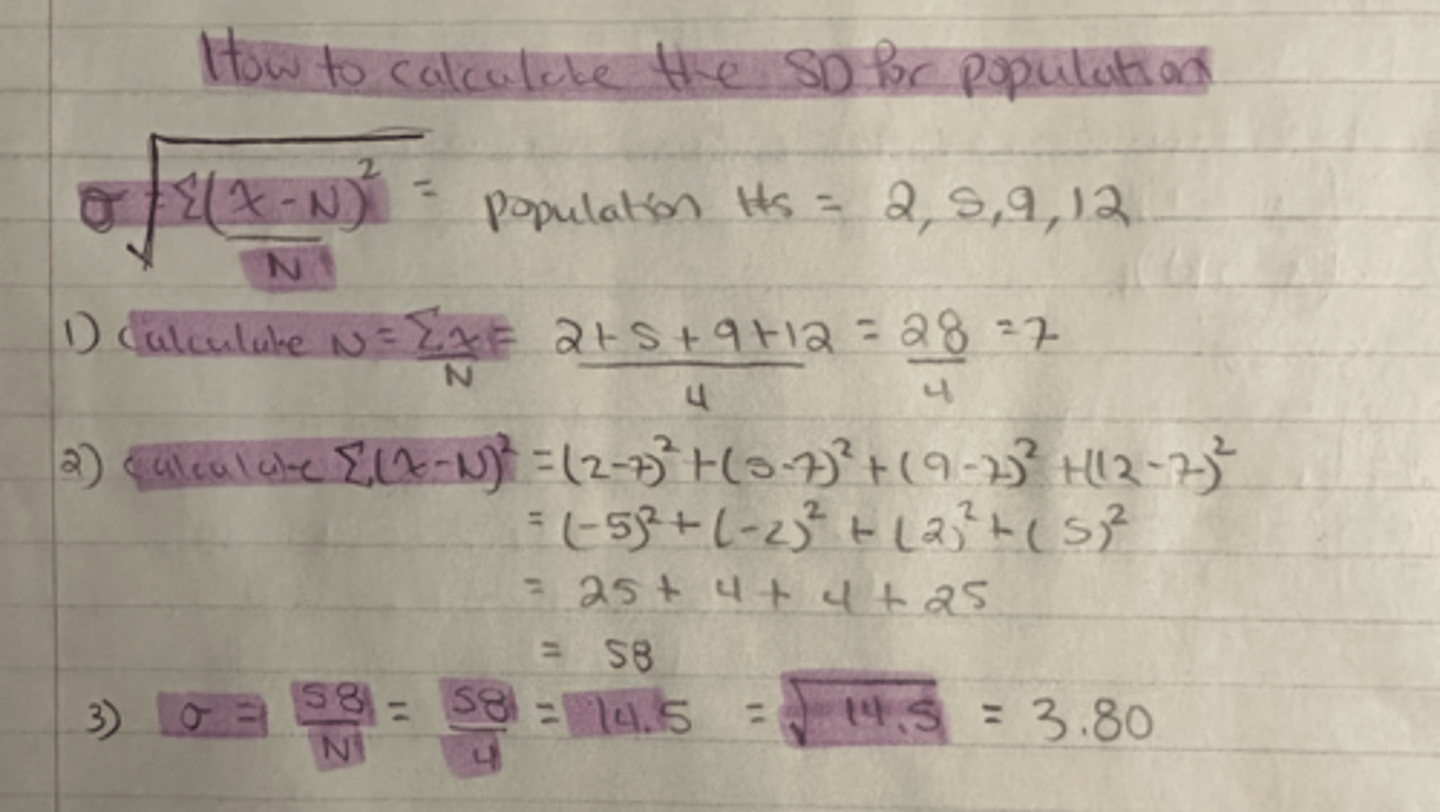
(how to calculate the standard deviation for a population)
sample numbers are: 2,5,9 and 12
what is the standard deviation for the population?
the standard deviation for a population = 3.80
A farmer wants to know the weight of the heaviest cow on his farm. He knows the range of his herd is 1317 lb. This value was calculated by including the weight of his newest calf, which was born at 83 lb. What is the weight of the farmer's heaviest cow?
work backwards with the range formula
Xhighest = 1317 + 83lbs = 1400lbs
his heaviest cow is 1400lbs
The value of an observation is 1.18; the value of the mean is 1.32. The value of the deviation is _____. (Answer using two decimal places.)
-0.14
The value of an observation is 22; the value of the mean is 28. What is the value of the squared deviation?
28-22=6
6 squared = 36
The value of an observation is 216; the value of the mean is 221.3. The value of the deviation is _____. (Answer using one decimal place.)
216-221.3= 5.3
Which measure of variability is affected by outliers???
range, variance and SD
There are eight boys in a preschool class. Their mean height is 41 inches, and their median height is 42 inches. The shortest boy, whose height is 33 inches, moves away and is replaced by a boy whose height is 32 inches. How does this affect the median?
The median will not change.
The value of an observation is 14; the value of the mean is 17. What is the value of the squared deviation?
14-17 = -3
3 squared = 9
When the _____ is calculated, the _____ is calculated as an intermediate step.
variance; sum of squared deviations
A smaller number indicates a _____ amount of spread or deviation, and a larger number indicates a _____ amount of spread or deviation around the mean
small; large
In the formula for the standard deviation of a sample, what does M represent?
the sample mean
In a science experiment, a student studies the height to which a whitetail deer can jump while running at top speed. In his experiment, the student found that the mean height that a whitetail deer can jump while running at top speed is 7 feet 2 inches. He also recorded two abnormally low heights: 2 feet 9 inches and 2 feet 3 inches. With the inclusion of these extremely low values, the mean of a data set will be heavily influenced. What effects will these outliers have on the mode?
The mode will remain resistant to the influence of the outliers.
The value of an observation is 0.028; the value of the mean is 0.062. The value of the deviation is _____. (Answer using three decimal places.)
0.028-0.062= -.034