PURDUE STAT 503 MIDTERM 1 :()
 Call Kai
 Learn
Learn Practice Test
 Spaced Repetition
 Match
Match Flashcards
 Knowt Play
1/100

There's no tags or description
Looks like no tags are added yet.
Name | Mastery | Learn | Test | Matching | Spaced | Call with Kai | Chat |
|---|
No analytics yet
Send a link to your students to track their progress
101 Terms
what issue can sampling bring
uncertainty
variation + incomplete information =
uncertainty
statistics is about
estimation
estimation is
the process of inferring an unknown quantity of a population using sample data
a parameter is
a quantity describing a population
an estimate is
a related quantity calculated from a sample, aka a statistic
a population is
all the individual units of interest
a sample is
a subset of units taken from the population
what is sampling error
the chance difference between an estimate and the population parameter being estimated caused by sampling
what is the only way to avoid sampling error
take a census
when is an estimate precise
if the point estimates from multiple replicates are all relatively similar to each other
what does lower precision mean
the results are more uncertain and may not be repeatable
how to increase precision?
use a larger sample size
what is sample size
number of individual units in a sample, denoted as "n"
what is bias
systematic discrepancy between estimates we would obtain over and over, and the true population characteristic
when is an estimate accurate
(or unbiased) when the point estimates from multiple replicates are centered on the true parameter value
in a random sample, each member of a population has. . .
an equal and independent chance of being randomly selected
what minimizes bias
random sampling minimizes bias and makes it possible to measure the amount of samplinge rror
what in convenience sampling
occurs when a sample consists of individuals that are easy to observe
what is volunteer bias
(aka response bias) occurs with human subjects, when individuals who participate in a study differ systematically from the population (ex: college students, home owners, unemployed people, etc)
what is a model
simplified representation of some part of the real world
what 3 things do statistical models do?
1. describe and summarize the patterns in data
2. explain effects of sampling error and other sources of random variation on those patterns
3. allow us to draw reliable (valid) conclusions about patterns that exist in the real world based on limited data sets
what does a parameter describe
population
what does an estimate or statistic describe
a sample
what is a variable
-any characteristic or measurement that differs between individuals
-estimates are also variables
-data emasures variables
quantitative variables
-aka numeric variables
-describe traits that are measured or counted
-have magnitude and units
-continuous numerical data: can take on any real-number value within some range (infinite number of values is possible)
-discrete numerical data: are counts, can't be subdivided (ex: number of people)
what variable types are ratios and rates
continuous! always!
qualitative variables
aka categorical variables
-describe categories or classifications
-nominal variables: no inherent ranking (color, species, diet type)
-ordinal variables: are ranked and can be ordered (age class, dosage levels, grade on exam)
explanatory variable
-independent variable
-treatment variable, manipulated by researcher
-what you manipulate or observe changes in
response variable
-dependent variable
-what changes as a result of manipulating the explanatory variable
if the response variable is categorical and univariate, what graph to use?
bar graph
if the response variable is categorical and explanatory is categorical, what graph to use?
contingency table, grouped bar graph, mosaic plot
if the response variable is categorical and explanatory is numeric, what graph to use?
stacked area plot
if the response variable is numeric and univariate, what graph to use?
histogram, dot plot, boxplot
if the response variable is numeric and explanatory is categorical, what graph to use?
strip chart, grouped boxplot, conditional histogram
if the response variable is numeric and explanatory is numeric, what graph to use?
scatterplot
frequency distribution
describes number of times each value of a variable occurs in a sample
probability distribution
distribution of a variable in the whole population
-real probability distribution of a population in nature is almost never known; use theoretical probability distributions
population distribution
mathematical function that describes the relative commonness or rarity of different values for a variable in a group (bell curve)
how are distributions described
shape, location, and spread
what is a parameter
the numeric quantities that we use to describe a distribution (think average, standard deviation)
statistical model
a combination of the parameters of location and spread of a distribution with an equation that describes its shape, we can build a statistical model
normal distribution
-bell curve!
-It is defined by two parameters: the mean (μ), which determines the center, and the standard deviation (σ), which controls the spread.
-formula: f(x) = (1/σ√2π) × e−(x−μ)²/2σ²
-The normal distribution formula (probability density function) gives the height of the bell curve at any value of x
statistic
value calculated from data on a sample
-can use statistics to approximate parameters (population): called "fitting a model"
-the hat (^) means that it is an approximation of the parameter
how to know if two variables are associated
(aka statistically related)
-if knowing the value of one variable tells you something about the distribution of the other variable
what is a powerful clue that there may be a causal relationship between two variables
if there is a correlation (or association) between them
CORRELATION DOES NOT ???
EQUAL CAUSATION!!!
how to show an association
need data that simultaneously compares the responses for at least 2 values of the explanatory variable
how to show evidence of causation
the sample units in the study must be randomly assigned to the different values of the explanatory variable
-randomization will break associations between explanatory variable and any potential confounds
when is a study called an experiment
if sample units are randomly assigned to different values of an explanatory variable
when is a study observational
if sample units aren't randomly assigned to different values of an explanatory variable -> can demonstrate association but not causation
what does frequency distribution describe
number of times each value of a variable occurs in a sample
what is probability distribution
distribution of a variable in the whole population
-normal distribution is bell curve
what is relative frequency
-proportion of observations having a given measurement, calculated as the frequency divided by the total number of observations
-frequency is the count
- relative frequency = (frequency) / (total number of observations) = (count) / (total count)
frequency distribution of a categorical value
lists the categories and gives the count or frequency or percent of individuals who fall into each category
bar graph
uses height of rectangular bars to display the frequency distribution (or relative frequency distribution) of a categorical value
pie chart
shows the frequency distribution of a categorical variable as a "pie" whose slices are sized by the frequency or relative frequency for the categories
histogram
-uses area of rectangular bars to display frequency
-data values are split into consecutive intervals, or "bins", usually of equal width, and the frequency of observations falling into each bin is displayed
when are gaps meaningful - bar graphs or histograms
in histograms!
-gaps in bar charts just improve readability
how to pick histogram bin size
-number of bins controls "smoothness" of a histogram
-more bins visualize finer details (greater resolution), but too many can emphasize sampling error instead of population distribution
-larger sample sizes allow smaller bins and greater resolution
-want to use most bins without having gaps in main body of histogram (gaps near tails are often unavoidable)
what are important descriptors for the shape of a numeric distribution
-number of modes
-symmetry vs skew
-direction of any skew
-weight of tails relative to normal distribution
unimodal distribution
one peak
Bimodal Distribution
two peaks
-tends to represent different subpopulations: ex: men vs women
multimodal distribution
3 or more peaks
when is a distribution skewed
if it is asymmetrical
-named for the direction of long tail
kurtosis
-tail weights
-described relative to the normal distribution (how much longer the tail is than bell curve)
descrptive statistics
-(aka summary statistics)
-quantities that capture important features of frequency distribution
-numerical: measure location and spread of data
-categorical: measure fraction of observations in a given category
mathematical notation
-lowercase Latin letters denote sample data for a variable
-subscripts indicate individual observation (ex: y3 is 3rd observation of y variable)
-any given observation is denoted with index i (ex: yi is measurement of height in data
-n is sample size
Greek letter with a hat
designates an estimator for a parameter
Example: μ ̂_x=x ̅ indicates that we use the sample mean (x ̅) to estimate the population mean (μ_x).

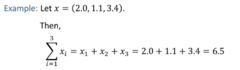
sum notation
capital Greek letter sigma indicates summation
Occasionally: Σx→ sum all values of x.
what is an outlier
a data point whose value doesn't conform with the overall distribution of the data
-sample mean is sensitive to skewness and outliers
sample median
-median - point that divides a distribution in half
-sample median - 50th percentile of data
how to find sample median
1. sort data from smallest to largest
2. find value that divides dataset in half
4. if n is even, take average of middle 2 values
if a distribution is exactly symmetrical
-mean and median will be identical
-skewness and outliers have less effect on median than they do on mean
sample variance
-sample variance of a variable x is the average squared distance between the individual data points and sample mean
-s²
-shows degrees of freedom and sum of squares
-sum of squares increases as avg distance between data points and sample mean gets bigger AND as n gets bigger
-dividing by degrees of freedom (n-1) corrects for increases in sum of squares due to larger sample sizes
-degrees of freedom describe the effective sample size that is available to estimate the variance (can't find with n=1, only have 1 degree for n=2)

sample standard deviation
-sample s.d. of x is the square root of sample variance (s²)^(1/2)
sample variance and standard deviation properties
-if data (x) has units (u), variance has units u²
-standard deviation, sx = (sx²)^(1/2) has the same units as x
-by definition, sx >= 0
-if sx = 0, then all observations are the same
-if n=1, then sx and sx² are undefined
-variances can be added together
-standard deviations can't be added together
-both depend on sample mean, both are sensitive to outliers
percentile
-percentile of a measurement specifies the percentage of observations less than or equal to it; the remaining observations exceed it
-the Xth percentile of a sample is the value below which X percent of the individuals lie
quantiles
-the quantile of a measurement specifies the fraction of observations less than or equal to it
-means that the proportion less than or equal to the given value is represented as a decimal rather than a fraction
-mark upper boundary of data
quartiles
Quantiles that divide a distribution into four equal parts.
interquartile range
-difference between the third and first quartiles, spans the middle 50% of the data
- Q3-Q1
notiation
let a subscript in square brackets indicate the index of the sorted data
x = 3.2, 2.3, 5.1, 4.7, 1.2
- x3 = the third data point; 5.1
-x[3] = the third smallest data point numerically; 3.2
how to find IQR
1. sort the data
2. Q1 is median of bottom half of data
a. let j = 0.25n
b. if j is an integer, then Q1 = (x[j] + x[j+1])/2
c. if j is not an integer, let j' be the ceiling of j and set Q1 = x[j'] -> round UP to next value
3. Q3 is median of top half of data
a. repeat steps 2b,c with j=0.75n
4. IQR = Q3 - Q1
boxplots
-visualize the quantiles of data
-whiskers extend to the quartiles (plus/minus 1.5*IQR or the last data point in the tail -> whichever is closest to the median
-represents 5# summary - min, max, Q1, Q3, median
cumulative distribution
-shows proportion of the sample data points that are equal to or less than a particular value
how to describe the distribution of a numeric value
-idk there's a lot to consider look at this pic idek where to start fr

how to describe distribution of a categorical variable
-sample proportion for category j is the number sample units that belongs to j (nj) out of the total sample size
-p hat j = nj/n
-this is just the relative frequency!
indicator function
idrk look at this

sample proportion
-the sample mean of the indicator function
-for proportions, mean and variance are not independent
what are mean and IQR useful for
-summarizing skewed data
-compare mean and median
categorical response variables
-graphs for categorical responses vizualize the absolute frequency or proportion of sample units that belong to each category
-sample proportion -> probability
-proportion: what is the fraction of sample units in each category?
-probability: what fraction of sample units do we expect to be in each category in future samples?
contingency tables
-displays frequencies for each combination of values from more than or equal to 2 categorical variables
-in 2-way contingency table: columns represent explanatory variable, rows represent the response
-row, column, and grand totals are usually included
-show raw data and are useful when there are many levels for each variable
grouped bar chart
-grouped by category
-show either absolute or relative frequencies, but don't show frequencies for the explanatory variable
uhh yea
mosaic plot
-width shows n
-the 2 different categories are stacked on top of each other; 2 treatment categories are next to each other
-visualize estimates of conditional probabilities
-visualize relative frequencies of both variables; show proportions
bivariate numeric associations: scatterplots
look at:
1. linearity versus nonlinearity
2. directionality (might depend on x in a nonlinear graph)
3. strength of the relationship
4. consistency of variation in the response along x
5. outliers in the (x,y) plane
why use strip charts
shows all data but can be hard to read with very large datasets as a result
when to use boxplots
works well with large datasets, but rely on summaries; perform poorly with very small datasets
sample unit
individual observation of the system or phenomenon that we are studying - each row in data table is an individual sample unit
multivariate
multivariate dataset includes data on more than or equal to 3 variables for each sample unit; univariate and bivariate datasets contain only 1 or 2 variables, respectively
wide-format dataset
repeated observations of the same individual appear in multiple columns
