West Chapter 5: Ventilation-Perfusion Relationships
1/35
There's no tags or description
Looks like no tags are added yet.
Name | Mastery | Learn | Test | Matching | Spaced |
|---|
No study sessions yet.
36 Terms
What determines the PO2 of alveolar gas?
Balance between two processes:
Removal of O2 by pulmonary capillary blood
Continual replenishment of O2 by alveolar ventilation
What governs the rate of removal of O2 from the lung?
O2 consumption of the tissues
Varies little under resting conditions
Alveolar PO2 is largely determined by the level of alveolar ventilation
Same for alveolar PCO2
What is normal alveolar PCO2?
~40 mmHg
What are the four causes of hypoxemia?
Hypoventilation
Diffusion limitation
Shunt
Ventilation-perfusion inequality
Hypoventilation
Abnormally low alveolar ventilation causing alveolar PO2 to fall and PCO2 to rise
Causes of Hypoventilation
Drugs - opiates, barbiturates; depress the central drive to the respiratory muscles
Damage to the chest wall
Weakness or paralysis of the respiratory muscles
High resistance to breathing (e.g. very severe asthma attack)
Morbid obesity - affects both central respiratory drive and respiratory mechanics
Problems in the respiratory center in the brainstem
Interference with the nerve tracts coming down through the spinal cord
Disease at the anterior horn cell where the nerves come out of the spinal cord
Disease of the nerves themselves, neuritis
Changes in the neuromuscular junction
Pathology in the muscles themselves
Problems with the chest cage, crushed chest
Obstruction of the upper respiratory tract
These causes don’t affect the lung itself, correct the hypoventilation and the lung is fine
What is the relationship between alveolar ventilation and PCO2?
If alveolar ventilation is halved, PCO2 is doubled
Respiratory Exchange Ratio (R)
R - CO2 production/O2 consumption
Determined by the metabolism of the tissues in a steady sate
Varies based on the balance of fuels consumed by the individual
Sometimes known as the respiratory quotient
Simplified Alveolar Gas Equation
PAO2 = PIO2 - (PACO2/R) + F
F - small correction factor (typically about 2 mmHg for air breathing), can ignore
If R has its normal value of 0.8, the fall in alveolar PO2 is slightly greater than the rise in PCO2 during hypoventilation
PAO2 = PIO2 - (PACO2/R)
Reversing Hypoventilation
Hypoventilation always reduces the alveolar and arterial PO2, except when the subject breathes an enriched O2 mixture
Added amount of O2 per breath can make up for reduced flow of inspired gas
If alveolar ventilation is suddenly increased, it may take several minutes for alveolar PO2 and PCO2 to assume their new steady state values because of different O2 and CO2 stores in the body
CO2 stores are much greater than O2 stores because of large amount of CO2 in the form of bicarbonate in blood and interstitial fluid
Alveolar PCO2 takes longer to come to equilibrium
During the non-steady state, the R value of expired gas is high as the CO2 stores are washed out
Diffusion Limitation
In a perfect lung, the PO2 of arterial blood would be the same as in alveolar gas, but in reality this is not so
PO2 of the blood rises closer and closer to that of alveolar gas as the blood traverses the pulmonary capillary, but it never reaches it
Under normal conditions, the PO2 difference between alveolar gas and end-capillary blood resulting from incomplete diffusion is immeasurably small
Difference can become larger during exercise due to decreases in capillary transit time of RBCs, when blood-gas barrier is thickened, or if low O2 mixture is inhaled
Diffusion limitation rarely causes hypoxemia at rest at sea level even when disease is present because RBCs spend enough time in the pulmonary capillary to allow nearly complete equilibration
Shunt
Blood that enters the arterial system without going through ventilated areas of the lung
Sources of Shunt
Some of the bronchial artery blood is collected by the pulmonary veins after it has perfused the bronchi and its O2 has been partly depleted
A small amount of coronary venous blood that drains directly into the cavity of the left ventricle
Pulmonary arteriovenous malformation
Forms of cardiac disease causing direct addition of venous blood to arterial blood across a defect between the right and left sides of the heart
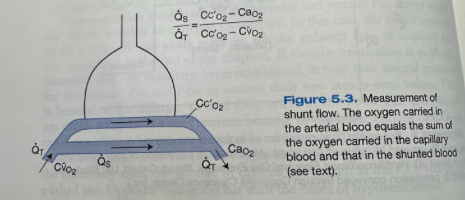
Calculating the Amount of Shunt Flow
Can calculate amount of shunt flow when it is caused by the addition of mixed venous blood to blood draining from the capillaries
Total amount of O2 leaving the system is the total blood flow QT multiplied by the O2 concentration in the arterial blood, CaO2
This must equal the sum of the amounts of O2 in the shunted blood and end-capillary blood
Qs/QT = (Cc'O2 - CaO2)/ (Cc'O2 -CvO2)
Shunt Fraction
Ratio of shunt flow to total flow
Shunt with Blood that Doesn’t Have the Same O2 Concentration of Mixed Venous Blood
When the shunt is caused by blood that doesn't have the same O2 concentration as mixed venous blood (e.g. bronchial vein blood) it is generally not possible to calculate the true magnitude
In healthy individuals, the normal shunt fraction resulting from bronchial and thebesian flow is about 5% but it will rise higher with disease
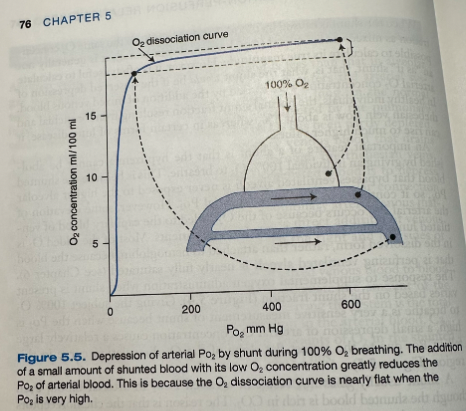
Giving 100% O2 When a Shunt is Present
With a shunt, the hypoxemia cannot be abolished by giving an individual 100% O2 to breathe
Shunted blood that bypasses ventilated alveoli is never exposed to the higher alveolar PO2
Some elevation in arterial PO2 will occur because of the O2 added to the capillary blood of ventilated lung, can help some patients
Most of the added O2 is in the dissolved form rather than attached to hemoglobin as the blood perfusing the ventilated alveoli is nearly fully saturated
Response to supplemental oxygen when shunt is present varies based on shunt fraction
Giving the subject 100% O2 to breathe is a very sensitive measurement of shunt because when the PO2 is high, a small depression of arterial O2 concentration causes a relatively large fall in PO2, due to the almost flat slope of the O2 dissociation curve in this region
Shunt usually doesn't result in a raised PCO2 in arterial blood even though shunted blood is rich in CO2
Chemoreceptors sense any elevation of arterial PCO2 and respond by increasing ventilation, reducing the PCO2 of the unshunted blood until the arterial PCO2 is normal
What is the most common cause of hypoxemia?
Ventilation-perfusion inequality
Normal Ventilation Perfusion Ratio
Figure A shows PO2 and PCO2 with a normal ventilation-perfusion ratio (about 1)
Inspired air has a PO2 of 150 mmHg and PCO2 of 0
Mixed venous blood entering the unit has a PO2 of 40 mmHg and a PCO2 of 45 mmHg
Alveolar PO2 of 100 mmHg is determined by a balance between the addition of O2 by ventilation and its removal by blood flow
Normal alveolar PCO2 of 40 mmHg is set similarly

Low V/Q
Figure B shows reduction of the ventilation-perfusion ratio by obstructing ventilation, leaving blood flow unchanged
Can be due to mucous or a tumor obstructing the airway
O2 in the unit will fall and the CO2 will rise
Alveolar gas equation is not applicable here because the respiratory exchange ratio is not constant
Appropriate equation is the ventilation-perfusion ratio equation: VA/Q = 8.63 R (CaO2 - CvO2/PACO2)
When ventilation is completely abolished the ventilation-perfusion ratio is 0 and the O2 and CO2 of the alveolar gas and end-capillary blood must be the same as mixed venous blood
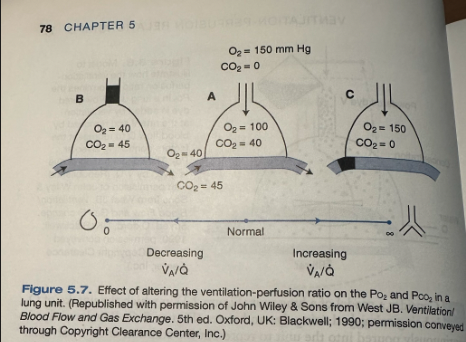
High V/Q
Figure C shows an increase of the ventilation-perfusion ratio by decreasing blood flow
Can be due to a blood clot (pulmonary embolism)
O2 rises and CO2 falls, eventually reaching the composition of inspired gas when blood flow is abolished (ventilation-perfusion ratio of infinity)

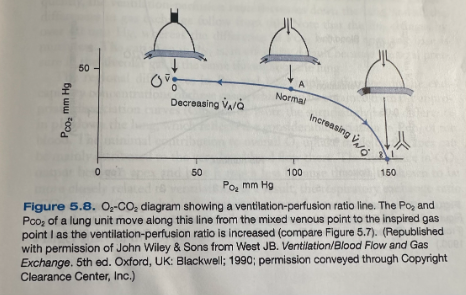
Ventilation-Perfusion Ratio Line
Point A, normal alveolar gas composition, can also represent the end-capillary blood if we assume that blood equilibrates with alveolar gas at the end of the capillary
Mixed venous point is on the left and the inspired point (I) is on the right
The line between v and I going through A indicates all the possible alveolar gas compositions in a lung that is supplied with gas of composition I and blood of composition v
Alveolar compositions that don't lie on the ventilation-perfusion line aren't possible in this lung but could exist if the mixed venous blood or inspired blood were changed so that the line passed through that point
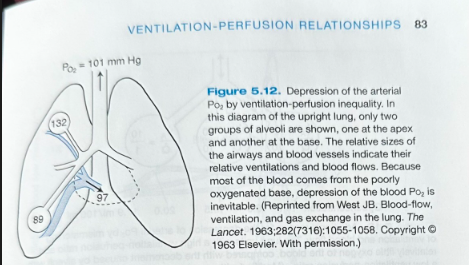
Regional Differences in V/Q Throughout the Lung
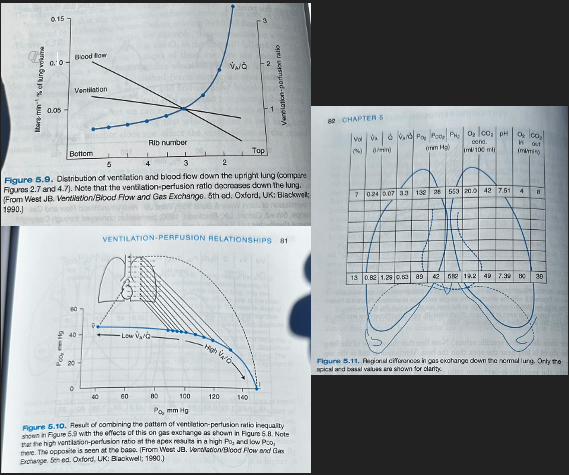
Ventilation and perfusion vary from the top to bottom of the lung due to effects of gravity and other factors
Ventilation increases slowly from top to bottom of the lung and blood flow increases more rapidly so the ventilation-perfusion ratio is abnormally high at the top of the lung (where blood flow is minimal) and much lower at the bottom
Shows horizontal slices of the lung and where they are located on the ventilation-perfusion line by its own ventilation-perfusion ratio
The ratio is high at the apex so this point is found toward the right end of the line and the base of the lung is to the left of normal
PO2 of the alveoli decreases markedly down the lung, where as PCO2 increases much less
The volume of the lung is less in the slices near the apex than the base
Ventilation is less at the top than the bottom, but the differences in blood flow are more marked
The ventilation-perfusion ratio decreases down the lung and the differences in gas exchange follow
The Po2 changes by over 40 mmHg, whereas the difference in PCO2 between the apex and base is much less
Regional differences in PO2 and PCO2 imply differences in the end-capillary concentrations of these gases
There is a large difference in pH down the lung which reflects the considerable variation in PCO2 of the blood
Minimal contribution to overall O2 uptake made by the apex is mainly attributed to low blood flow there
The difference in CO2 output between the apex and the base is much less because this is more closely related to ventilation (less of a change between apex and base than blood flow)
The respiratory exchange ratio (CO2 output/O2 uptake) is higher at the apex than at the base
During exercise when the distribution of blood flow is more uniform, the apex assumes a larger share of the O2 uptake
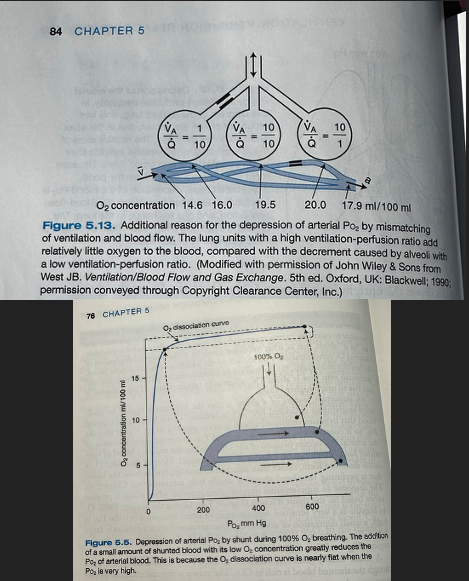
Depression of PaO2 by Ventilation-Perfusion Inequality
In the upright lung, the PO2 at the apex is ~40 mmHg higher than the base of the lung but the major share of the blood leaving the lung comes from the lower zones where the PO2 is low - results in depressing arterial PO2
Expired alveolar gas comes more uniformly from apex and base because the differences in ventilation are less than for blood flow so arterial PCO2 will be elevated because it is higher at the base of the lung than the apex
Net Effects of High and Low V/Q Ratios
Three groups of alveoli with low, normal, and high ventilation-perfusion ratios
Even though there is an equal number of low and high ventilation-perfusion ratio alveoli, the high ventilation-perfusion ratio alveoli cannot compensate for the problems caused by the low ventilation-perfusion units due to decreased amount of blood flow to the alveoli
Due to the nonlinear shape of the oxygen dissociation curve, units with a high ventilation-perfusion ratio do not increase the oxygen concentration of the blood very much despite the relatively high PO2 (high ventilation-perfusion ratio = good ventilation and poor blood flow, blood going by well oxygenated but not much going by, when mixed with capillaries from other alveoli, contributes small amount of overall O2 to the mixture)
This explanation doesn't apply to the elevation of the PCO2 because the CO2 dissociation curve is almost linear in the working range
Net result is depression of the arterial PO2 below that of the mixed alveolar PO2 - alveolar-arterial PO2 difference
In the healthy lung this difference is of trivial magnitude, only ~4mmHg due to ventilation-perfusion inequality
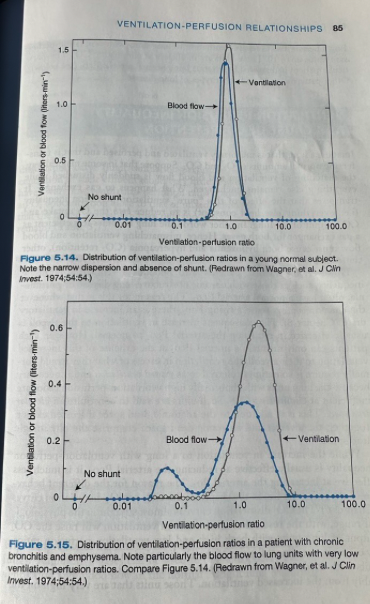
Determining Ventilation-Perfusion Ratios in Patients
Can obtain information about the distribution of ventilation-perfusion ratios in patients with lung disease by infusing a mixture of dissolved inert gases with a range of solubilities into a peripheral vein and then measuring the concentrations of the gases in arterial blood and expired gas
Figure 5.14 shows the results from a healthy individual
All the ventilation and blood flow goes to compartments close to the normal ventilation-perfusion ratio of about 1.0 and there is no blood flow to the unventilated compartment (shunt)
Figure 5.15 shoes a patient with chronic bronchitis and emphysema
Much of the ventilation and blood flow goes to compartments with ventilation-perfusion ratios near normal, considerable blood flow is going to compartments with ventilation-perfusion ratios of between 0.03 and 0.3
Blood from these units is poorly oxygenated and will depress the arterial PO2
There is also excessive ventilation to lung units with ventilation-perfusion ratios up to 10
These units are inefficient at eliminating CO2
Response of the Body to Hypoxemia and Hypercapnia from Ventilation-Perfusion Inequality
If other things are kept equal, mismatching ventilation and blood flow must cause hypoxemia and hypercapnia as the lung becomes less efficient as a gas exchanger for both gases (reduced O2 uptake and CO2 output)
In practice, patients with ventilation-perfusion inequality often have a normal arterial PCO2
This is because when chemoreceptors sense a rising PCO2 there is an increase in ventilatory drive which increases alveolar ventilation and returns arterial PCO2 to normal
Can only maintain normal PCO2 at the expense of increase ventilation to the alveoli
Wasted ventilation - ventilation in excess of what is normally required
Necessary because lung units with abnormally high ventilation-perfusion ratios are inefficient at eliminating CO2
Considered alveolar dead space
Alveolar + anatomic dead space = physiologic dead space
Increase in ventilation to a lung with ventilation-perfusion inequality is usually effective at reducing the arterial PCO2, but it is much less effective at increasing the arterial PO2
This is due to the shapes of the CO2 and O2 dissociation curves
CO2 dissociation curve is almost straight in the physiological range so that an increase in ventilation will raise the CO2 output of lung units with both high and low ventilation-perfusion ratios
The almost flat top of the O2 dissociation curve means that only units with moderately low ventilation-perfusion ratios will benefit appreciably from increased ventilation
The units that are very high on the dissociation curve (high ventilation-perfusion ratio) increase the O2 concentration of their effluent blood very little
Those units that have a very low ventilation-perfusion ratio continue to put out blood with an O2 concentration close to that of mixed venous blood
Net result is that the mixed arterial PO2 rises only modestly and some hypoxemia always remains
A-a Difference with Hypoventilation
None
Response to O2 with Hypoventilation
Good
A-a Difference with Diffusion Limitation
Increased
Response to O2 with Diffusion Limitation
Good
A-a Difference with Shunt
Increased
Response to O2 with Shunt
Small but often useful
A-a Difference with V/Q Inequality
Increased
Response to O2 with V/Q Inequality
Good
Alveolar-Arterial PO2 Difference
Obtained by subtracting the arterial PO2 from the so-called ideal alveolar PO2
Ideal alveolar PO2 is the PO2 that the lung would have if there were no ventilation-perfusion inequality and it was exchanging gas at the same respiratory exchange ratio as the real lung
Derived from the alveolar gas equation: PAO2 = PIO2 - (PACO2/R) +F
Arterial PCO2 is used for the alveolar value
Normal value is about 10-15 mmHg
Increases with age
Must know the inspired PO2 accurately which can make this equation difficult to use in practice