Sensation & Perception : Psychophysics
1/31
There's no tags or description
Looks like no tags are added yet.
Name | Mastery | Learn | Test | Matching | Spaced | Call with Kai |
|---|
No analytics yet
Send a link to your students to track their progress
32 Terms
Psychophysics
Study of relationship between stimuli from environment & people's perception of these stimuli
- Detection
- Discrimination
Detection
When the sensory system detects any energy changes
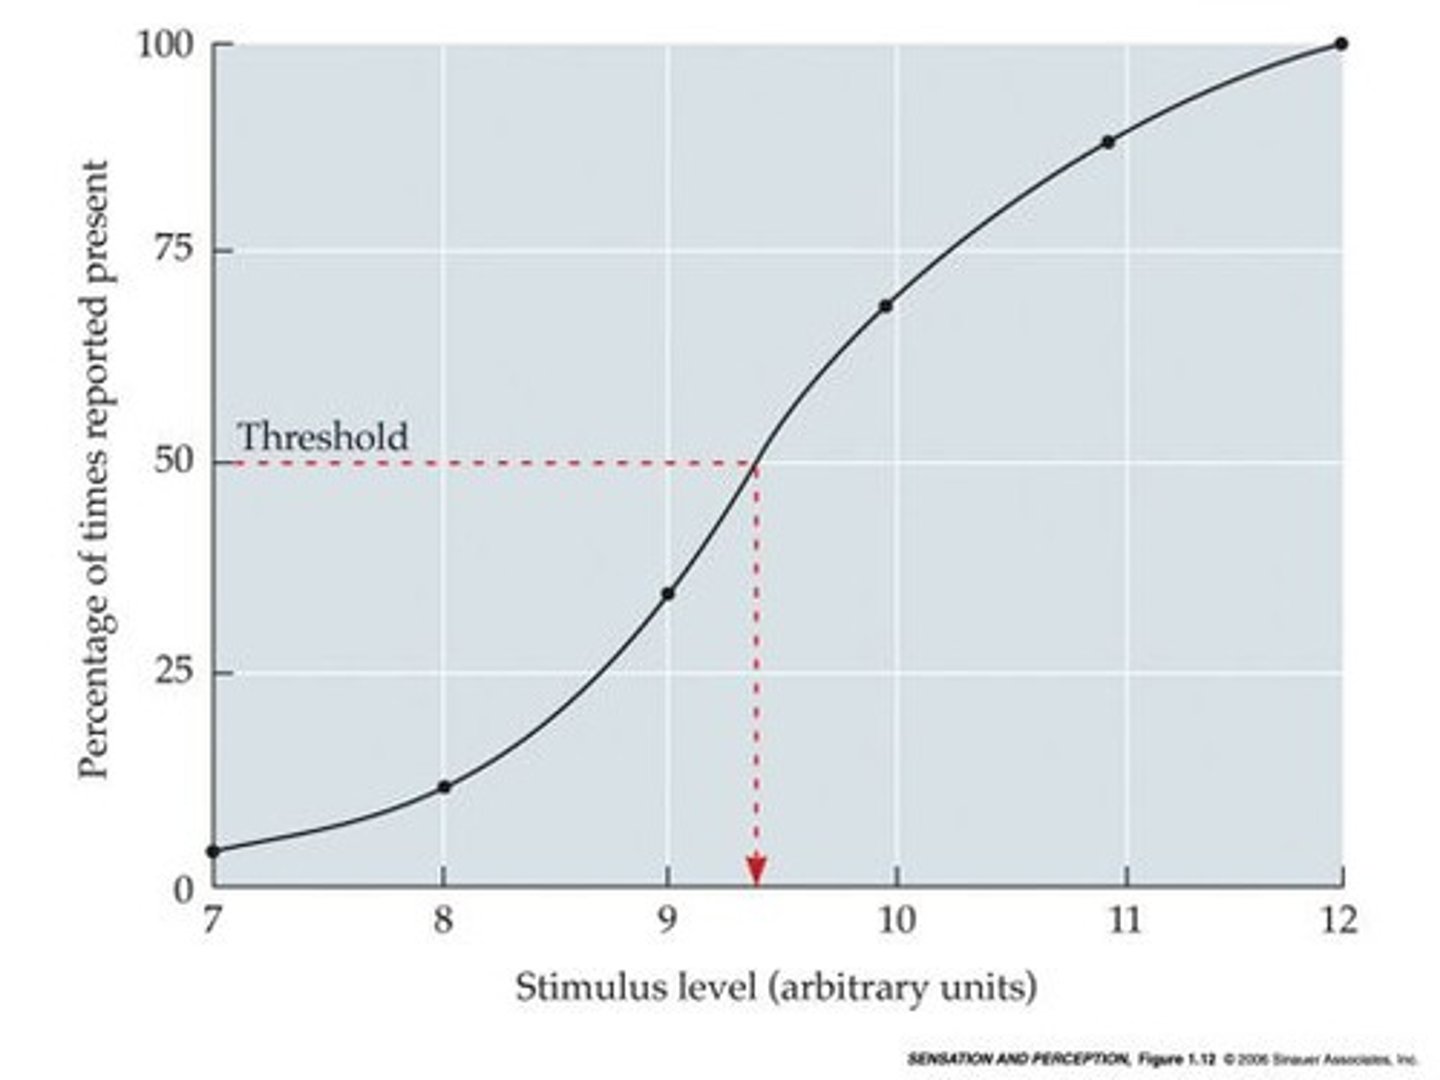
- Absolute Threshold
Absolute Threshold
Minimal energy needed to detect stimulus
- Below AT => Not detected
- Reverse relation with sensitivity
Method of Constant Stimuli
Stimulus is presented many times in a random order
- Respond "yes" or "no" for detection
Method of Limits
Estimate threshold instead of tracing out entire psychometric function
- Descending
- Ascending
Descending
Begins by presenting a stimulus at a high enough intensity to be heard
Ascending
Begins by presenting a stimulus at a low intensity
Method of Adaptive Testing
Keep test stimuli hovering around threshold
Method of Adaptive Testing
What is the method that is the least accurate & takes the shortest time?
Example of Absolute Threshold
Ticking of wristwatch : 20 feet (6 m)
Discrimination
Involves comparison
- "Is this stimulus different from that one?"
Difference Threshold
Threshold for the perception of a difference between standard and comparison stimuli
- JND
Point of Subjective Equality (PSE)
Stimulus that appears most like the standard
Interval of Uncertainty (IOU)
Interval between 25% & 75%
Just Noticeable Difference (JND)
Average of the threshold for "greater than" and threshold for "less than"
- JND = IOU / 2
Negative Time Error
Stimulus presented first is assumed to be less intense than the later stimuli
Positive Time Error
Stimulus presented first is assumed to be more intense than later stimuli
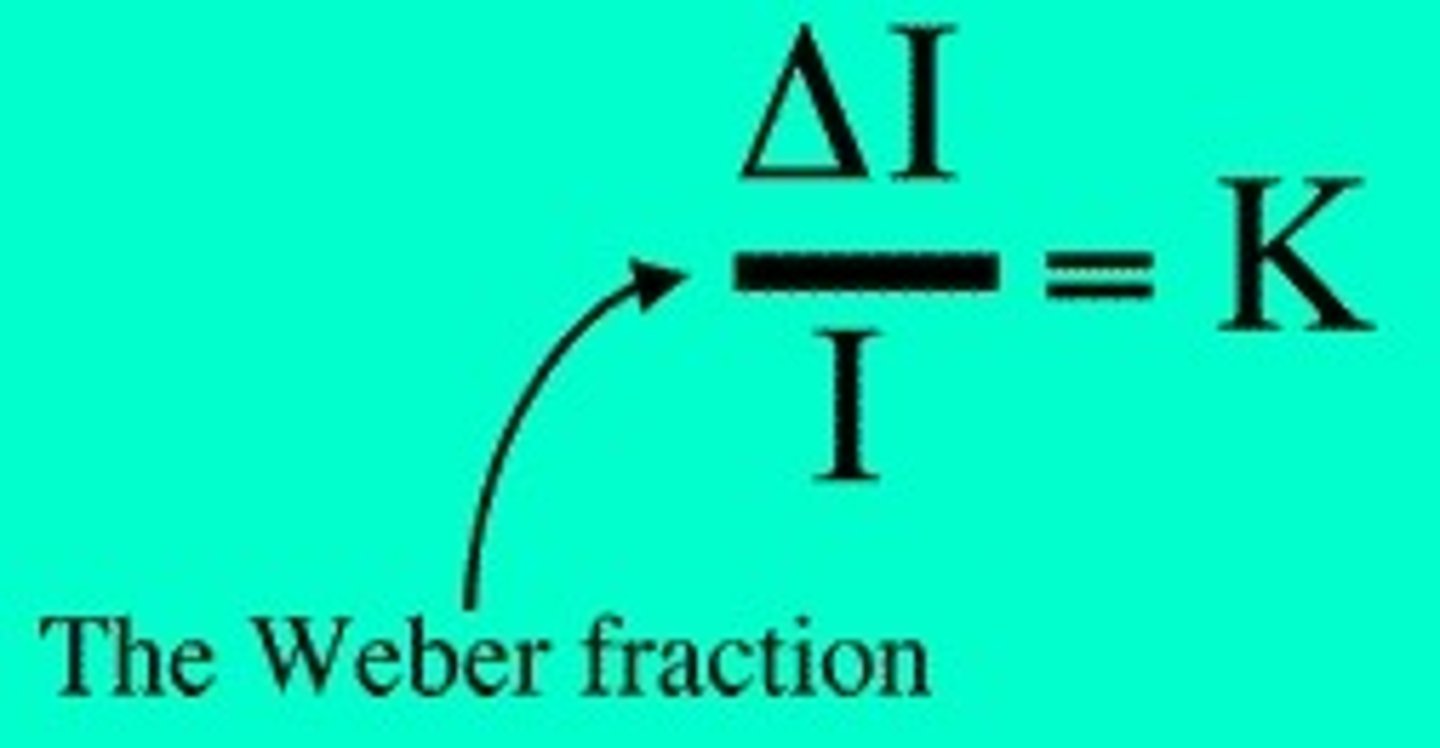
Weber's Law
About the difference threshold for the standard weights of different magnitude
False, JND is larger with larger standards
T/F : JND is larger with smaller standards
Steven's Law
Measuring magnitude
- "Magnitude estimation"
Magnitude Estimation
Observers were asked to assign numbers to stimuli on the basis of how intense they appear to be
Brightness
n < 1
- "Response compression"
Electrical Shock
n > 1
- "Response expansion"
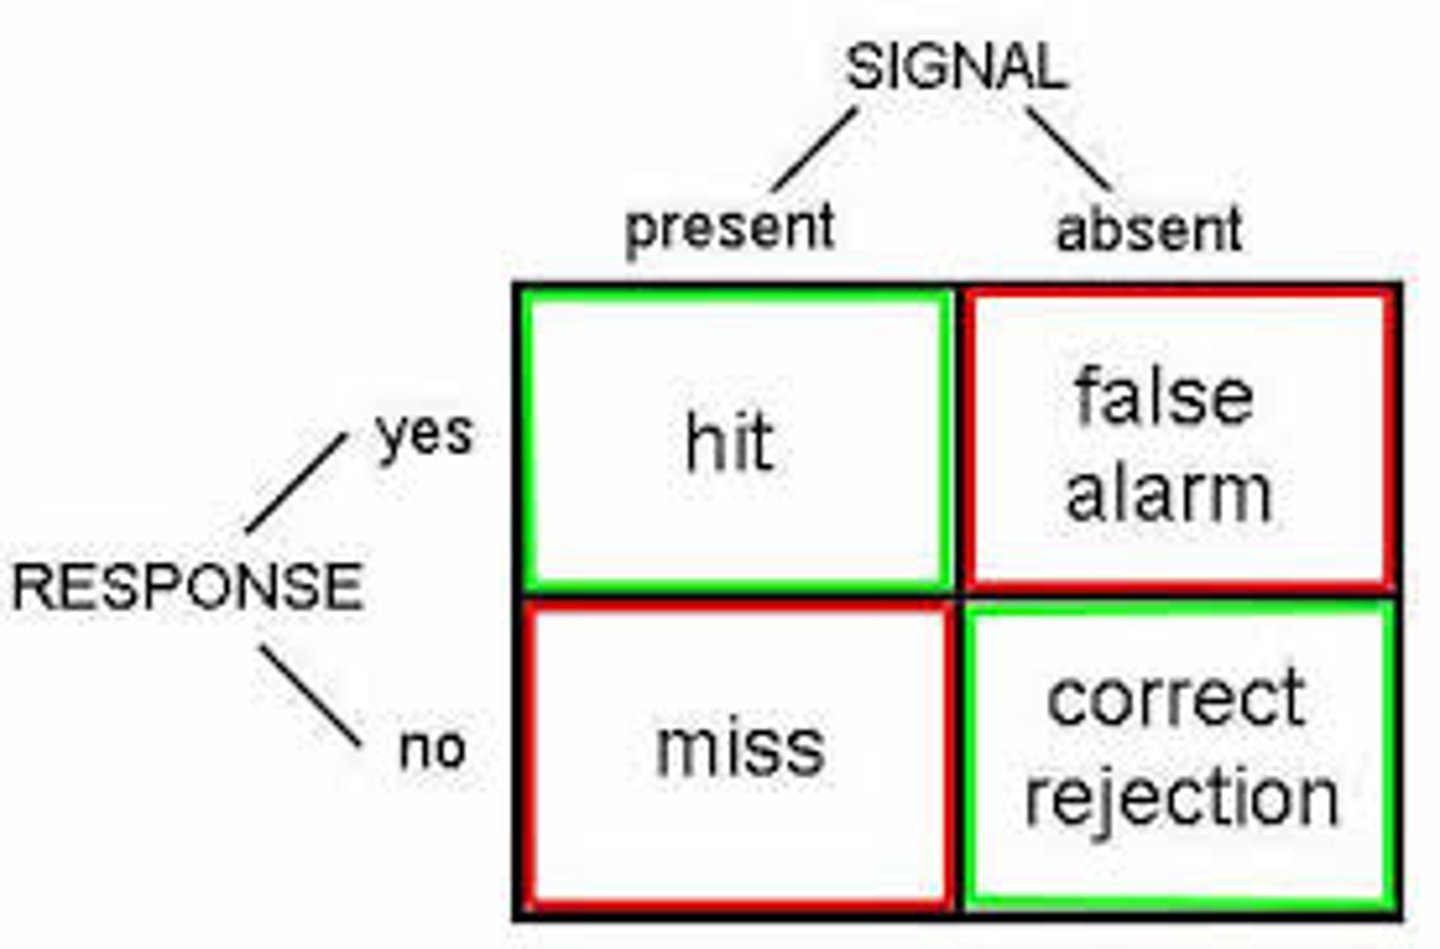
Signal Detection Theory
Response Criteria
- Liberal & Conservative
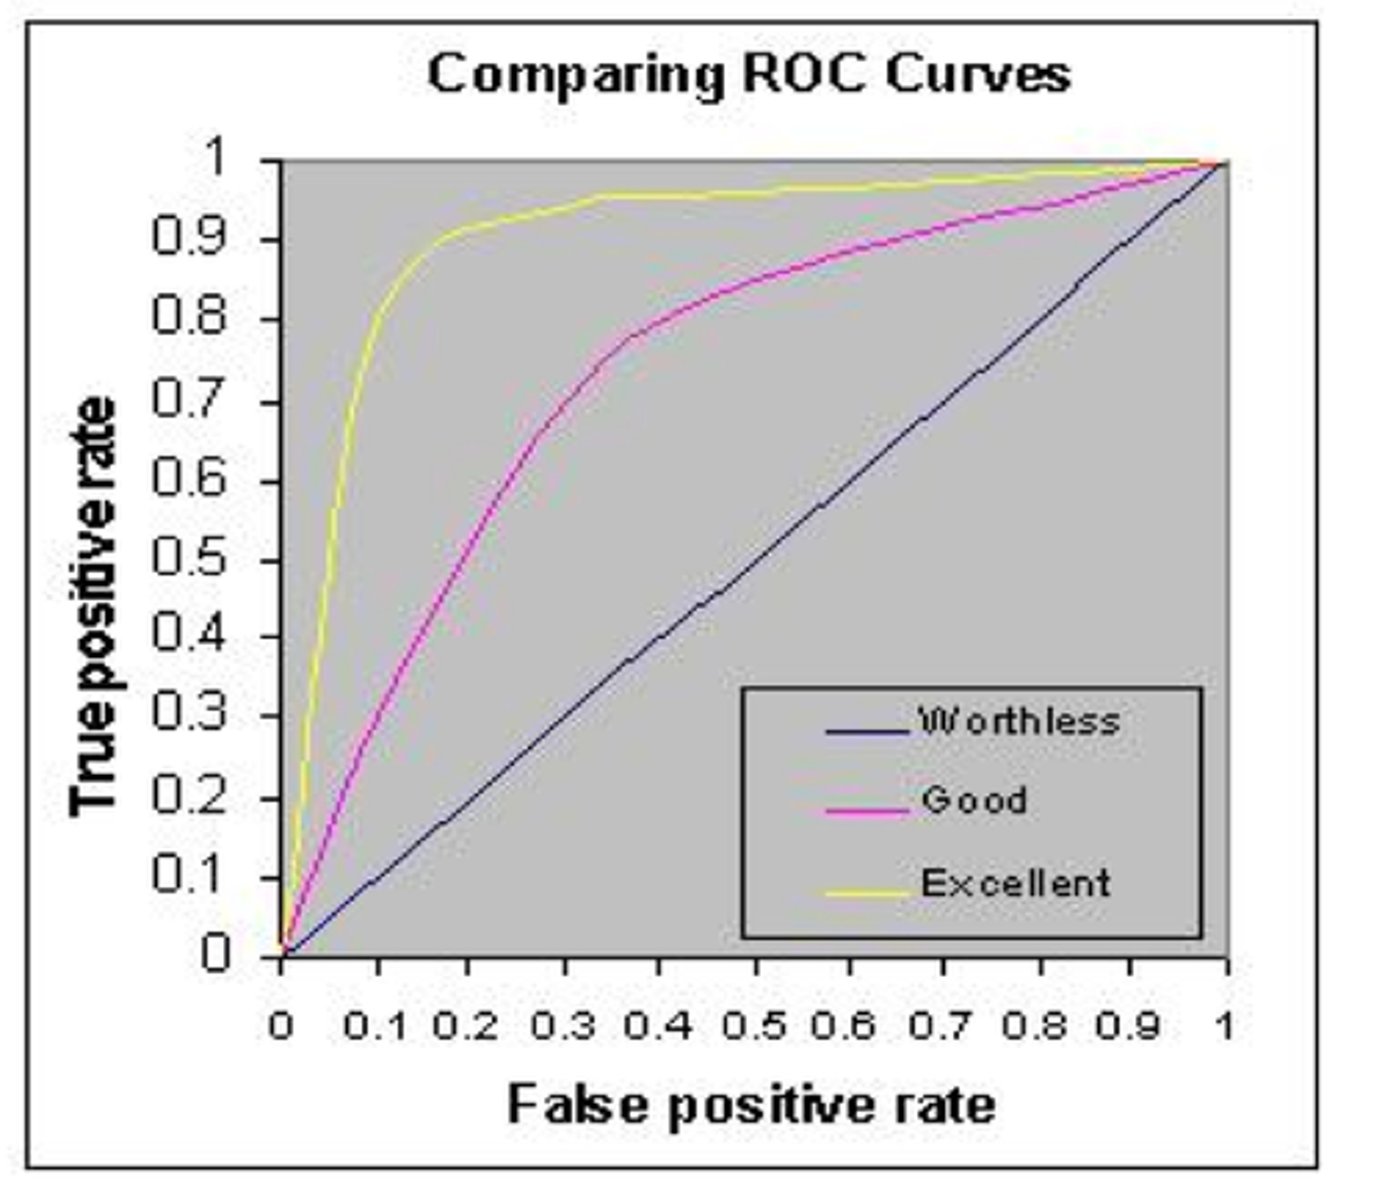
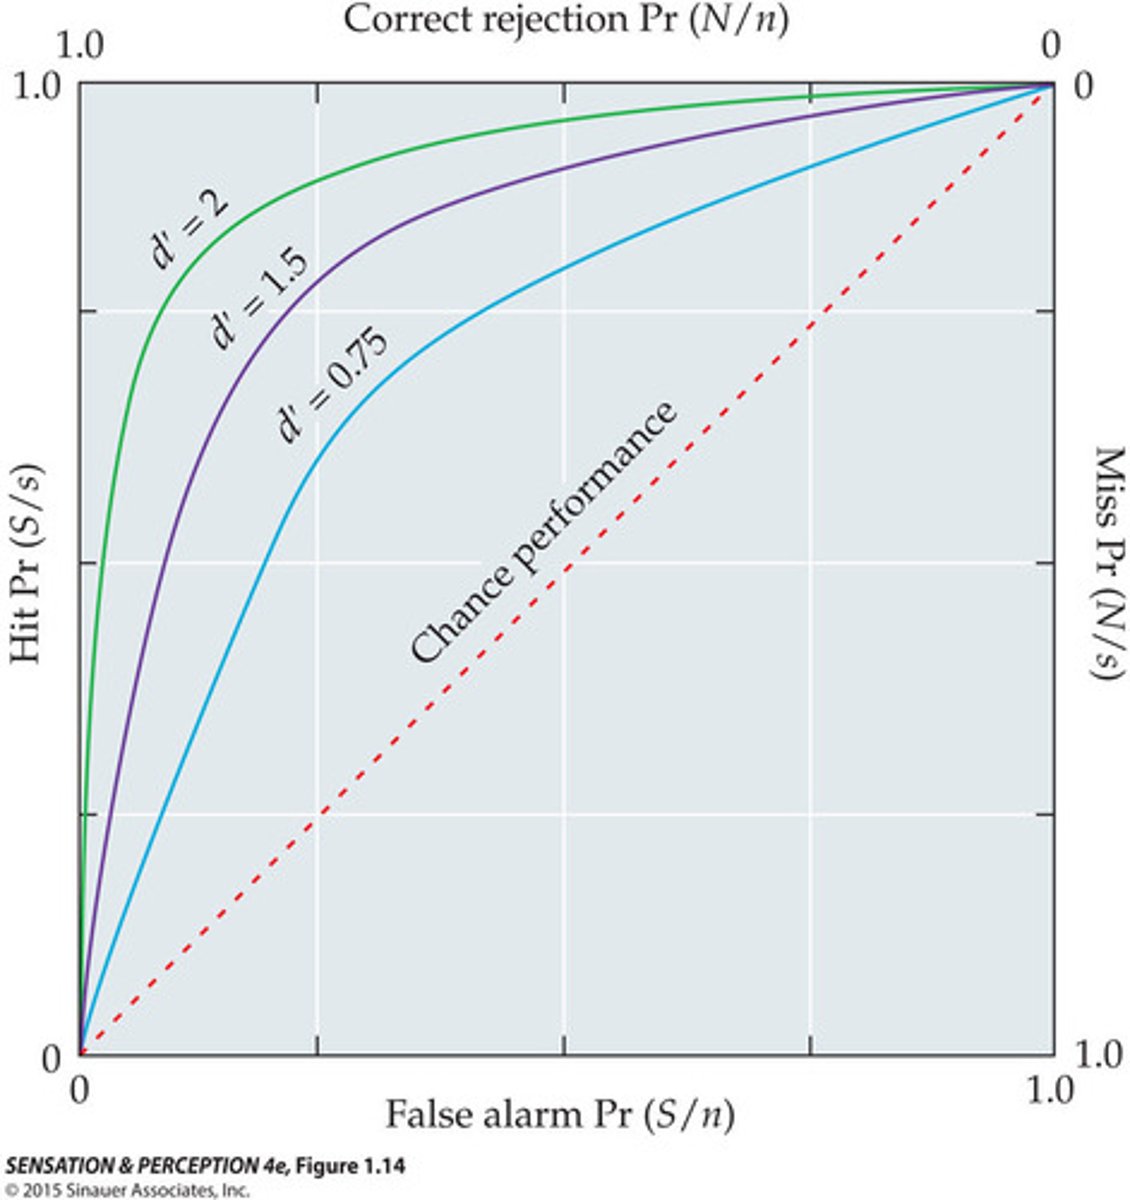
Receiver Operating Characteristic Curve (ROC)
The graphical plot of the hit rate as a function of the false alarm rate
Probability Distribution Graph
Y Axis : Likelihood of occurrence
X Axis : Perceptual effect (loudness)
As β line moves left...
False Alarm & Hit Frequency both rise
- More Hits, but also more False Alarms
As β line moves right...
False Alarm rises, but Hit falls
- More False Alarms, less Hits
Receiver Operating Characteristic Curve (ROC) with Sensitivity Curve
SDT attempts to measure sensitivity independently of the response criteria
- L is more liberal than C
Noise
Sensory Noise
- Amount of noise varies
- Fluctuation in noise level in physiological perceptual and other variables
Sensitivity
Becomes greater the more the line reaches the upper left corner
- The more you are towards the corner, the more sensitive you are
Context & Bias
Contextual effects influence judgements of sensory magnitude