Phylogenetic Trees
1/33
There's no tags or description
Looks like no tags are added yet.
Name | Mastery | Learn | Test | Matching | Spaced |
|---|
No study sessions yet.
34 Terms
What phylogenetic trees illustrate
Evolutionary relationships among taxa and have transformed the study of evolution and related fields
Interpreting phylogenetic trees
Focus on the most recent ancestors rather than the position of tips or the number of nodes as those features are flexible
How phylogenetic trees are estimated
By analyzing shared, derived characters called synapomorphies that identify monophyletic groups

Homology
Traits shared due to common ancestry
Homoplasy
Occurs when traits are similar due to reasons other than common ancestry, commonly a trait that arose independently more than once (convergent evolution)

Monophyletic group
Includes a common ancestor and all of its descendants

Polyphyletic group
Consists of taxa that do not share and immediate common ancestor

Paraphyletic group
Includes a common ancestor but not all of its descendants
Mass extinctions
Short-term environmental catastrophes that have eliminated most species at least five times in history, reshaping evolutionary paths
The major historical mass extinctions
End-Perminian, end-Cretaceous, leading to the loss of major branches and rise of new ones
End-Permian extinction
Resulted in the disappearance of ninety percent of all species
The sixth mass extinction
Human activities drastically affecting earth’s biodiversity
Adaptive radiation
The rapid production, from a single lineage, of many descendants species
Three hallmarks of an adaptive radiation
A monophyletic group, speciated rapidly, diversified ecologically into many niches
Ecological opportunity
Extrinsic factor of a favourable new environment that can trigger adaptative radiations
Morphological, physiological, or behavioural innovation
Intrinsic motivation that can trigger an adaptive radiation event
Escape-and-radiate coevolution hypothesis
When a species evolves a new trait that helps it escape from predators, parasites, or competitors, it can rapidly expand into new environments and diversify into many new species
Cambrian explosion
Major adaptive radiation event that led to the emergence of all major animal phyla existing today. Animal size and morphology increased significantly, leading to diverse feeding and movement
Burgess Shale
Fossil evidence of Cambrian animal diversity and complexity found in Canada’s Rocky Mountains
Branch
A line representing a population through time
Root
The most ancestral branch in the tree
Tip/terminal node
Represents a living or extinct group of genes, species, families, phyla, or other taxa
Outgroup
A taxon that diverged prior to the taxa that are the focus of the study
Node/fork
Represents the most recent common ancestor of the descendant groups
Polytomy
A node that depicts an ancestral branch dividing into three or more descendant branches; usually indicates that insufficient data were available to resolve which taxa are more closely related
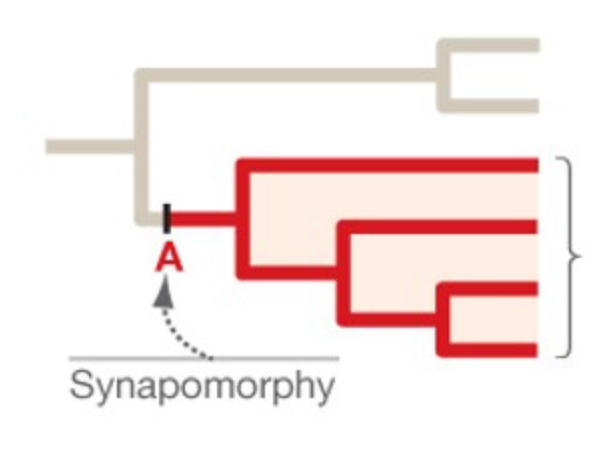
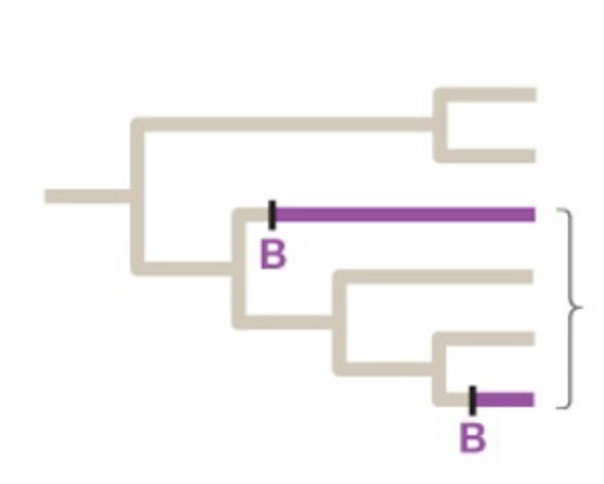
Synapomorphy
A shared, derived trait that is only shared in groups after a particular ancestor
Branch lengths are…
Arbitrary and emphasis is on the branching pattern, which estimates evolutionary relationships among populations
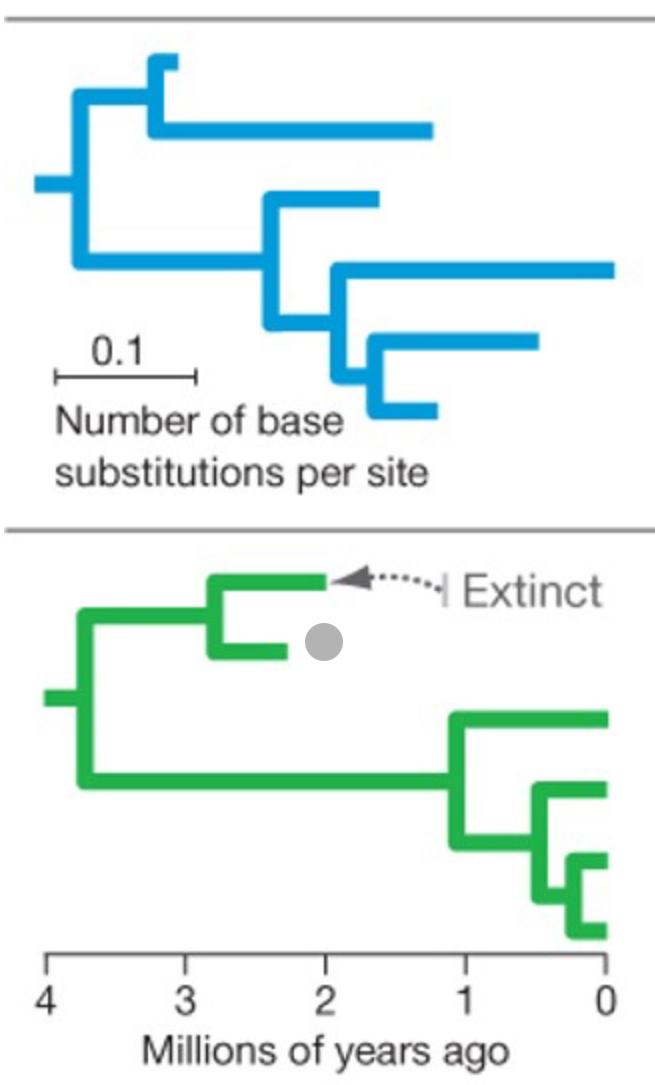
Branch lengths show…
The extent of genetic difference among populations and the extent of evolutionary time between nodes
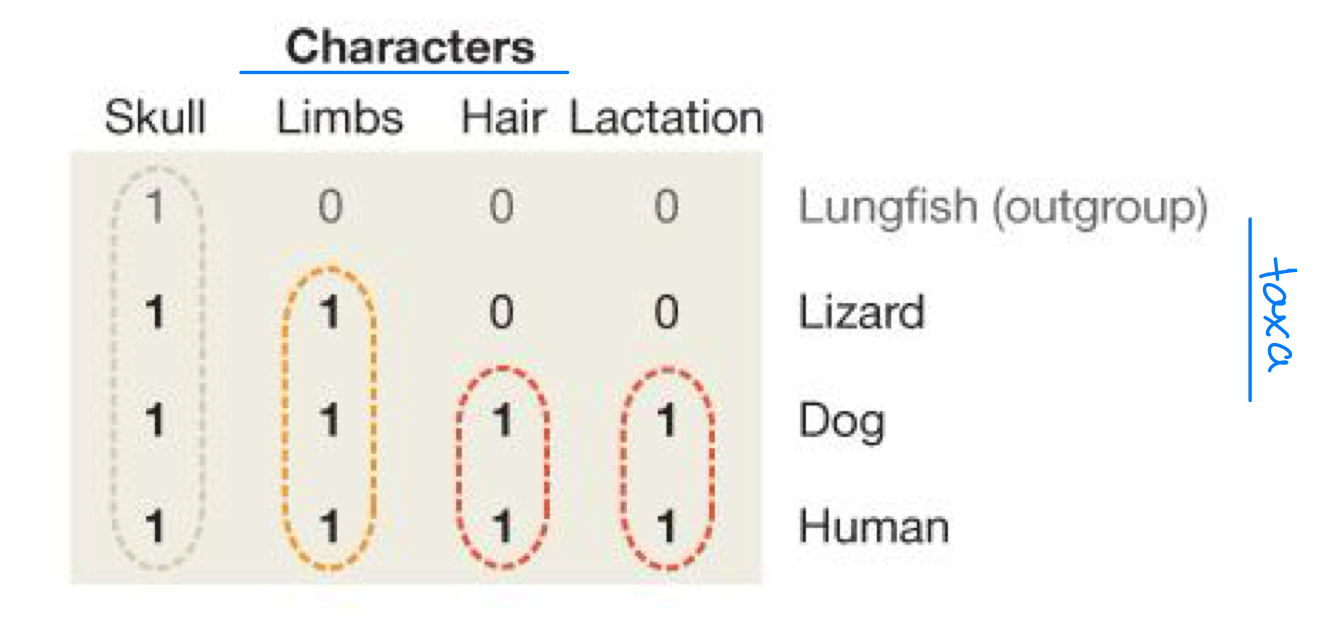
Data matrix
The first step in inferring evolutionary relationships
What the data matrix does
Determines which taxa to compare and which characteristics to use
Outgroups in data matrices
Used to establish whether a trait is ancestral or derived
Cladistic approach
Transitioned the matrix to the tree by reconstructing relationships among species by identifying synapomorphies
Parsimony
Used to identify the most likely tree by the logic that the most likely pattern is the one that implies the lease amount of change
Background extinctions
Occur when certain populations are reduced to zero because of normal environmental change, emerging disease, predation, or competition with other species