Atmospheric Pressure
1/16
There's no tags or description
Looks like no tags are added yet.
Name | Mastery | Learn | Test | Matching | Spaced | Call with Kai |
|---|
No analytics yet
Send a link to your students to track their progress
17 Terms
Pressure
● This is the force per unit area exerted against a surface by the weight of the air above that surface.
● If the number of air molecules above a surface increases, they will exert a greater force on that surface-as a result the pressure will increase
Pressure Measurements
● In aviation, pressure readings are given in inches of mercury ("Hg).
● Meteorologists in Canada previously used millibars but now they transition to Hectopascals (hPa), and this is the unit of pressure found on weather maps
Station Pressure
● Station Pressure is the actual weight of the column of air extending upwards from the station to the outer limit of the atmosphere of the observing station.
Mean Sea Level Pressure MSL
● In order to get an idea of what the weather is doing, weather maps need to be able to compare the pressures at various locations.
● Since the pressure read at a station will vary with the station's elevation the pressure must be compared to a common level, and this level is Sea Level
● MSL Pressure is station pressure reduced to sea level using the average temperature of the past 12 hours.
● MSL Pressure is expressed in Hectopascals.
● How exactly do we do this?
● Remember that a change of 1,000 feet of elevation makes a change of about 1 inch on the barometer reading.
➢ (Remember that this is one of the properties of the Standard Atmosphere)
● So then, if a station located 5,000 feet ASL found the mercury to be 25 inches high in the barometer tube (Station Pressure) it would translate and report this reading as 30 inches.
Altimeter setting = isa temperature adjusted
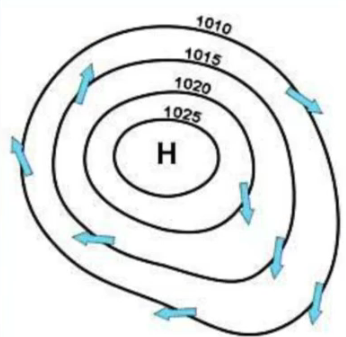
Isobars
● If we were to take a plotted chart of sea level pressures we could then start connecting the areas of equal pressure.
● We would call these resulting lines of equal pressure Isobars.
● Isobars are generated by correcting for Mean Sea Level Pressure.
● The standard is to have isobars shown as being 4 hectopascals apart
● On a map these isobars show us where the pressures are relatively high and low.
● They also indicate whether the pressure changes are gradual or dramatic over a given distance
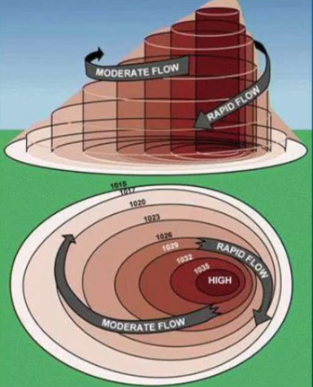
Pressure Gradient
● The distance and location of these isobars relative to one another gives us important information about how the air is moving.
● Air will flow from areas of high pressure to areas of low pressure and we call this moving air wind
● The change in pressure over a given distance can be defined as the Pressure Gradient.
● Isobars packed tightly together would be a steep pressure gradient.
● The steeper the pressure gradient the stronger the wind
Horizontal Pressure Differences
● One reason that pressure changes horizontally is due to the fact that atmospheric heating occurs differently at different times and places.
● Warm air that is rising will tend to create areas of low pressure while areas of cooler and denser air will sink creating areas of high pressure
Pressure Systems and Their Variations
● For the purposes of mapping the weather there are two main types of pressure areas:
➢ High Pressure Systems
➢ Low Pressure Systems
● In addition to these we can also have the following pressure systems:
➢ Troughs
➢ Ridges
➢ Cols
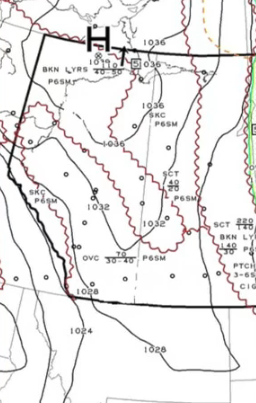
High Pressure Centres

● These are areas where the air is sinking.
● The general flow around a high is one in which the air is rotating clockwise and gently flowing outward from the centre in the Northern hemisphere.
● Also called an Anticyclone.
● Indicated on a weather map by a blue "H."
● Put another way, in high pressure systems, the air is diverging and descending.
● High Pressure areas can be caused by a drop in temperature.
● As temperature drops the density of the air increases and it will tend to “sink” and spread out.
● In all cases an area of high pressure is a region of subsiding air.
Type of Weather with a High
● The sinking air in the vicinity of a high pressure centre suppresses the upward motion that is needed to support the development of clouds and precipitation.
● Fair weather is commonly associated with an area of high pressure.
● Expect fewer clouds, good visibility, light winds, and that a high can remain stationary for days at a time, with a chance of early morning fog.
Low Pressure Centres
● These are areas of rising air rotating counterclockwise with a strong inward flow in the Northern hemisphere.
● Also called a Cyclone.
● A low pressure centre is indicated on a weather chart by a red "L.”
● The air is converging and ascending.
● Low pressures are caused by convergence or air coming into a region being forced to rise.
● This causes the air to expand and become less dense as it rises.
● Expect thunderstorms, rain, hail, or snow.
● The wind moves at a slight angle to the isobars.
Types of Weather with a Low
● Rising motion in the vicinity of a low pressure centre favours the development of clouds and precipitation.
● Cloudy weather and precipitation are commonly associated with an area of low pressure.
● Lows tend to be very quick moving, rarely staying in one place.
➢ In the summer they can move about 500 miles per day.
➢ In the winter they will be faster, typically 700 miles per day
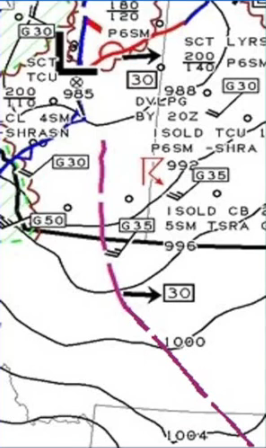
Troughs
● This is an elongated area of low pressure.
● A trough is likely to bring about a windshift at the surface.
● Low pressure trough symbol is a long purple line.
● Most troughs bring clouds, showers, and a wind shift, particularly following the passage of the trough. This results from convergence or squeezing which forces lifting of moist air behind the trough line.
● Fronts, because they result in a kink in the isobars, always have a trough associated with them
Ridges
● These are areas of elongated high pressure with a low pressure on each side.
● Fair weather is associated.
● Although it is rare to see the symbol for a ridge on weather maps, it would resemble a sawtooth pattern if it was depicted
Col
● This is a neutral region between two highs and two lows.
● Weather at a col tends to be unsettled.
● Expect fog in wintertime.
● Expect showers and thunderstorms in summertime
Effects of Temperature on Pressure
● Imagine that we had a sealed column or a parcel of air that was at a set temperature and pressure.
➢ (For this discussion it doesn't matter whether it is an area of high pressure or low pressure)
● If we were to heat this parcel of air the molecules inside would get excited and speed up.
● This would result in the container attempting to expand and the pressure inside would also be seen to rise.
➢ (This is because the molecules would hit the scale or barometer with more force)
● From this thought experiment, we can see that if we allowed the air to expand outside the container and into a larger one that it would maintain the same original pressure.
● What this means is that at a given pressure warm air will take up a greater volume than cold air. (Boyle's Law.)
● In the atmosphere this greater volume will typically exert itself by moving vertically upwards
● Put this all together and we have the following:
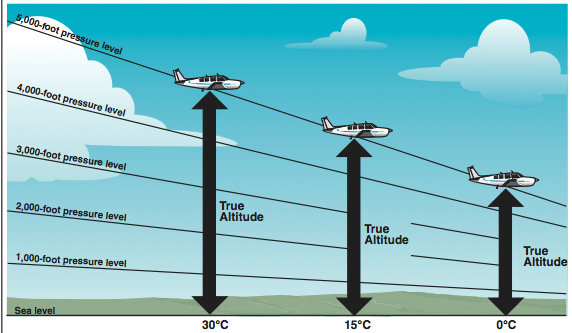
➢ For a given constant pressure warmer air will have a HIGHER or GREATER height (true altitude) than cooler air.
➢ For a given constant pressure warm air will be less dense than cold air.
➢ In terms of vertical depth, moving the same distance upwards or downwards through a warm column of air will result in a SMALLER pressure change as compared to colder air
● These effects can be seen easily when one flies in the wintertime and then in the summertime.
● At the same given altimeter setting an aircraft will be much closer to the obstacle in wintertime as opposed to the summertime.
➢ denser air = lower altitude