Covers all chapters but also focuses on these last ANOVA, Chi-Square, Regression chapters.
True/False: ANOVA is a test that can only determine whether two group means are significantly different.
False because the test determines wether TWO OR MORE group means are statistically different.
We should conduct the LSD test _____
when we fail to reject the null hypothesis
regardless of whether we reject or fail to reject the null hypothesis.
when we reject the null hypothesis
When we reject the null hypothesis
True/False: Within-group variation indicates how much the groups are different from each other.
False because that is the definition of between-group variations
Within-group variation: How much the members within the same group
are different
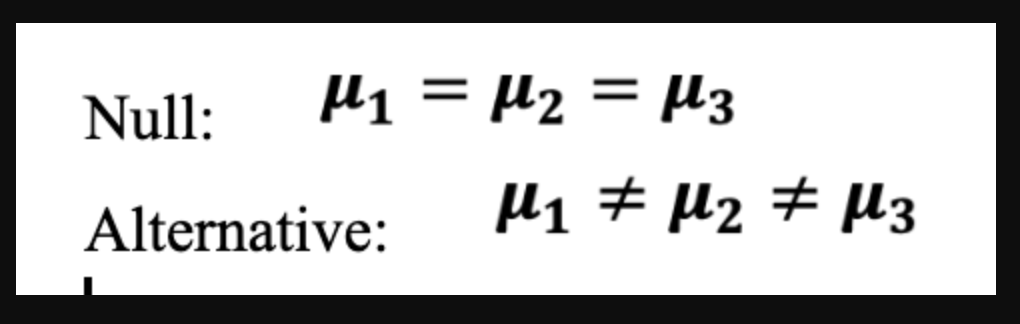
Jake wants to know which sport UNT students like the most. Jake decides to conduct research using ANOVA test and forms the following hypotheses:
Null hypothesis: average liking for football, baseball, and basketball are not all equal.
Alternative hypothesis: there is no difference in average liking for football, baseball, and basketball.
(He did or did NOT form his hypothesis correctly)
He did not form his hypothesis correctly
The correct version would be switched like:
Null: There is no difference
Alt: __ are NOT all equal
The chi-square test is used to compare:
a) Means of two groups
b) Frequency distributions between groups
c) Variances of two groups
d) Slopes of two regression lines
Frequency distributions between groups
If the p-value from a chi-square test is less than the significance level (e.g. 0.05), we should:
a) Fail to reject the null hypothesis
b) Reject the null hypothesis
c) Do nothing, the test is inconclusive
d) Increase the significance level
Reject the null hypothesis
If the calculated chi-square statistic is greater than the critical value from the chi-square distribution table, we should:
a) Fail to reject the null hypothesis
b) Reject the null hypothesis
c) Do nothing, the test is inconclusive
d) Increase the significance level
Reject the null hypothesis
Do Netflix members enjoy more comedy, drama or thriller movies?
.. Is what type of test?
ANOVA because we are determining two or more group means that are statistically different from one another
When we conduct an ANOVA test, we need to choose between
conducting a one-tailed test and a two-tailed test.
True/False
False, We will always conduct a 2-tailed test, and our significance is 0.05
We use chi-square test when the dependent variable is measured by an
interval or ratio scale. True/False
False,
True/False Chi-square statistics follow a normal distribution.
False, Chi-square follows the chi-square distribution
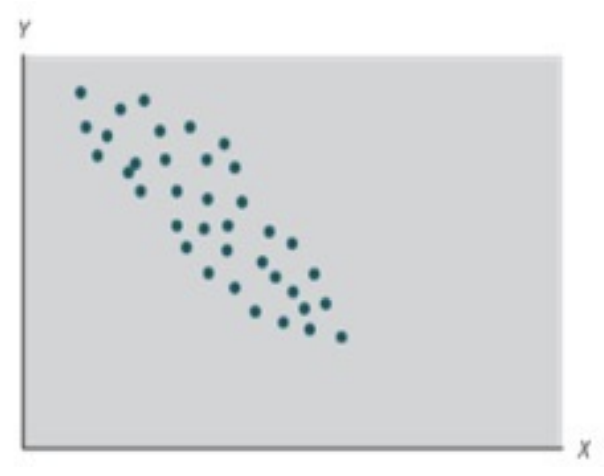
Based on the graph below, the independent variable and dependent variable likely have…
a strong, negative relationship
a weak, positive relationship
a weak, negative relationship
no relationship
a strong, positive relationship
A strong, negative relationship
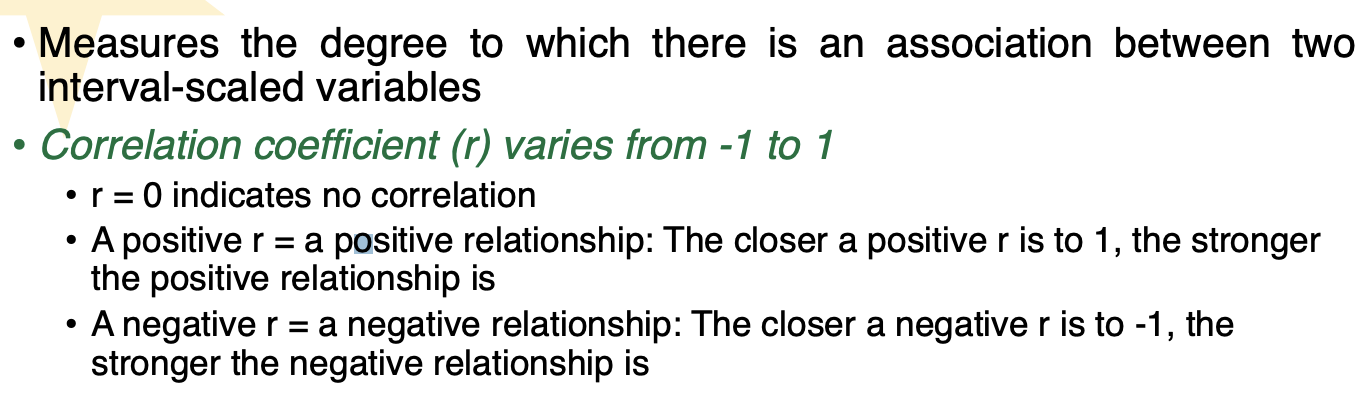
True/False A correlation coefficient of -.08 indicates a weaker relationship compared to a correlation coefficient of +0.5
False, -.08 is closer to -1 than 0.5 is to 1
Regression analysis assumes there is a straight-line relationship
between the independent and dependent variables. True/False
True: Regression analysis is a statistical technique that uses information about the relationship between an independent variable (predictor) and a dependent variable (outcome) to make predictions
Norma is tasked with finding if there is a difference between the teaching styles of three teachers. To do so, she must assess the math test scores for the three separate classes. Which of the following statements accurately represents a null hypothesis?
a. There is a significant difference between the mean scores of the classes.
b. The teachers have a positive effect on the math test scores.
c. The correlation coefficient between the three classes is greater than zero.
d. The mean scores of the classes are not all equal
The mean scores of the classes are not all equal
What test is used to compare the means of three or more means to determine
whether significant differences exist among them?
a. Chi-square
b. ANOVA
c. Paired T-test
d. T-test.
ANOVA
A post-hoc test such as LSD test should be conducted after we conclude that there is no difference in the group means from the ANOVA test.
True/False
False, Post-hoc tests tell us which means are different from each other. Ifthere is no difference between the means, then there is no need toconduct the post-hoc test
What decision should be made if the p-value obtained from ANOVA is 0.03 and the significance level is 0.05?
a. Reject the null hypothesis
b. Fail to reject the null hypothesis
c. Accept the null hypothesis
d. The decision cannot be made based on the p-value alone
Reject the null hypothesis
Rejecting the null hypothesis in an ANOVA indicates that there is a significant difference between all pairs of group means True/False
False
A group of researchers is conducting a study to examine the relationship
between gender and voting preference in a particular region. They collect data
from 500 individuals, recording their gender (male or female) and voting
preference (Candidate A, Candidate B, or Undecided). After gathering the
data, the researchers plan to use a chi-square test of independence to
analyze whether there is an association between gender and voting
preference. What will be the alternate hypothesis for this test?
a. There is no association between gender and voting preference.
b. There is a significant association between gender and voting preference.
c. Gender and voting preference are dependent on each other.
d. Gender and voting preference are independent of each other
There is a significant association between gender and voting preference.
Chi-square tests are appropriate for analyzing the relationship between two continuous variables (i.e., variables measured using interval or ratio scales).
True/False
False
If the chi-square test statistic is 15.72 and the critical value at a significance
level of 0.05 is 9.488, what decision should be made?
a. Reject the null hypothesis.
b. Fail to reject the null hypothesis.
c. Accept the alternative hypothesis.
d. The decision cannot be made based on the chi-square value alone.
Reject the null hypothesis.
The chi-square test is used to determine whether there is a significant difference between the observed and expected frequencies of categorical data.
a. True
b. False
True
What does a correlation coefficient of -0.75 indicate about the relationship between two variables?
a. A strong positive relationship
b. A weak positive relationship
c. A strong negative relationship
d. A weak negative relationship
A strong negative relationship
A correlation coefficient of 3 indicates a perfect positive linear relationship between two variables True/False
False
Which of the following correlation coefficients indicates the strongest positive
relationship between two variables?
- 0.90
0.05
0.25
- 0.70
0.25
In terms of the strength of the relationship, a relationship with a correlation coefficient of -.90 represents a weaker relationship than one with a correlation coefficient of 0.60 True/False
False
If A is strongly correlated with B, we can conclude that A causes changes in B
true/false
False
What does the coefficient of determination (R-squared) measure in simple regression analysis?
a. The proportion of variance in the independent variable explained by the dependent variable
b. The significance of the relationship between the independent and dependent variables
c. The slope of the regression line
d. The proportion of variance in the dependent variable explained by the independent variable
The proportion of variance in the dependent variable explained by the
independent variable
The coefficient of determination (R-squared) in simple regression analysis
measures the proportion of the total variation in the independent variable that
is explained by the dependent variable
True/False
False
If the slope coefficient in a simple linear regression model is 0.5, what does this imply?
a. There is no relationship between the independent and dependent variables
b. For every one-unit increase in the independent variable, the dependent variable decreases by 0.5 units
c. For every one-unit increase in the independent variable, the dependent variable increases by 0.5 units
d. There is not enough information
For every one-unit increase in the independent variable, the dependent variable increases by 0.5 units
In simple regression analysis, the slope coefficient represents the change in the dependent variable for a one-unit increase in the independent variable, holding all other variables constant True/False
True
If the p-value associated with the slope coefficient is less than the chosen significance level (e.g., 0.05), what does it indicate about the relationship between the independent and dependent variables?
a. The relationship is statistically significant
b. The relationship is weak
c. The relationship is negative
d. The relationship is nonlinear
The relationship is statistically significant
_____ a test that can determine whether two or more group means are statistically different from one another
ANOVA test
____ compares the frequency distributions of the dependent variable
It's used to determine whether there's a significant difference between the expected distribution of a variable and the distribution actually observed.
Chi-Square
A retailer wants to know whether there is a significant association between customers’ biological sex and soda choice
• There will be four possible categories:
• Women, prefer Coke
• Women, prefer Pepsi
• Men, prefer Coke
• Men, prefer Pepsi
What type of test is this?
Chi-Square because we’re comparing the frequency distributions of the dependent variable