MATHS - Ju + J (Yr12 stats)
1/23
There's no tags or description
Looks like no tags are added yet.
Name | Mastery | Learn | Test | Matching | Spaced | Call with Kai |
|---|
No analytics yet
Send a link to your students to track their progress
24 Terms
what are the mathematical sampling methods
Common methods include:
random sampling
stratified sampling
cluster sampling
systematic sampling
quota sampling
what is quota sampling
Quota sampling is a non-probability sampling method where researchers ensure equal representation of different subgroups by setting quotas for each category, based on specific characteristics like age, gender, or income.
what is cluster sampling
Cluster sampling is a probability sampling method where the population is divided into clusters, usually geographically, and entire clusters are randomly selected for inclusion in the sample.
groups of convenience over relevant factors.
strengths of each sampling method
strengths:
random sampling reduces bias and increases generalizability
stratified sampling ensures representation of subgroups
cluster sampling is cost-effective for large populations
systematic sampling simplifies the selection process
quota sampling allows for demographic representation without randomization.
limitations of each sampling methods
Limitations include:
random sampling can be impractical for large groups
stratified sampling may require detailed population data
cluster sampling might introduce sampling error if clusters are not homogeneous
systematic sampling can lead to bias if there is an unseen pattern
quota sampling lacks randomness, which can affect representativeness.
what are the conditions that are needed for binomial distribution to be helpful
number of trials is fixed
each outcome is either success or failure
the trials are independent of each other
probability of success is the same in each trial
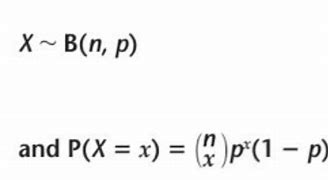
what is the eq. for binomial distribution and what do the symbols stand for
The equation for binomial distribution is
( P(X = k) = \binom{n}{k} p^k (1-p)^{n-k} ),
where
( n ) is the number of trials
( k ) is the number of successes
( p ) is the probability of success
( \binom{n}{k} ) is the binomial coefficient.
what are the steps one the calculator for solving binomial distribution
stats - dist - binomial - Bpd
Bpd - fixed no.
Bcd - cumulative
IvB - inverse (don’t need now)
what is the formula for binomial distribution
P(X=x) = nCx p^x (1-p)^{n-x}
what are the equations for variance and mean given that X - B(n,p)
mean = np
Variance = np(1-p)
what is the order of values when using Binomial distribution in run
(x,n,p)
what is the null hypothesis
The null hypothesis is a statement used in statistical testing that indicates no effect or no difference in a given context.
denoted as H0.
what is the alternative hypothesis
The alternative hypothesis is a statement used in statistical testing that indicates there is an effect or a difference in a given context.
denoted as H1
what is a significance level
The significance level is the probability of rejecting the null hypothesis when it is true, typically denoted by alpha (α). It is used to determine the threshold for statistical significance in hypothesis testing.
a cut off number
what are the steps to determining whether a statistical hypothesis should be rejected or not
state the H0 and H1 and determine the value of P
find the probability of the suggested occurrence in your sample happening
compare this to your significance level
if Prob. < sig, level is too small the H0 is rejected
if Prob. > sig. level this is accepted
what are one tailed tests
when P is either < or > something
what are two tailed tests
when P does not = something
how do you calculate one tailed tests
if P > something
calculate P(X>/=__)
if P < something
calculate P(X</=__)
how do you calculate two tailed tests
half the sig, level OR double the probability
calculate the proportion of from the sample and compare with P.
if P > something
calculate P(X>/=__)
if P < something
calculate P(X</=__)
what is meant by a critical region
a region in which the H0 would be rejected.
choose the value for n that is the closest to the significance level w/o exceeding it.
how would I answer a question if the probability exceeded the significance level
do not reject the H0
the 3 steps to answering a question on the critical region for a two tailed test
the H1 will be p does not equal something
the critical region will have two parts
HALVE the significance level
golden rule for the critical region
the critical region is always less than or equal to the significance level
what is the TRUE significance level
the probability of the critical region (add both together)