APES Unit 2: Ecological Succession
1/3
There's no tags or description
Looks like no tags are added yet.
Name | Mastery | Learn | Test | Matching | Spaced | Call with Kai |
|---|
No analytics yet
Send a link to your students to track their progress
4 Terms
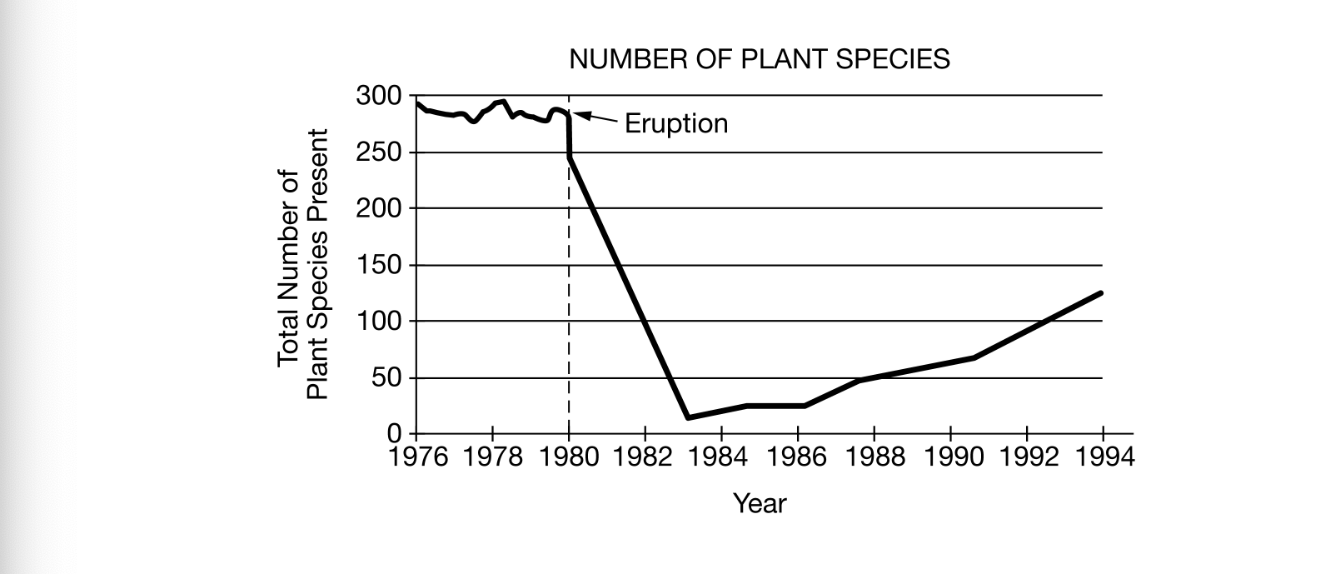
Based on the data shown in the graph, which of the following best describes how ecologists could determine when this ecosystem is approaching a climax community?
A) Determine if the keystone species in the ecosystem is present two years after the volcanic eruption
B) Measure the biomass of the pioneer species present before and after the volcanic eruption
C) Record the number and type of producers present every year after the eruption
D) Calculate the net primary productivity of a specific indicator species every year after the eruption
C) Record the number and type of producers present every year after the eruption
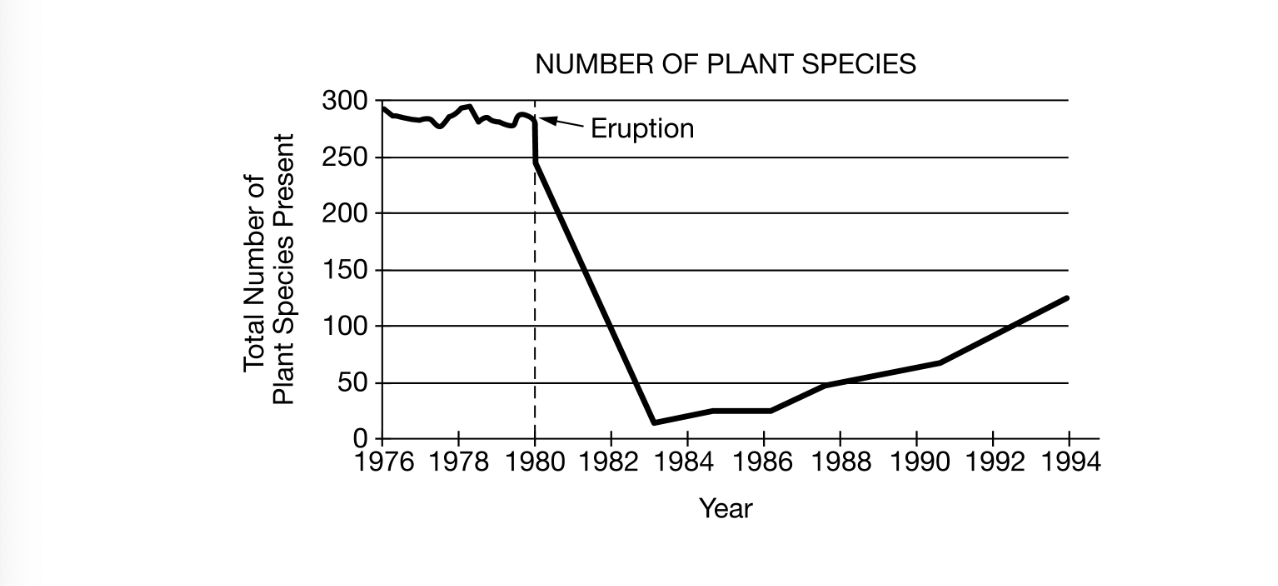
Based on the data shown in the graph, when would the species richness of the ecosystem have been the lowest?
A) Before the volcanic eruption occurred
B) One to four years after the volcanic eruption
C) Four to ten years after the volcanic eruption
D) Ten to fourteen years after the volcanic eruption
B) One to four years after the volcanic eruption
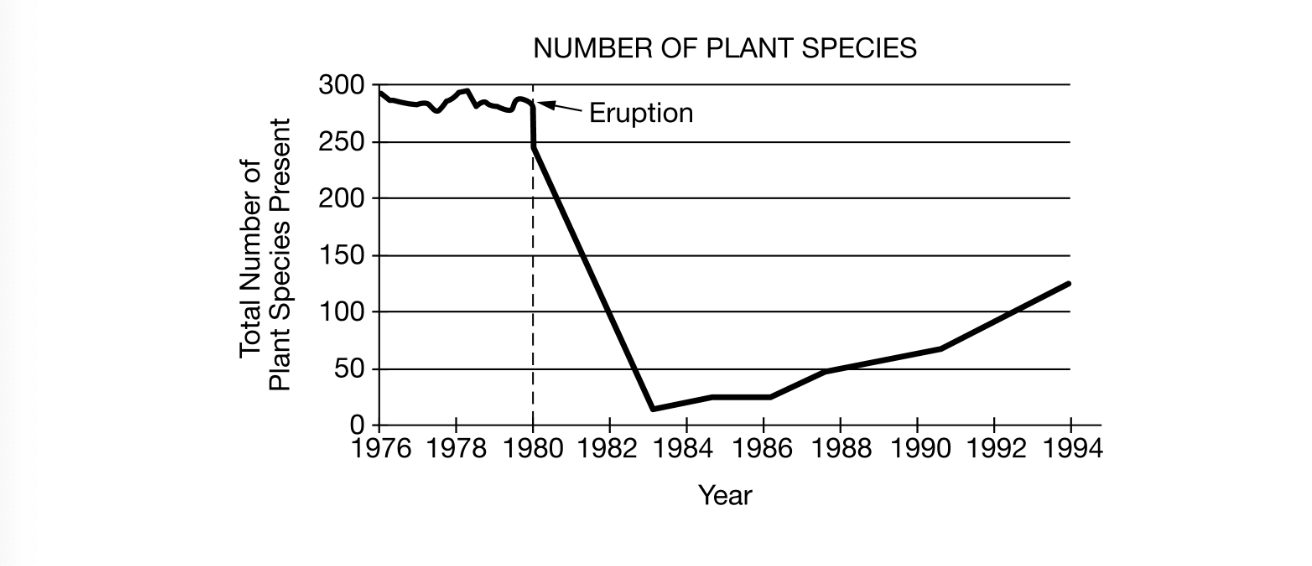
Which of the following claims is best supported by the data in the graph?
A) The temperature of Earth rises and biodiversity increases immediately after a volcanic eruption.
B) The carrying capacity of plants in the area is approximately 250 species.
C) After the volcanic eruption, pioneer species colonized the area and the ecosystem began to undergo succession.
D) Plant species that are well adapted will survive and reproduce, leading to a change in the ecosystem biodiversity through the process of natural selection.
C) After the volcanic eruption, pioneer species colonized the area and the ecosystem began to undergo succession.
Hope you did well
lol