Research Design and Statistics Exam 7
0.0(0)
Studied by 1 personCard Sorting
1/106
Earn XP
Description and Tags
Last updated 11:42 PM on 11/7/22
Name | Mastery | Learn | Test | Matching | Spaced | Call with Kai |
|---|
No analytics yet
Send a link to your students to track their progress
107 Terms
1
New cards
descriptive statistics
Summarize the characteristics of a sample.
2
New cards
Examples of descriptive statistics
measures of central tendency
measures of variation/dispersion
Shape/type of distribution
measures of variation/dispersion
Shape/type of distribution
3
New cards
inferential statistics
Test for significant differences between groups and/or significant relationships among variables
4
New cards
Examples of inferential statistics
t-ratio
F-ratio
Chi-square
etc...
F-ratio
Chi-square
etc...
5
New cards
dependent variable
The outcome factor; the variable that may change in response to manipulations of the independent variable.
6
New cards
independent variable
The experimental factor that is manipulated; the variable whose effect is being studied.
7
New cards
interval variable
a variable used for observations that have numbers as their values; the distance (or interval) between pairs of consecutive numbers is assumed to be equal. Zero has no meaning
8
New cards
ratio variable
a variable that meets the criteria for an interval variable but also has a meaningful zero point
9
New cards
mean
the arithmetic average of a distribution, obtained by adding the scores and then dividing by the number of scores. Influenced by outliers
10
New cards
Mode
the most frequently occurring score(s) in a distribution.
Only measure of central tendency that can be analyzed with qualitative/categorical data
Only measure of central tendency that can be analyzed with qualitative/categorical data
11
New cards
bimodal distribution
A distribution (of opinions) that shows two responses being chosen about as frequently as each other.
12
New cards
Sample distribution
Just the distribution of the data from the sample
13
New cards
sampling distribution
the distribution of values taken by the statistic in all possible samples of the same size from the same population
14
New cards
Histogram
a bar graph depicting a frequency distribution.
15
New cards
absolute frequency
the number of times a score or value occurs in a data set
16
New cards
relative frequency
the fraction or percent of the time that an event occurs in an experiment
17
New cards
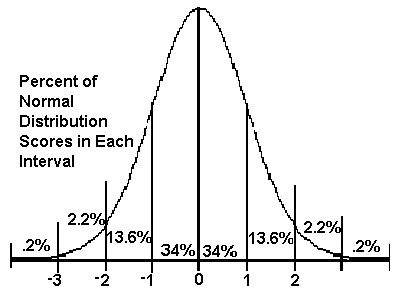
normal distribution
A function that represents the distribution of variables as a symmetrical bell-shaped graph.
18
New cards
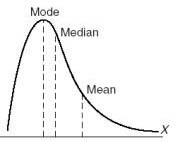
skewed distribution
a representation of scores that lack symmetry around their average value
19
New cards
positively skewed
a distribution that trails off to the right
20
New cards
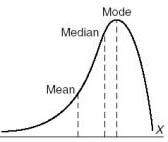
negatively skewed
a distribution that trails off to the left
21
New cards
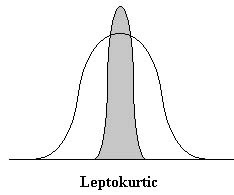
Leptokurtic
normal curves that are tall and thin, with only a few scores in the middle of the distribution having a high frequency
22
New cards
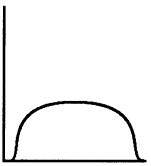
Platykurtic
flat curve
23
New cards
standard deviation
a computed measure of how much scores vary around the mean score. Inflated by outliers
24
New cards
Standard deviation and distribution
1 SD = 68%
2 SD = 95%
3 SD = 99%
2 SD = 95%
3 SD = 99%
25
New cards
coefficient of variation
A measure of relative variability computed by dividing the standard deviation by the mean and multiplying by 100. Measures variation compared to the size of the mean
26
New cards
standard error of the mean
estimate variability of population, degree of error associated with repeated samples. Estimates precision of the sample mean
27
New cards
interquartile range
The difference between the upper and lower quartiles.
28
New cards
confidence interval
the range of values within which a population parameter is estimated to lie. Measure of precision
29
New cards
z-score
a measure of how many standard deviations you are away from the norm (average or mean)
30
New cards
level of confidence
probability that you're right, estimation that the population mean is correct
31
New cards
probability error
probability that you're wrong, level of chance occurs
32
New cards
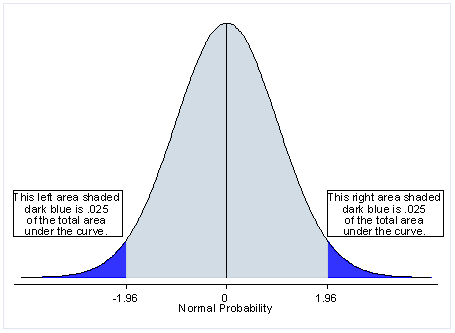
two-tailed test
A hypothesis test in which rejection of the null hypothesis occurs for values of the test statistic in either tail of its sampling distribution.
Simply checking for differences (exercise protocol in land or water produce more strength gains)
Simply checking for differences (exercise protocol in land or water produce more strength gains)
33
New cards
one-tailed test
a hypothesis test in which the research hypothesis is directional, positing either a mean decrease or a mean increase in the dependent variable, but not both, as a result of the independent variable. (will an exercise protocol on land produce greater strength gains)
34
New cards
null hypothesis
a statement or idea that can be falsified, or proved wrong
35
New cards
alternative hypothesis
The hypothesis that states there is a difference between two or more sets of data.
36
New cards
Steps in Hypothesis Testing
-state null and alternative hypotheses
-Determine level of significance
-Compute test statistic
-Make a decision
-Relate statistical hypothesis back to research hypotheses
-Determine level of significance
-Compute test statistic
-Make a decision
-Relate statistical hypothesis back to research hypotheses
37
New cards
p-value
The probability level which forms basis for deciding if results are statistically significant (not due to chance).
38
New cards
alpha value
level at which significance is decided. Typically .05. Avoid type I error
39
New cards
Type 1 error (alpha)
Rejecting null hypothesis when it is true (false positive)
40
New cards
Type II error (beta)
acceptance of the null hypothesis when the null hypothesis is false (false negative)
41
New cards
statistical power
the likelihood of finding a statistically significant difference when a true difference exists. 1-type II error. Probability of avoiding a type II error
42
New cards
hypothesis testing limitations
-never know the truth
-skirts around the issue
-bound by tradition
-skirts around the issue
-bound by tradition
43
New cards
range
the difference between the highest and lowest scores in a distribution
44
New cards
Variance
a measure of the spread of the recorded values on a variable. Larger variance=further from the mean and vice versa
45
New cards
Median
the middle score in a distribution; half the scores are above it and half are below it. Is not impacted by outliers
46
New cards
effect size
a measure of the strength of the relationship between two variables or the extent of an experimental effect. Represents the number of SD's by which the score changes from baseline to post-treatment
47
New cards
beta level
probability of making a type II error
48
New cards
How power can be used
-A priori
-Post hoc
-Post hoc
49
New cards
Factors affecting statistical power
-Mean differences (greater discrepancy=more powerful)
-Sample size (Larger sample=smaller SEM=more power)
-1 vs 2 tailed-tests (One tailed=more powerful due to altered critical value)
-Sample size (Larger sample=smaller SEM=more power)
-1 vs 2 tailed-tests (One tailed=more powerful due to altered critical value)
50
New cards
sample size estimation
Estimate the size of sample necessary to accomplish the purposes of the study
-Alpha level
-Desired power
-Effect size
-Alpha level
-Desired power
-Effect size
51
New cards
When lower sample size can be used
-Anticipate finding a large discrepancy
-Less variability in the measurement
-Greater risk of type II error
-Alpha is set at 0.05 rather than 0.01
-A one-tailed test is appropriate
-Less variability in the measurement
-Greater risk of type II error
-Alpha is set at 0.05 rather than 0.01
-A one-tailed test is appropriate
52
New cards
Inference
decisions based on probability
53
New cards
Tools to evaluate the effect of an intervention
-Statistical differences
-Effect size
-Minimally clinically important difference
-Dichotomous outcomes
-Effect size
-Minimally clinically important difference
-Dichotomous outcomes
54
New cards
Minimally Clinically Important Difference (MCID)
The smallest difference in a measured variable that signifies an important rather than trivial difference in the patient's condition. The smallest difference a patient or clinician would perceive as beneficial, and that would result in a change in the management of the patient.
55
New cards
standard error of measurement
Variation in scores due to unreliability of the scale/measure used. Precision error
56
New cards
Minimal Detectable Change (MDC)
the amount of change that just exceeds the standard error of measurement of an instrument. Minimal amount change that isn't likely due to chance variation
57
New cards
Determines MCID
-Expert consensus (doesn't involved patients)
-Anchor based (could cause bias but includes the patients)
-Anchor based (could cause bias but includes the patients)
58
New cards
dichotomous outcome
when only two options are available to a question, such as "yes" or "no". Responders/showed improvement vs non-responders/showed no improvement
59
New cards
Absolute Benefit Increase (ABI)
the absolute value of the difference in rates of positive outcomes between the intervention group and the control group (expressed as a percentage)
60
New cards
Relative Benefit Increase (RBI)
the absolute value of the rate of increase in positive outcomes for the intervention group relative to the control group (expressed as a percentage)
61
New cards
Number needed to treat
represents the number of patients who must be treated in order to prevent one adverse event. 1/ABI. Smaller NNT in short time frame can be interpreted as a great benefit
62
New cards
Scatter plot
A graph with points plotted to show a possible relationship between two sets of data.
63
New cards
Venn Diagram
Diagram used to communicate a relationship between three variables
64
New cards
line graph
Communicates a comparison, displays a pattern or trend over time. Used only if both variables are numbers
65
New cards
bar chart
Used when only the dependent variable is numerical. Shows a comparison
66
New cards
pie chart
a chart that shows the relationship of a part to a whole
67
New cards
stacked bar chart
A bar chart in which each bar is broken into rectangular segments of a different color showing the relative frequency of each class in a manner similar to a pie chart.
68
New cards
Graphs for distribution
One variable=bar graph or histogram
two variables=scatter chart
three variables=3D chart
two variables=scatter chart
three variables=3D chart
69
New cards
Figures
No titles, legends and captions only.
70
New cards
Figure captions
-Brief title/heading
-Experimental details
-Definitions of symbols, lines, bar patterns, abbreviations
-Statistical information
-Experimental details
-Definitions of symbols, lines, bar patterns, abbreviations
-Statistical information
71
New cards
Tables
Present numerical data but do not use relationships or trends. Should have a title
72
New cards
Scientific merit components
-Relevance
-Originality
-Importance
-Design/methodology
-Analysis/interpretation
-Originality
-Importance
-Design/methodology
-Analysis/interpretation
73
New cards
Formal research session
-10-15 minutes
-12-18 slides (1 slide/minute)
-3-5 minute question period
-12-18 slides (1 slide/minute)
-3-5 minute question period
74
New cards
Platform/podium presentations evaluation
-Scientific merit
-Presentation style
-Technical aspects
-Presentation style
-Technical aspects
75
New cards
Presentation technique
-Organize content
-Explain graphics
-Stick to time allowed
-Limit note use
-Anticipate questions
-Explain graphics
-Stick to time allowed
-Limit note use
-Anticipate questions
76
New cards
Fonts
-No more than 2 used
-At least 28 pt for text and 40 for titles
-Limit bold, italics, and underline
-Avoid all caps
-At least 28 pt for text and 40 for titles
-Limit bold, italics, and underline
-Avoid all caps
77
New cards
Technical aspects
-Six lines a slide and 6 words a line
-Phrases
-Bullets
-Consistency
-Alignment
-Graphics (don't overdo)
-Phrases
-Bullets
-Consistency
-Alignment
-Graphics (don't overdo)
78
New cards
Poster presentations
Stimulate interaction about results
-Identify 2-3 key points
-Select relevant methods and results
-Adapt to audience
-Handouts and anticipate questions
-30 seconds=gist of poster
-10 minutes= all införmation
-Identify 2-3 key points
-Select relevant methods and results
-Adapt to audience
-Handouts and anticipate questions
-30 seconds=gist of poster
-10 minutes= all införmation
79
New cards
Poster mechanics
Left to right and up to down
-Serif fonts
-Concise
-50:50 graphics to text
-Serif fonts
-Concise
-50:50 graphics to text
80
New cards
Thematic poster presentation
Posters are grouped by a general theme
-More informal
-3-5 minute summary
-Audience asks questions
-More informal
-3-5 minute summary
-Audience asks questions
81
New cards
Parametric
inferential statistical tests involving interval- or ratio-level data to make inferences about the population. Data fits a normal distribution
82
New cards
non-parametric
A category of statistical tests used when certain assumptions about the data are violated (i.e., normal distribution) or when using ordinal (ranked data). Examples of non-parametric tests include the sign test, Wilcox signed rank test, and the Mann Whitney test.
83
New cards
Parametrical differences tests
t-test
ANOVA
ANOVA
84
New cards
Parametrical relationships tests
correlation
regression
regression
85
New cards
Correlation
2 variables perform a synchronized way, or they are associated with each other
86
New cards
regression
a change in one variable causes a change in the other
87
New cards
r-value
Sign denotes the nature of the association and the value denotes the strength of the association
88
New cards
Positive r value
positive correlation, One variable increases the other increases and vice versa
89
New cards
negative r value
Inverse relationship
90
New cards
Limitations of correlations
-Cannot be taken to imply causation
-Does not allow us to go beyond the data that is given
-Does not allow us to go beyond the data that is given
91
New cards
spurious correlation
an apparent but false relationship between two (or more) variables that is caused by some other variable
92
New cards
Pearson product-moment correlation coefficient
A type of correlation coefficient used with interval and ratio scale data. In addition to providing information on the strength of relationship between two variables, it indicates the direction (positive or negative) of the relationship.
93
New cards
Intraclass Correlation Coefficient (ICC)
relationship among repeated measures; magnitude
94
New cards
internal consistency
Questionnaire relationships
95
New cards
Cronbach's alpha
a correlation-based statistic that measures a scale's internal reliability. If the questions within a section are correlated with each other than you can be fairly confident in the subscale information
96
New cards
Correlation test
If P
97
New cards
line of best fit
a line drawn in a scatter plot to fit most of the dots and shows the relationship between the two sets of data. Minimizes residuals
98
New cards
error/residual
Vertical distance from any point to the line. Compares predicted value vs actual value
99
New cards
standard error of estimate
Estimate variability of prediction errors when using a regression equation to predict Y from X
100
New cards
Linear regression assumptions
-Linear relationship
-Homoscedasticity
-Normality of the error distribution
-Homoscedasticity
-Normality of the error distribution