lecture 2 biostats
1/30
There's no tags or description
Looks like no tags are added yet.
Name | Mastery | Learn | Test | Matching | Spaced |
|---|
No study sessions yet.
31 Terms
Mode
Most frequently occurring value
not good summary of database
Median
Middle value wen the sample size is odd
even sample size : average of two middle values
Mean
Arithmetic average of values
Two limitations with mode
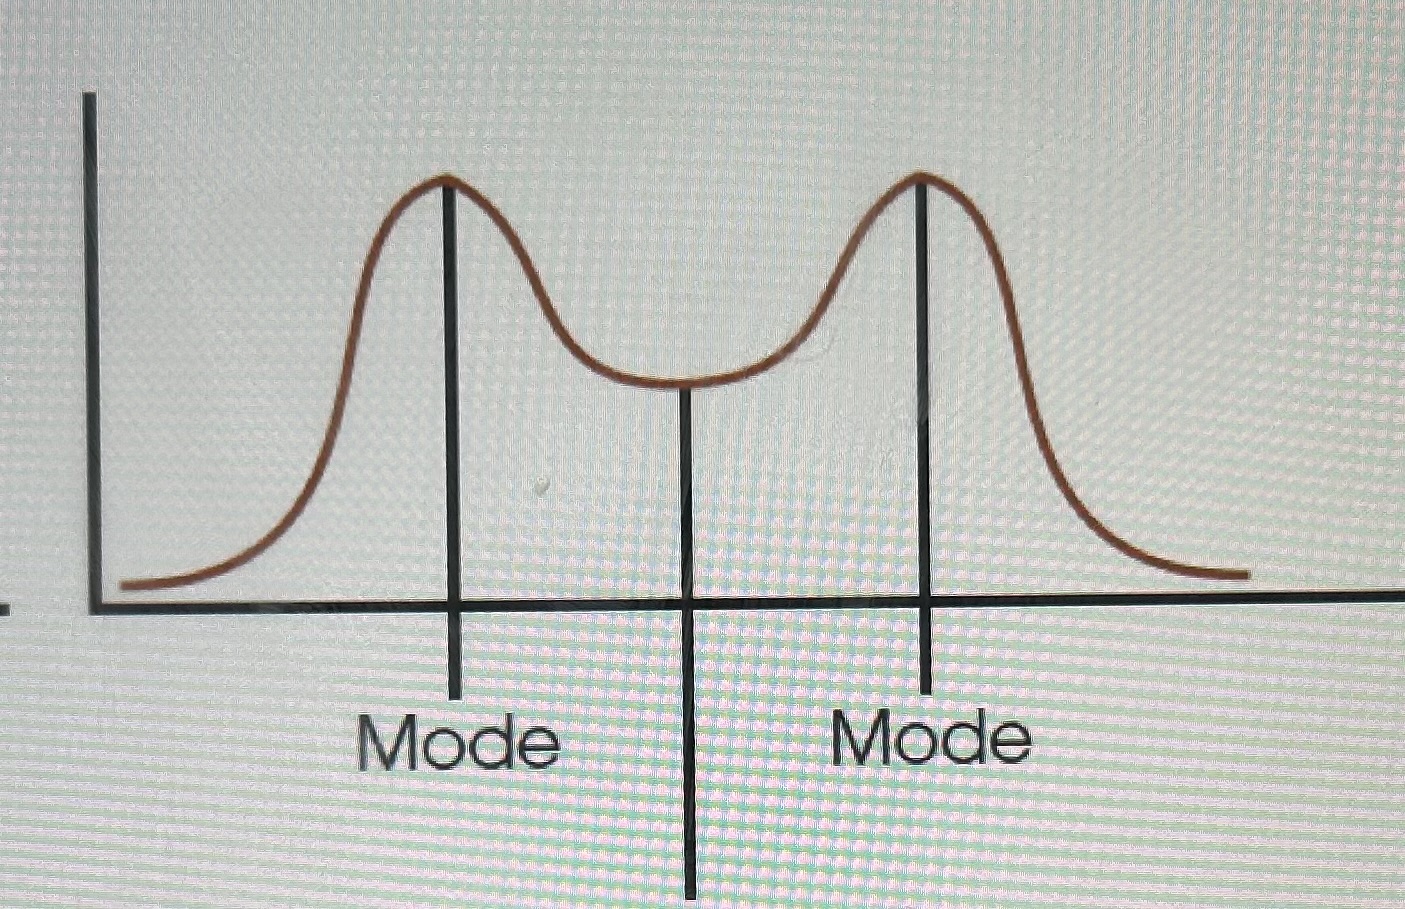
May contain scores that are all tied at the same highest frequency
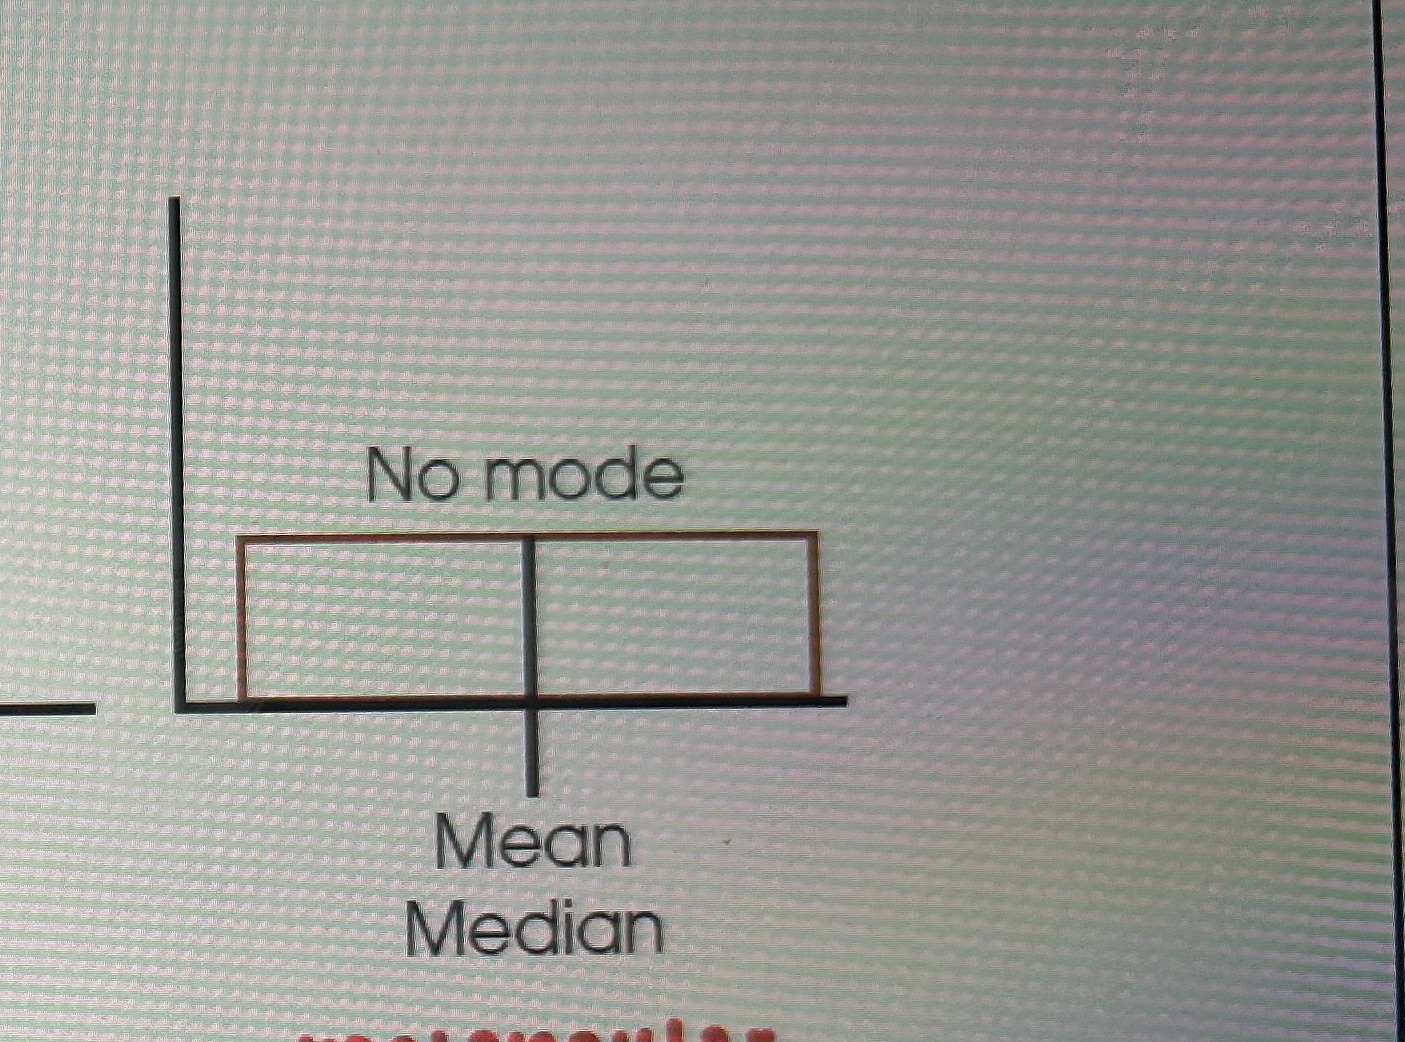
rectangular distribution ( each number has same frequency)
mode is a score of category NOT a ___
mode is a score of category NOT a Frequency
Model class is the class with the largest___
Model class is the class with the largest Frequency
Parameter
Numerical fact about population
Statistics
Number calculated from sample
Mean as balance point : what’s meant by balance ?
Sum of deviations from mean to the left balance out the sum of the deviations from the mean to the right
calculate weighted mean
(Sigma)X1+(sigma)X2/(n1+n2)
(Sigma)X- overall sum of scores in each group
N-total number of scores in each group
Calculate median
(n+1)/2th largest value odd
(n/2)th,(n+2)/2
unimodal symmetric distribution
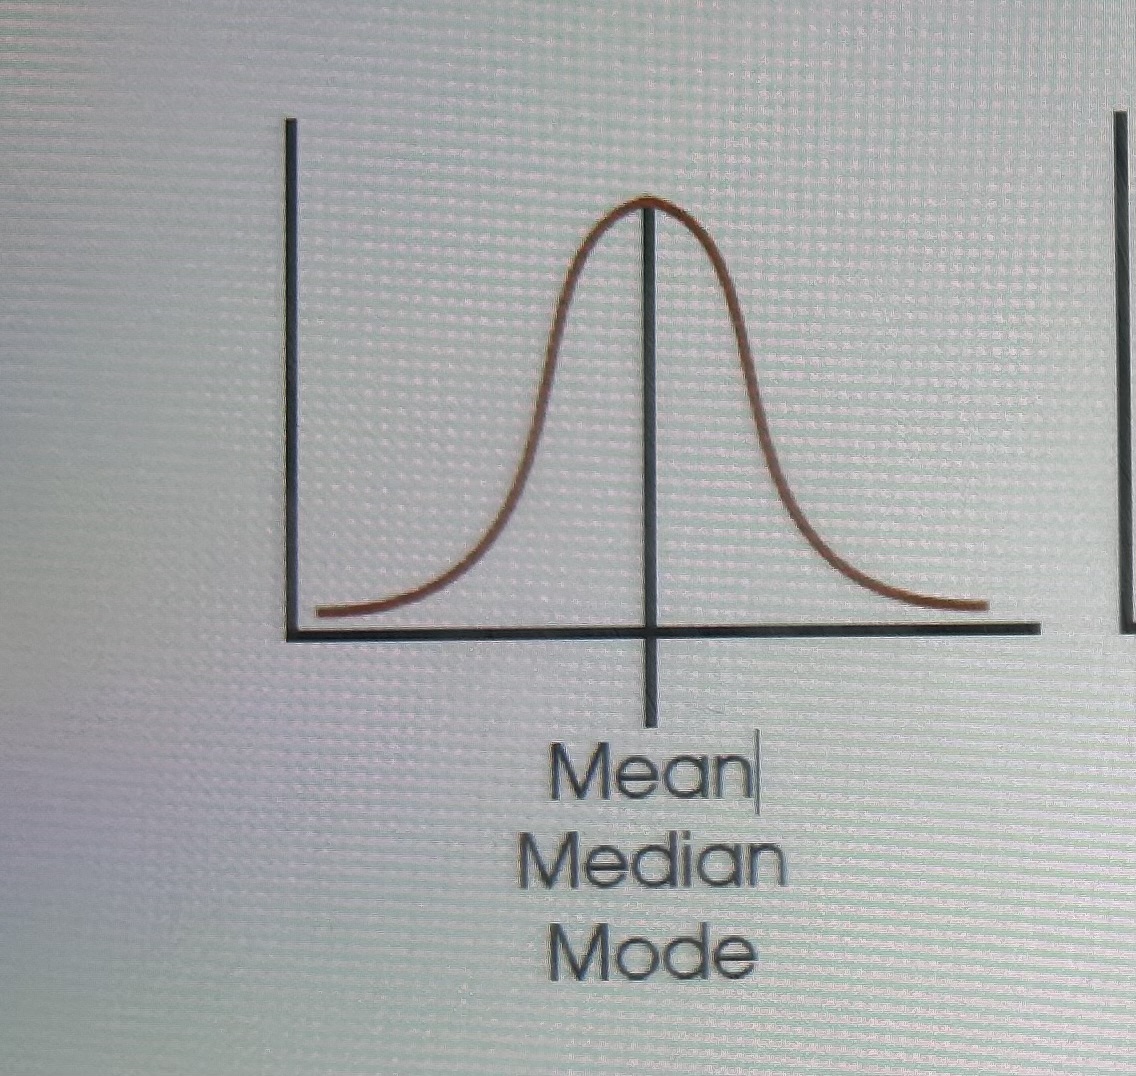
Biomedical symmetric distribution
Rectangular distribution
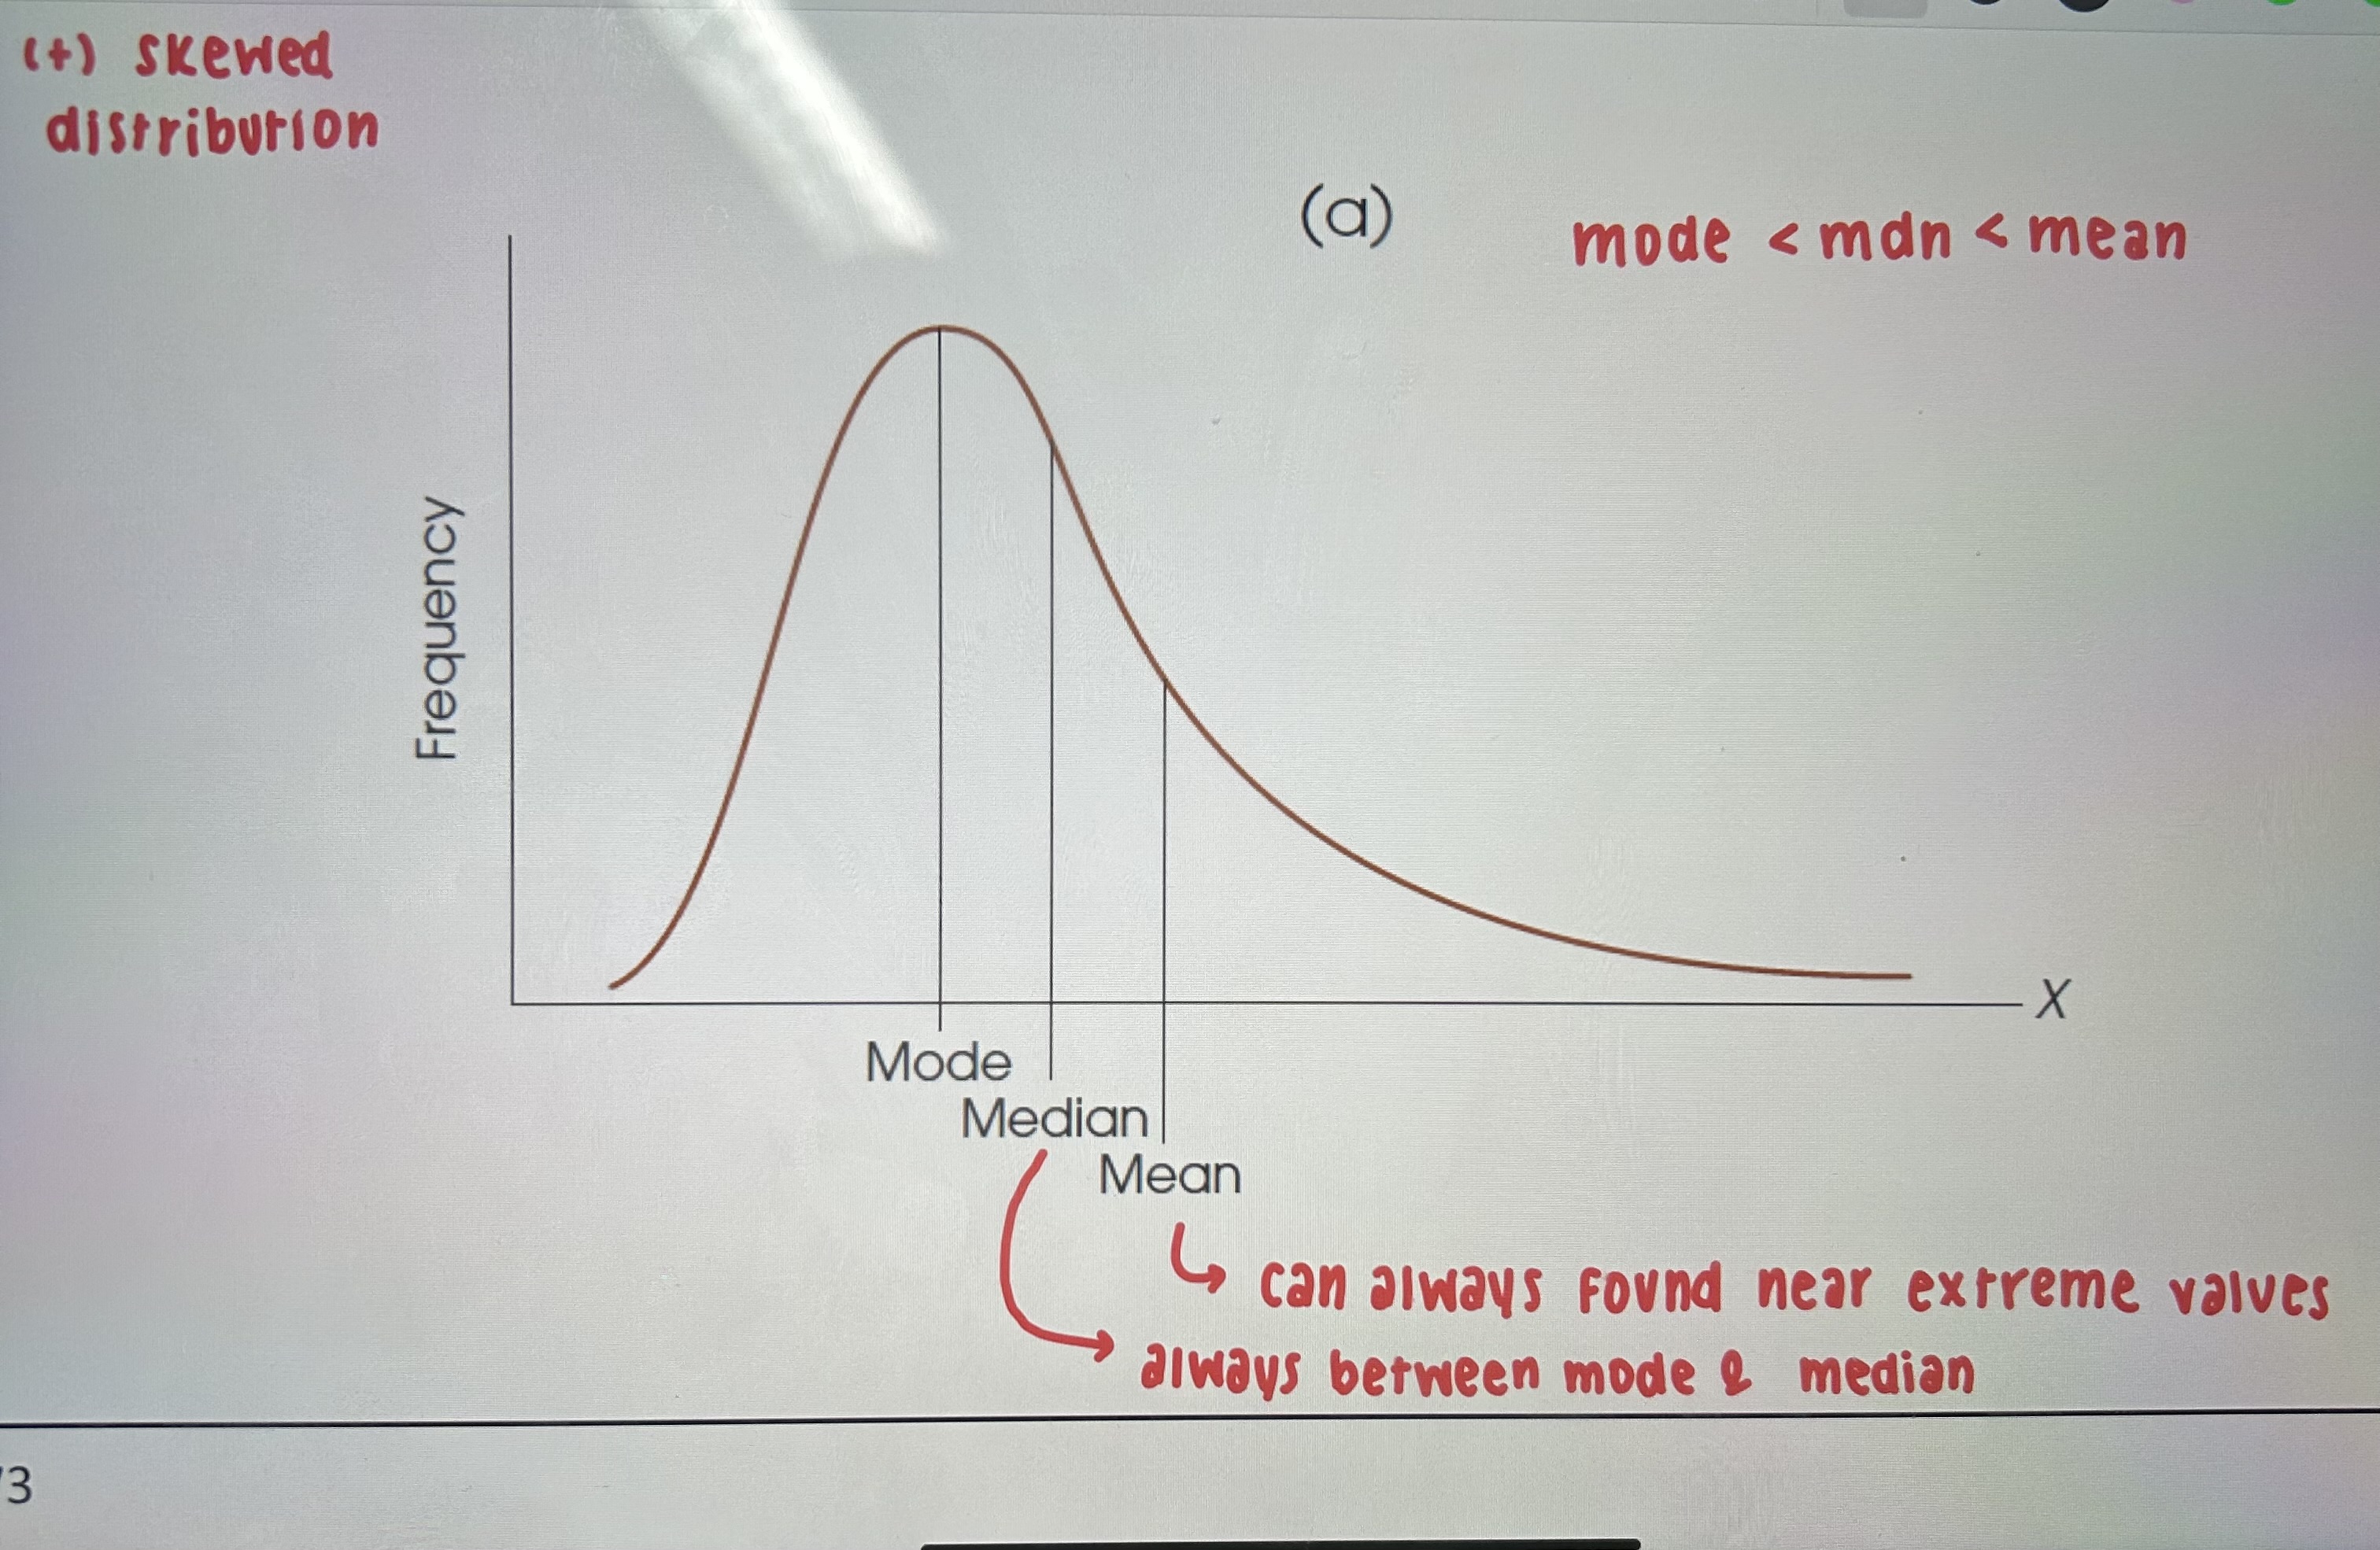
Positive skewed
mode<mdn<mean
Negative skewed distribution
mean<median<mode

pros n cons mean
+ best for symmetrical data
+best for large datasets
-easily thrown off by outliers
pros n cons median
+best for asymmetrical data
+easy to find
-not useful for qualitative data
pros n cons Mode
+best for qualitative data
+easy to find
-multiple modes
Variability (or dispersion)
extent data points in dataset differ from each other and from the central tendency
Measured spread or distribution of data values
higher variability indicates a __ spread of data
higher variability indicates a wide spread of data
lower variability data points are more ___ around the mean
values in dataset more consistent
lower variability data points are more clustered around the mean
range
Diff btwn max and min values
max values - min value
Susceptible to outliers
interquartile range (IQR)
Spread of the middle 50% of data
calculated as
IQR= Q3-Q1
Q3-75th percentile
Q1-25th percentile
Variance (o² or s²)
Average of the squared differences from the mean
deviation calculation
Xi-X(sum) = Xi - M
Standard deviation
Square root of variance giving a measure of spread in the same units as the data
Unimodel symmetric distribution following holds
68% distribution lie within one standard deviation of mean
95% distribution lie within two standard deviation of mean
99.7% lies within three standard deviation of the mean
coefficient of variation (CV)
Alternate way to measure variation
VC expressed the standard deviation as a
expressed standard deviation as percentage or ratio of the mean
The higher the CV greater variability about the mean
The lower the CV more consistent individuals are about the mean
Modal class
Class with largest frequencies