Lecture 18 - Age Structured Populations And Life History
1/29
There's no tags or description
Looks like no tags are added yet.
Name | Mastery | Learn | Test | Matching | Spaced |
|---|
No study sessions yet.
30 Terms
3 Ways to make populations more realistic
Different forms of density dependence (Ex. allee effects)
Time Lags
Species interactions (predators, mutualists, competitors, etc)
What might cause a population not grow when its small?
Allee Effects
Define: Allee Effects
Negative effects caused by a loss of social benefits that happen when the population is too small (low density)
Ex. Not finding a mate, no group defense, etc
What Type Of Organisms Are Most Effected By Allee Effects?
Species that need to live in groups
What Is A Lower Limit?
If the population falls below this point it can’t bounce back if it gets too small.
True Or False; Populations Can’t Fluctuate Between K and The Lower Limit
False, It can
True Or False: Exponential & Logistic Models Treat All Individuals In A Population The Same
True
True Or False: Fecundity & Survivorship Doesn’t Depend On Age
False, it does
What does it mean that fecundity (birth rates) and survivorship vary among species?
Different species have different patterns of survival and reproduction at different ages. These patterns are called life history strategies.
What is a life history strategy?
It’s a species’ pattern of lifespan, reproduction, and number of offspring.
Describe The Typical Life History Periods (3 steps)
Start life @ a small size
Grow for some time without reproducing
Reproduce once you have enough resources
3 Reasons why is it important to consider age structure of populations?
Evolution of life histories
Conservation of populations
Understanding the changing structure of human populations (human demography)
What Is A Life Table?
Data that summarizes the life events that are statistically expected for the average individual of a specified age in a population
Ex. Age of death, Age of reproduction, etc
What is X?
Age class
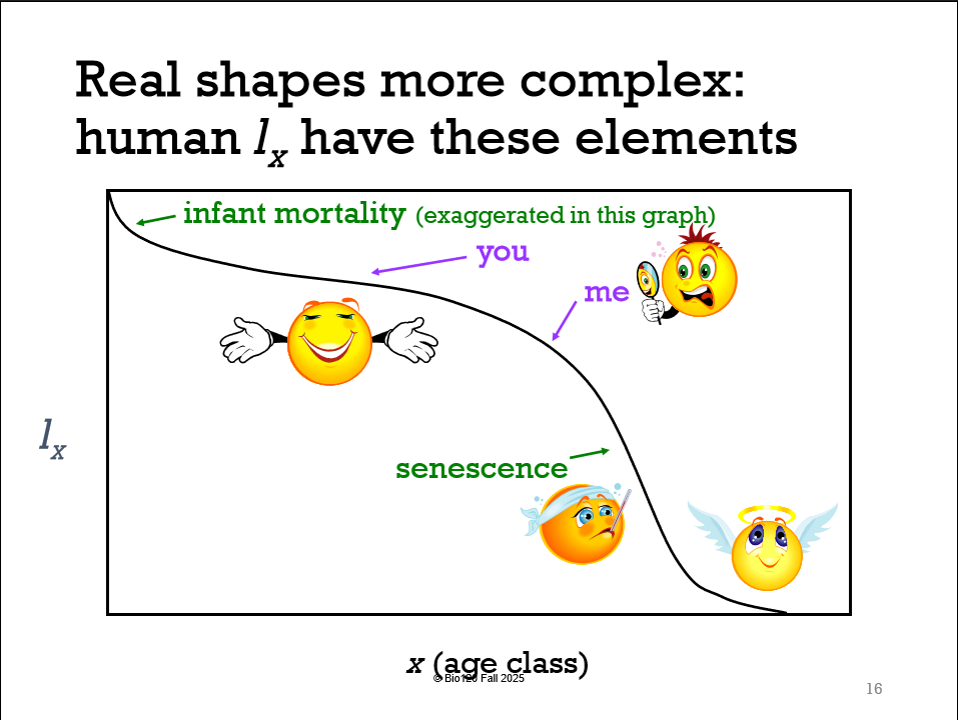
What is lx?
Probability of being alive @ age x
What is l₀
100% of newborns are alive at birth (1.0)
What Is A Survivorship Curve? (axis’)
a graph of lx Vs. x (prob of being alive Vs. Age class)
True Or False: lx increases with x
False lx declines with x
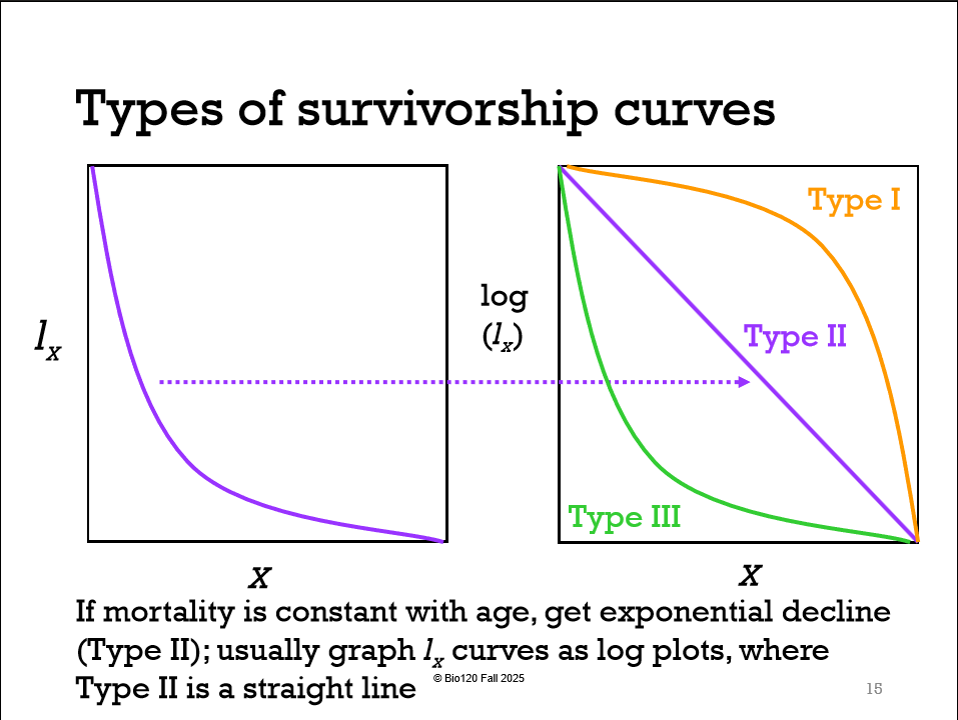
True Or False: The survivorship curve is different for each species
True, because different species have different rates and reproduction time
True Or False: lx Vs. x decreases as u get old
True
What is mx?
Number of daughters born to a female @ the age of x
Define: Fecundity-survivorship trade off
Cost of reproduction

What is R0 & The Net Reproductive Equation
Average # of women who have daughters in their life time/ net reproductive rate
Equation
mx= # of total daughters
lx = mortality rate of mothers
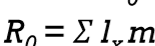
Explain the Net reproductive rate equation
mx= # of total daughters
lx = mortality rate of mothers
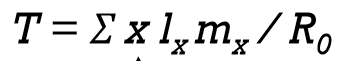
What Is T?
Generation time=Average age of mothers when they have babies
(tells you how long it takes to reproduce)
How do you calculate T?
If high growth rates mean high fitness, why aren’t all organisms short-lived and fast-reproducing?
Constraints and trade offs: because reproduction is costly and there are trade-offs. Organisms need time to gather resources before they can reproduce.
What are age-class intervals?
Time groups that divide a population by age (so we can study survival and reproduction).
Why do biologists use age classes?
They make life tables, survivorship curves, and fecundity schedules easier to calculate.
How do age-class intervals differ for microbes, insects, mammals and humans?
Microbes: minutes–hours
Insects: weeks
Mammals/birds: years
Humans: 5-year intervals