PP 16: Paleolimnology
1/37
There's no tags or description
Looks like no tags are added yet.
Name | Mastery | Learn | Test | Matching | Spaced |
|---|
No study sessions yet.
38 Terms
Paleolimnology is an inter-disciplinary science
The study of water life and sediments from preexisting geological time periods
Uses physical, chemical, and biological information stored in lake sediments
Long-term data are essential for understanding environmental and ecological problems
Lakes as reservoirs of history
-Study of lake sediments
-Implications: compares historic conditions with more modern changes
-Study of the impacts of:
Local pollution
Worldwide pollution
Why are lake sediments important?
-Preserve information about lake history, specifically:
Land-use changes in watershed
Ecological changes in lake and watershed
Sedimentary history of lakes
Provides additional understanding of how lakes work
Contributes information on the geological and biological history of the watershed region: sedimentary cores provide a continuous archive of environmental information
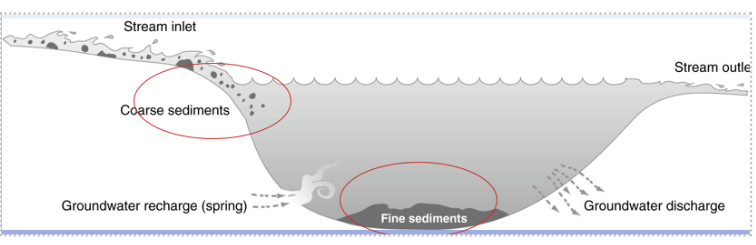
Basic dynamics of sedimentation
-As material reaches the lake from the watershed
Coarse material is deposited near shore
Fine material reaches pelagic region, joined by planktonic organic matter
Sedimentation rates vary withing a few to several mm per year
Sediment traps
Cores
ADD
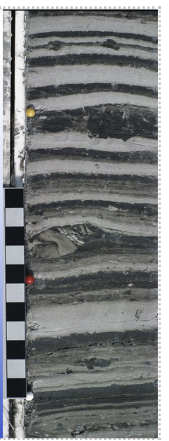
From yearly cycles of deposition of varying composition (e.g. ”varves” in calcareous sediments- altering light and dark bands)
pic
add
Sediment chronology
-Fundamental to paleolimnology
Determine rates of processes/fluxes
Link disturbance to sediment archive
Determine synchronicity of events
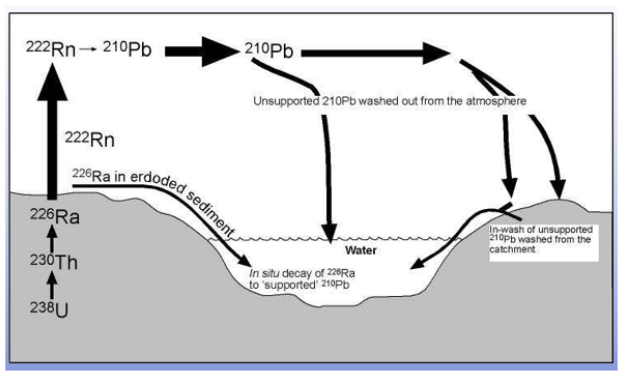
-210 Pb
-14 C
-Extrapolate 210 Pb dates, use 14C to constrain oldest core dates
-ADD
Watershed development
pic
Paleolimnology techniques: list
1. pollen analysis of lake sediments
2. Algae: diatoms, some greens, chrysophytes, dinoflagellates, bluegreen heterocysts
3. Macro Fossils
4. 14C dating
5. Zooplankton fossils
6. Known atomic events (bombs and accidents)
7. Geologic
8. 210Pb dating
9. Chlorophyll and carotenoid degradation products
10. Varves
11. Inorganic chemistry
12. Previous lake levels, wave cut terrace
13. Organic content
Paleolimnology techniques: 1. pollen analysis of lake sediments
-ADD about picture
-Most useful is Ambrosia pollen (ragweed), associated with clearing and cultivation
Non-natice species that began to flourish after the settlement of N. America
-Combination of 14C dating and Ambrosia pollen aids both chronology and sedimentation estimates
-Range of error can be extreme. Some pollens preverse really well, and others don’t. Presnece or absence of a particular pollen doesn't tell the full story because not everything is equal. Same for the algae
Paleolimnology techniques: 2. Algae: diatoms, some greens, chrysophytes, dinoflagellates, bluegreen heterocysts
pic
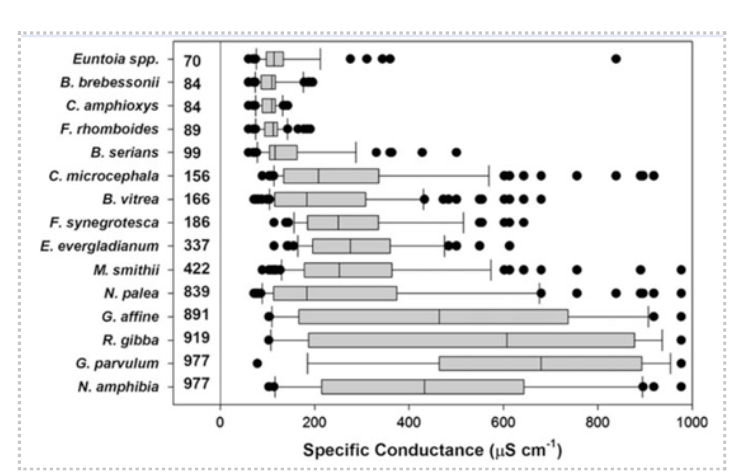
Paleolimnology techniques: 2. Algae: diatoms, some greens, chrysophytes, dinoflagellates, bluegreen heterocysts cont.
-Diatoms:
Indicators of fertility, water temperature, eutrophication
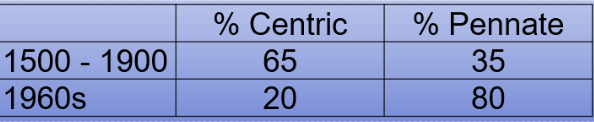
Most often used is the ratio of centrics to pennates
High= oligotrophy
Low= eutrophic
eg pic. lake washington sediment core
Ratio gives you a better idea, because species can not be there for any number of reasons
-Diatoms as indicators of environmental change
Well preserved in lake sediments
Remain stable in sedimentary sequences
Once they’re down, they stay pretty put
Taxonomically specific ornamentation
Unique shell
Many have narrow optima and tolerances
Allows you to assign them to presence or absence of conditions
Respond rapidly to environmental change
the best for this method
super specific to what species is there with conductivity. If you have presence and then suddenly have absence, you know that something probably happened with conductivity.
Paleolimnology techniques: 2. Algae: diatoms, some greens, chrysophytes, dinoflagellates, bluegreen heterocysts cont.
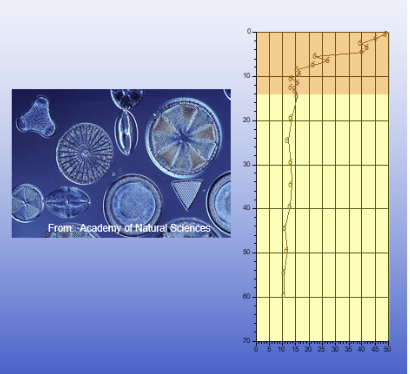
-Biogenic silica
Diatoms, chrysophytes
Indicator of diatom biomass
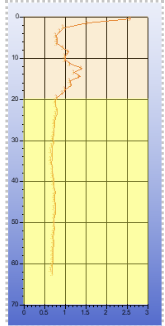
-Top layer of sediments- After
Diatoms deposited in recent sediments
Open water (planktonic) diatoms abundant
-Bottom- before (in reference to the diagram below)
Diatoms deposited in pre-1850 sediments
Shallow water (benthic) diatoms abundant
Paleolimnology techniques: 3. macro fossils
fish, vertebrae and scales, wood fragments
Many groups have some identifiable remains
Paleolimnology techniques: 4. 14C dating
-Indicates age of sediments and organic fragments
to do 14C, you must have organic debris
-Also other isotopes
-natural abundance of stable carbon isotopes
12C 98.9%
13C 1.1%
-Amount of fractionation based on:
Photosynthetic pathway
Carbon availability
-Stable isotopes
Are naturally occurring
Do not radioactively decay
Reported using the ‘d notion’ (delta notion)
-delta ‰= [(R sample/R standard) - 1] x 1000, where ‘R’ is the ratio of heavy to light isotopes (e.g. 13C/12C) heavier isotope goes on top
![<p class="Paragraph SCXW74093132 BCX0" style="text-align: left;"><span style="line-height: 20.925px;"><span>-Indicates age of sediments and organic fragments </span></span></p><ul><li><p class="Paragraph SCXW74093132 BCX0" style="text-align: left;"><span style="line-height: 20.925px;"><span>to do </span><sup><span>14</span></sup><span>C, you must have organic debris </span></span></p></li></ul><p class="Paragraph SCXW74093132 BCX0" style="text-align: left;"><span style="line-height: 20.925px;"><span>-Also other isotopes </span></span></p><p class="Paragraph SCXW74093132 BCX0" style="text-align: left;"><span style="line-height: 20.925px;"><span>-natural abundance of stable carbon isotopes </span></span></p><ul><li><p class="Paragraph SCXW74093132 BCX0" style="text-align: left;"><span style="line-height: 20.925px;"><sup><span>12</span></sup><span>C 98.9% </span></span></p></li></ul><ul><li><p class="Paragraph SCXW74093132 BCX0" style="text-align: left;"><span style="line-height: 20.925px;"><sup><span>13</span></sup><span>C 1.1% </span></span></p></li></ul><p class="Paragraph SCXW74093132 BCX0" style="text-align: left;"><span style="line-height: 20.925px;"><span>-Amount of fractionation based on: </span></span></p><ul><li><p class="Paragraph SCXW74093132 BCX0" style="text-align: left;"><span style="line-height: 20.925px;"><span>Photosynthetic pathway </span></span></p></li></ul><ul><li><p class="Paragraph SCXW74093132 BCX0" style="text-align: left;"><span style="line-height: 20.925px;"><span>Carbon availability </span></span></p></li></ul><p class="Paragraph SCXW74093132 BCX0" style="text-align: left;"><span style="line-height: 20.925px;"><span>-Stable isotopes </span></span></p><ul><li><p class="Paragraph SCXW74093132 BCX0" style="text-align: left;"><span style="line-height: 20.925px;"><span>Are naturally occurring </span></span></p></li></ul><ul><li><p class="Paragraph SCXW74093132 BCX0" style="text-align: left;"><span style="line-height: 20.925px;"><span>Do not radioactively decay </span></span></p></li></ul><ul><li><p class="Paragraph SCXW74093132 BCX0" style="text-align: left;"><span style="line-height: 20.925px;"><span>Reported using the </span></span><span style="line-height: 22.0875px; color: windowtext;"><span>‘d notion’ (delta notion) </span></span></p></li></ul><p class="Paragraph SCXW74093132 BCX0" style="text-align: left;"><span style="line-height: 22.0875px; color: windowtext;"><span>-delta ‰= [(R sample/R standard) - 1] x 1000, where ‘R’ is the ratio of heavy to light isotopes (e.g. </span><sup><span>13</span></sup><span>C/</span><sup><span>12</span></sup><span>C) heavier isotope goes on top </span></span></p><p></p>](https://knowt-user-attachments.s3.amazonaws.com/32749cee-b75b-4b3a-be1c-cbcfd163fbac.png)
Paleolimnology techniques: 4. 14C dating
-Stable Carbon isotopes and productivity change
high productivity
less available DIC
Less fractionation
Algae/OM less negative
Low productivity
More available DIC
More fractionation
Algae/OM more negative
-ADD about pic

Paleolimnology techniques: 5. Zooplankton fossils
-Zooplankton are useful, esp. Cladocerans, midges, ostracods; also rhizopods (protists), but they’re really small so they’re not as useful as diatoms
-Cladoceran mouth parts, abdominal claws
Very specialized, have to be able to identify by just a mouthpiece
Indication of community structure
Ex. Size regulation of Mysis stomach contents
-Chironomids as indicators of environmental change
Blood worms
Hypolimnetic oxygen
Some species can upregulate their hemoglobin, so if you have a lot of those you know it was an oxygen poor system
Climate
Salinity
Lake productivity
-Chaoborus as indicators of environmental change
Chaborus americanus- presence of this taxon is a good indication of fishless conditions
-Best work has involved species diversity of chydorid cladocerans as a function of lake productivity
-Resurrection ecology
Hatch the eggs that were really old, look at the DNA and who’s coming out of the sediment
-Cladocerans used to track:
Climatic changes
Trophic oscillations
Acidification
Water-level changes
-Ostracodes as indicators of environmental change
Nutrient status
Salinity
Temperature
Chemical composition of their host water
Trace element (especially Mg and Sr) content and stable isotope ratios of their shells reflect
Water temperature
Water chemistry
Productivity
Paleolimnology techniques:6. Known atomic events (bombs and accidents)
Increase in radioactive isotopes
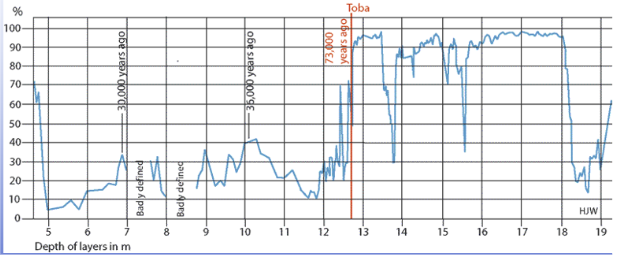
Paleolimnology techniques: 7. geologic events
Dating of core sections
Ex. Dating of Katmi and St. Helens eruption
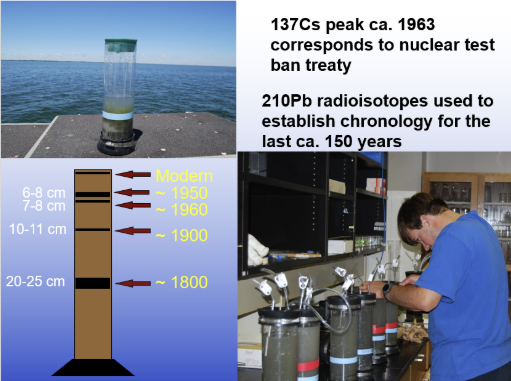
Paleolimnology techniques: 8. 210Pb dating
From earliest human use to tetra-ethyl-lead gasoline additives
Paleolimnology techniques: 8. 210Pb dating cont
! wont test on this specifically
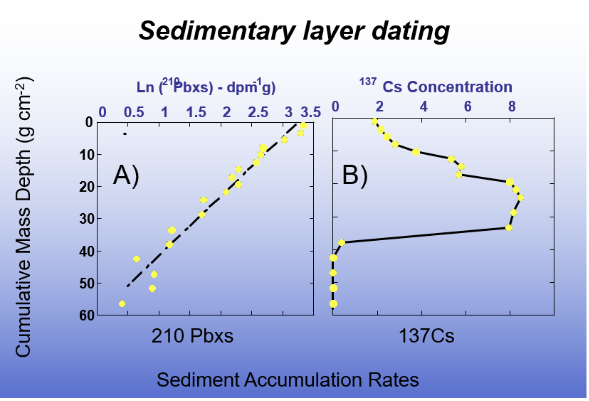
Paleolimnology techniques: 8. 210Pb dating cont
-pic
Paleolimnology techniques: 9. Chlorophyll and carotenoid degradation products
Pigments are community indicators
Chlorophyll has been found in samples as old as 11,000 years
Chlorophyll and phosphorous both can indicate nutrient loading
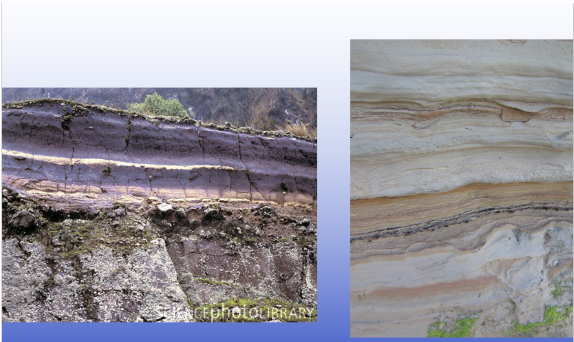
Paleolimnology techniques: 10. Varves
-Alternating light and dark layers corresponding to a year
Dark= reducing conditions, indicates oxygen, oxygen has been given up
Light= spring inflows, more oxygen coming in
-Indicators of annual deposition
Paleopigments
-Indicative of
Total algal abundance
Specific algal types
Paleoproductivity

Phosphorus
-Increases due to
Cultural inputs
Upward migration in the core
Biological uptake
Paleolimnology techniques: 11. Inorganic chemistry
Ex. Greenland ice studies
Paleolimnology techniques: 12. Previous lake levels, wave cut terrace
Ex. Lake Tahoe has a 100m high terrace and also dramatically lower lake levels
Paleolimnology techniques: 13. Organic content
peat layers
Things to know for the test
Coring
Porosity
Chlorophyll
Organic matter
Percent CaCO3
Sedimentation
Phosphours
Diatoms
dating
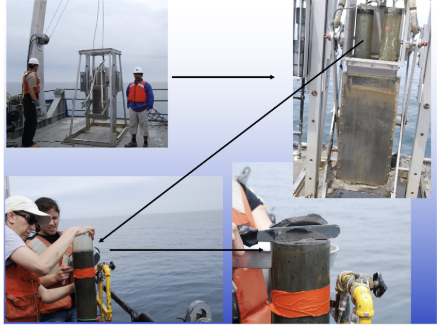
Principal methodology
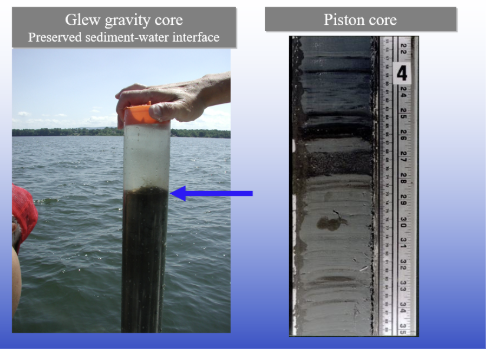
-The core sample is the traditional and still primary technique for obtaining a vertical profile of sediment
Used to use metal, but now we have strong plastics that we can use
for very long cores, a piston apparatus helps pull sediment into corer; also, a freefall mechanism may be employed to maximize depth penetration
a full liner is removed to lab, frozen if appropriate
in lab, core is extruded or liner is slices lengthwise, can also be done on site
Sediment profile is excised and analyzed in appropriate increments
Figure out the sedimentation in your lake roughly and then you can see how big/small you need to cut your core
Core sediment analyses: Inorganic matter
-1. inorganic matter
A. Reflects the chronology of mineral leaching rates from the watershed; conservative minerals are the primary focus
CaCO3 is commonly used
bands of unusual minerals are markers of known geological events, esp. Volcanic eruptions and impacts producing episodes of atmospheric fallout and deposition
B. radioistope dating provides time sequence with sediment depth
for >150 years: 14C
for <150 years: 210Pb
Core sediment analyses: organic compounds
-2. Organic compounds
A. especially important for 14C dating
B. Amino acids, carbohydrates and pigments generally greatest near sediment surface were they are being deposited
C. reflect general quantity of biotic productivity; but difficult to distinguish terrestrial from aquatic; most biopolymers are not stable
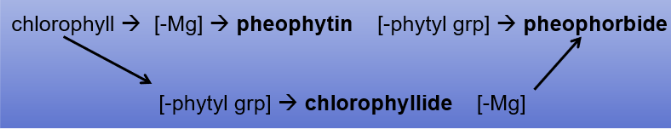
D. chlorophyll derivative pigments
Don't have to know the equation
These pigments can be quantified photometrically by their unique absorption spectra, and by gas/liquid chromatography
other pigments can be informative, e.g. myxoxanthin, a bluegreen carotenoid, can indicate eutrophic conditions (at time of deposition)
Commonly, lakes in post-glacial period show early increase in mineral deposition and biotic productivity (as pigments), followed by lower stable rates, and finally recent eutrophication
In marl lake cores, Wetzel showed an inverse correlation of productivity and extreme calcareous conditions
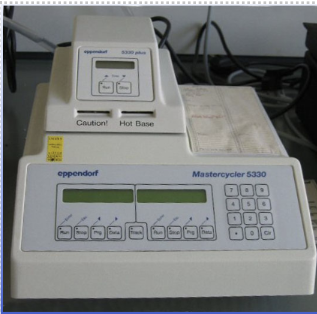
Ancient DNA
PCR can now amplify traces of DNA to identify species in sediments
Pic
pic
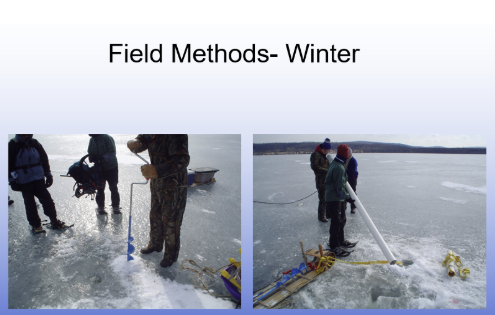
Field methods- winter
pic
Different cores
pic
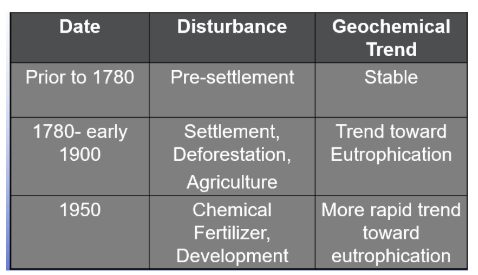
Some important lake management questions
What is the “natural" or baseline condition of the lake?
Has the water quality changes since pre-development (or pre-industrial) times? if so, when did these changes occur?
What is the direction and magnitude of this change?
What are the possible reasons for this change?