HL Bio C1 Free Response
5.0(2)
Studied by 64 peopleCard Sorting
1/19
Earn XP
Description and Tags
Last updated 4:52 AM on 3/9/23
Name | Mastery | Learn | Test | Matching | Spaced | Call with Kai | Chat |
|---|
No analytics yet
Send a link to your students to track their progress
20 Terms
1
New cards
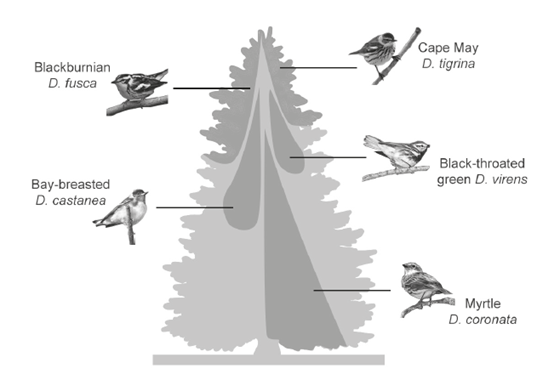
Ecologists studied the distribution of five species of insectivorous wood warblers of the genus *Dendorica* living on different parts of coniferous trees in mature forests.
\
1a (1 mark): Distinguish between the distribution of *D. tigrina* and that of *D. coronata*.
\
1a (1 mark): Distinguish between the distribution of *D. tigrina* and that of *D. coronata*.
*D. tigrina* lives higher in the tree than *D. coronata*
*D. coronata* occupies a greater area/height range than *D. tigrina*
*D. tigrina* found in the outer regions and *D. coronata* found on the inside
*D. coronata* occupies a greater area/height range than *D. tigrina*
*D. tigrina* found in the outer regions and *D. coronata* found on the inside
2
New cards

Ecologists studied the distribution of five species of insectivorous wood warblers of the genus *Dendorica* living on different parts of coniferous trees in mature forests.
\
1b (2 marks): Outline the principle of competitive exclusion.
\
1b (2 marks): Outline the principle of competitive exclusion.
a. no two species can occupy the same niche
b. competition between them would cause one species to drive the other out \n *OR* \n one of the two species would need to adapt and evolve accordingly
b. competition between them would cause one species to drive the other out \n *OR* \n one of the two species would need to adapt and evolve accordingly
3
New cards

Ecologists studied the distribution of five species of insectivorous wood warblers of the genus *Dendorica* living on different parts of coniferous trees in mature forests.
\
1c (2 marks): Other than position in the tree, suggest *two* ways in which the niches of the warblers in the ecosystem may differ.
\
1c (2 marks): Other than position in the tree, suggest *two* ways in which the niches of the warblers in the ecosystem may differ.
a. different food/prey
b. different predators
c. active at different times of the day
d. present at different times of the year
e. different nest sites
f. different temperatures
b. different predators
c. active at different times of the day
d. present at different times of the year
e. different nest sites
f. different temperatures
4
New cards

Ecologists studied the distribution of five species of insectivorous wood warblers of the genus *Dendorica* living on different parts of coniferous trees in mature forests.
\
1d (2 marks): The diagram shows the realized niches of the five species of warbler. Suggest how the fundamental niche of *D. castanea* might differ from its realized niche.
\
1d (2 marks): The diagram shows the realized niches of the five species of warbler. Suggest how the fundamental niche of *D. castanea* might differ from its realized niche.
a. the realized is the actual niche and the fundamental is in the absence of competition
b. with no competition the *D. castanea* would have a larger habitat/more food \n *OR* \n *D.castanea* could occupy the niches currently occupied by the other warbler species
b. with no competition the *D. castanea* would have a larger habitat/more food \n *OR* \n *D.castanea* could occupy the niches currently occupied by the other warbler species
5
New cards
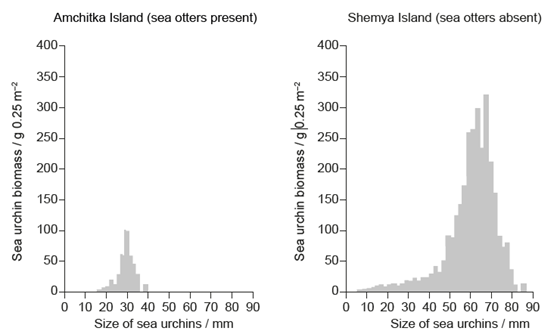
Sea urchins (*Strongylocentrotus*) are echinoderms that consume large quantities of algae. Sea otters (*Enhydra lutris*) feed on sea urchins.
The graphs show the biomass of sea urchins in an area of 0.25 m2 plotted against their size. Data were collected in two Aleutian Islands, Amchitka and Shemya. In Amchitka the sea otter population is high while at Shemya there are no sea otters.
\
2a (2 marks): Outline a method that could have been used in this study to measure the numbers of sea urchins per 0.25 m2.
a. with quadrats (of 0.5 m side / 0.25m2)
b. (quadrats) position determined at fixed distance by transects \n *OR* \n (quadrats) position determined at random
c. random sampling / capture-recapture
d. average number calculated
b. (quadrats) position determined at fixed distance by transects \n *OR* \n (quadrats) position determined at random
c. random sampling / capture-recapture
d. average number calculated
6
New cards

Sea urchins (*Strongylocentrotus*) are echinoderms that consume large quantities of algae. Sea otters (*Enhydra lutris*) feed on sea urchins.
The graphs show the biomass of sea urchins in an area of 0.25 m2 plotted against their size. Data were collected in two Aleutian Islands, Amchitka and Shemya. In Amchitka the sea otter population is high while at Shemya there are no sea otters.
\
2b (3 marks): Sea otters are considered keystone species in this environment. Suggest how the presence of sea otters could affect the algae population.
a. sea otters (feeding on sea urchins) limit sea urchin population
b. the largest sea urchins are eaten
c. shown by low biomass/small size (of sea urchins)
d. fewer/smaller sea urchins allow for increase in algae population
e. sea otters have a top down effect
b. the largest sea urchins are eaten
c. shown by low biomass/small size (of sea urchins)
d. fewer/smaller sea urchins allow for increase in algae population
e. sea otters have a top down effect
7
New cards

Sea urchins (*Strongylocentrotus*) are echinoderms that consume large quantities of algae. Sea otters (*Enhydra lutris*) feed on sea urchins.
The graphs show the biomass of sea urchins in an area of 0.25 m2 plotted against their size. Data were collected in two Aleutian Islands, Amchitka and Shemya. In Amchitka the sea otter population is high while at Shemya there are no sea otters.
\
2c (1 mark): Sea urchins are destroying the giant kelp alga (*Macrocystis pyrifera*) marine forests of South East Australia. Suggest a reason that sea urchins might be an invasive species in this environment.
the sea urchins’ limiting factors in their original habitat are missing \n *OR* \n lack of (natural) predators for sea urchins
8
New cards
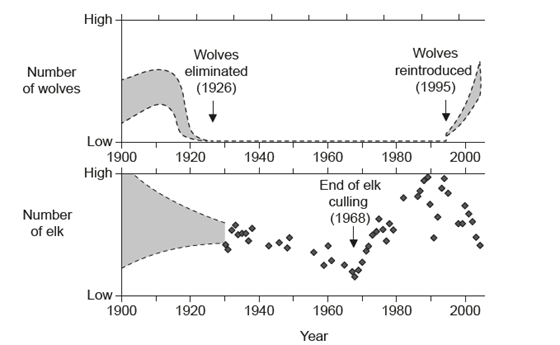
The elimination of wolves (*Canis lupus*) from Yellowstone National Park in 1926 and their reintroduction in 1995 provided the opportunity to examine ecological interactions with elk (*Cervus elaphus*). The National Park Service made efforts between the 1920s and 1968 to reduce the size of elk herds by culling (selective killing) because of concerns about overgrazing.
The graphs provide the trends for the numbers of wolves and elk in Yellowstone National Park from 1900 to 2004.
\
3a (3 marks): Outline the changes in elk population between the years 1930 and 2004.
The graphs provide the trends for the numbers of wolves and elk in Yellowstone National Park from 1900 to 2004.
\
3a (3 marks): Outline the changes in elk population between the years 1930 and 2004.
a. between 1930 and 1968 the numbers were reduced
b. after 1968/in the 1970s the numbers increased
c. in 1990s1995 the numbers decreased again
d. lowest in 1968 and highest in 1990
b. after 1968/in the 1970s the numbers increased
c. in 1990s1995 the numbers decreased again
d. lowest in 1968 and highest in 1990
9
New cards

The elimination of wolves (*Canis lupus*) from Yellowstone National Park in 1926 and their reintroduction in 1995 provided the opportunity to examine ecological interactions with elk (*Cervus elaphus*). The National Park Service made efforts between the 1920s and 1968 to reduce the size of elk herds by culling (selective killing) because of concerns about overgrazing.
The graphs provide the trends for the numbers of wolves and elk in Yellowstone National Park from 1900 to 2004.
\
3b (2 marks): List **two** biotic factors, other than wolf predation or culling, that could affect the elk population.
The graphs provide the trends for the numbers of wolves and elk in Yellowstone National Park from 1900 to 2004.
\
3b (2 marks): List **two** biotic factors, other than wolf predation or culling, that could affect the elk population.
a. relative rates of natality
b. disease/lack of food
c. competition for the same resources
d. immigration/emigration/migration
b. disease/lack of food
c. competition for the same resources
d. immigration/emigration/migration
10
New cards

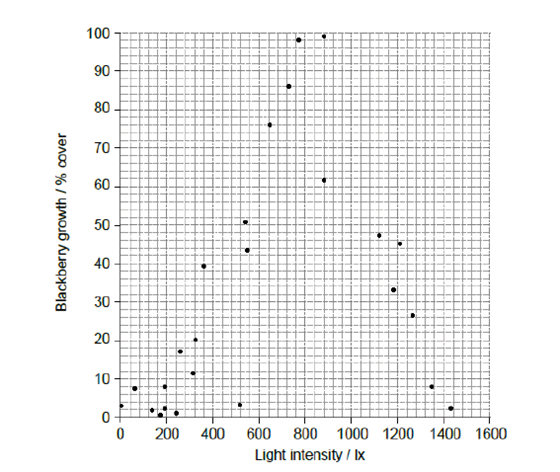
The blackberry (*Rubus fruticosus*) is a plant that grows in deciduous woodlands in many parts of the world. A 30 m transect was laid out in a woodland to investigate the relationship between light intensity and blackberry growth. The percentage cover of blackberries and the light intensity were measured at 26 positions along this transect.
\
4a (2 marks): Outline how these results indicate that blackberry distribution is limited by light intensity.
\
4a (2 marks): Outline how these results indicate that blackberry distribution is limited by light intensity.
a. as light level changes so does the percentage cover «of blackberry» ✔
b. distribution is higher at intermediate/moderate light intensities ✔ *Accept appropriate numerical values*
c. little growth at low light intensities \n OR \n little growth at high light intensities ✔ *Accept appropriate numerical values*
d. distribution is bell shaped ✔
b. distribution is higher at intermediate/moderate light intensities ✔ *Accept appropriate numerical values*
c. little growth at low light intensities \n OR \n little growth at high light intensities ✔ *Accept appropriate numerical values*
d. distribution is bell shaped ✔
11
New cards

The blackberry (*Rubus fruticosus*) is a plant that grows in deciduous woodlands in many parts of the world. A 30 m transect was laid out in a woodland to investigate the relationship between light intensity and blackberry growth. The percentage cover of blackberries and the light intensity were measured at 26 positions along this transect.
\
4b (1 mark): Distinguish between the transfer of matter and energy in closed ecosystems.
\
4b (1 mark): Distinguish between the transfer of matter and energy in closed ecosystems.
only energy can be lost/gained/exchanged/transferred «with the exterior» \n *OR* \n only matter is constant/recycled ✔
12
New cards
The blackberry (*Rubus fruticosus*) is a plant that grows in deciduous woodlands in many parts of the world. A 30 m transect was laid out in a woodland to investigate the relationship between light intensity and blackberry growth. The percentage cover of blackberries and the light intensity were measured at 26 positions along this transect.
\
4c (4 marks): A pyramid of energy represents the amount of energy taken in by each trophic level per unit time and per unit area. Discuss the advantages and disadvantages of the use of pyramids of energy as models of energy flow in an ecosystem.
\
4c (4 marks): A pyramid of energy represents the amount of energy taken in by each trophic level per unit time and per unit area. Discuss the advantages and disadvantages of the use of pyramids of energy as models of energy flow in an ecosystem.
*Advantages*: \n a. can show the energy loss/transfer between trophic levels ✔
b. permits a ‹quantitative› comparison between ecosystems ✔
c. shows change over time ✔
*Disadvantages*: \n d. are difficult to produce accurately ✔
e. require destructive methods to obtain the data ✔
f. do not show all the interactions/food chains/feeding relationships «between different members of the community» ✔
g. cannot represent organisms that feed at different trophic levels ✔
13
New cards
Reef-building corals are an association between two organisms: coral polyps and *Zooxanthellae*.
\
12a (1 mark): State the relationship between *Zooxanthellae* and coral reef species.
\
12a (1 mark): State the relationship between *Zooxanthellae* and coral reef species.
mutualism
14
New cards
12b (2 marks): Describe the exchange of materials between the coral’s polyps and *Zooxanthellae*.
a. polyp is a source of carbon dioxide for the *Zooxanthellae* \n *OR* \n polyp is a source of ammonia/nitrogen for the *Zooxanthellae*
b. *Zooxanthellae* provide oxygen to the polyp \n *OR* \n *Zooxanthellae* provide sugars/glucose/glycerol/lipids/amino acids to the polyp
b. *Zooxanthellae* provide oxygen to the polyp \n *OR* \n *Zooxanthellae* provide sugars/glucose/glycerol/lipids/amino acids to the polyp
15
New cards
12c (1 mark): State one limiting factor on *Zooxanthellae* which affects coral reef formation.
light / temperature / salinity / carbon dioxide / pH
16
New cards
Most reef-building corals contain photosynthetic algae, called *Zooxanthellae*, that live in their cells. Coral bleaching can occur as a result of human-induced changes leading to the *Zooxanthellae* being ejected from the coral.
\
14a (1 mark): State the type of interaction that occurs between *Zooxanthellae* and reef-building corals.
\
14a (1 mark): State the type of interaction that occurs between *Zooxanthellae* and reef-building corals.
mutualism
17
New cards
14b (1 mark): State the trophic level of *Zooxanthellae*.
producer/autotroph
18
New cards
14c (1 mark): When coral is bleached, certain organisms become more common in the ecosystem such as the cnidarian *Gorgonia*, the echinoderm *Diadema*, other algae and certain sponges. State the term that is used for organisms whose presence provides evidence of the existence of a particular environmental condition.
indicator species
19
New cards
14d (2 marks): A coat of algae builds up on coral reefs as a consequence of eutrophication. Explain the relationship between eutrophication and algal growth.
a. eutrophication is nutrient enrichment of a body of water
b. example of nutrients *eg*: *nitrates*
c. «nutrients» serve as fertilizer for the algae «promoting growth»
b. example of nutrients *eg*: *nitrates*
c. «nutrients» serve as fertilizer for the algae «promoting growth»
20
New cards
14e (2 marks): Explain how an excessive growth of algae on coral reefs can be controlled by top-down factors.
a. top-down factors refer to predation/herbivory/trophic level above another one \n b. which limit/control population growth
c. named example of a top-down predator *eg*: *parrotfish. Do not accept general names, like “fish”*.
c. named example of a top-down predator *eg*: *parrotfish. Do not accept general names, like “fish”*.