9.1 - linear motion
1/23
Earn XP
Description and Tags
Name | Mastery | Learn | Test | Matching | Spaced | Call with Kai |
|---|
No analytics yet
Send a link to your students to track their progress
24 Terms
linear motion
movement of a body in a straight or curved line, where all parts move the same distance, in the same direction over the same time
example of linear motion
a water skier on a flat lake being pulled at a constant speed will travel in linear motion as all parts of their body will travel the same direction over the same distance per unit of time
How is linear motion created
direct force being applied directly to the body’s centre of mass
direct force
a force applied through centre of mass resulting in linear motion
centre of mass
the point at which the body is balanced in all directions
it is the point at which weight appears to act
5 linear motion descriptors
distance
displacement
speed
velocity
acceleration/ deceleration
distance
the total length covered from start to finish
metres → m
e.g
distance covered in an 100m sprint is 100m
displacement
the shortest straight line route between the start and finish
e.g
the displacement of an 100m sprint is 100m
2 lengths of a swimming pool displacement is 0m as start and finish in the same place
speed
the rate if change in distance
m/s → metres per second
calculated using:
speed = distance / time
velocity
the rate of change in displacement
m/s → metres per second
calculated using:
velocity = displacement / time taken
acceleration / deceleration
rate of change in velocity
m/s/s → metres per second squared
acceleration = (final vel - initial vel)/ time taken
pos = acceleration
negative = deceleration
linear motion graphs
distance/ time
speed/time
velocity/time
distance time graph
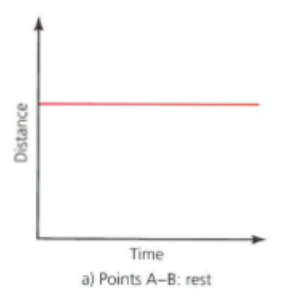
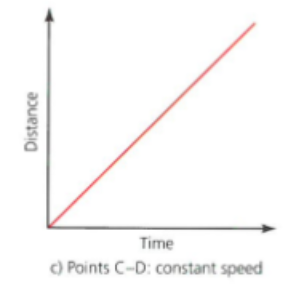
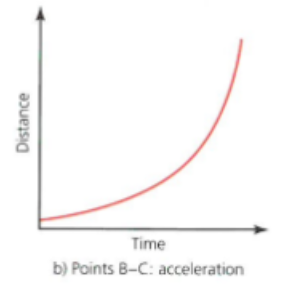
a visual representation of distance travelled plotted against time taken
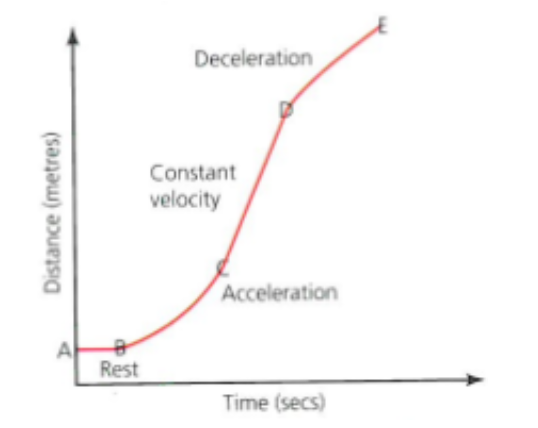
distance time graph: Rest
distance time graph: constant speed
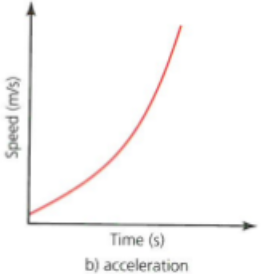
distance time graph: acceleration
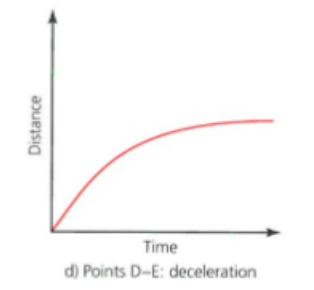
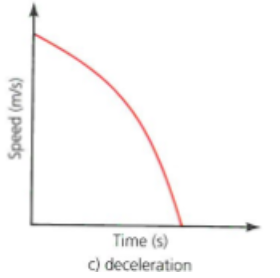
distance time graph: deceleration
speed / time graph
a visual representation of the speed of motion plotted against the time taken
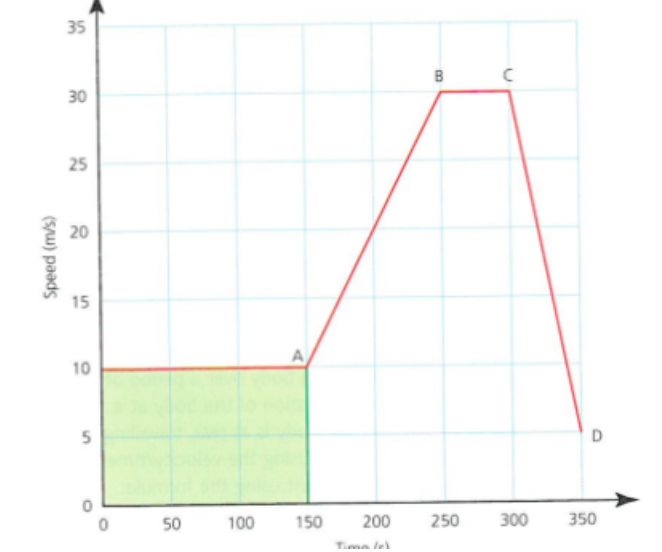
gradient = acceleration of a body
pos grad = acceleration
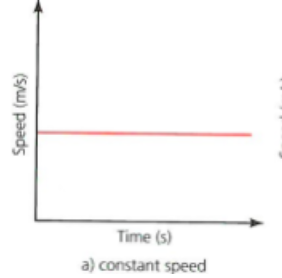
straight = constant speed
neg grad = deceleration
area underneath = distance travelled
speed / time graph : constant speed
speed / time graph : acceleration
speed / time graph : deceleration
velocity/ time graph
a visual representation of the velocity of motion plotted against the time taken
gradient = acceleration of a body at rest or travelling at a constant velocity
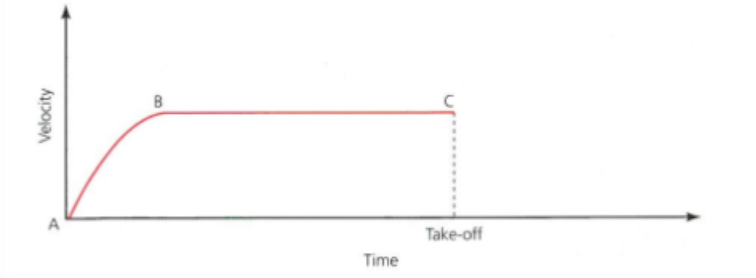
explain the graph - somersault
A
X axis = 0
Rest or stationary position
A-B
Upward curve shows an increase in velocity
Acceleration
B-C
No change in velocity per unit of time
Uniform velocity = velocity is constant at this point
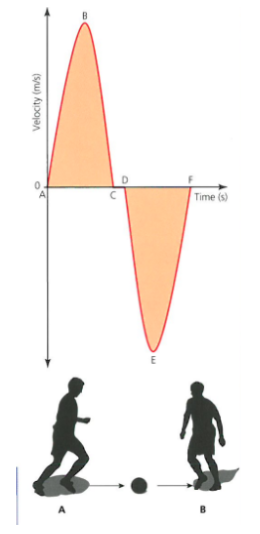
explain the graph - passing between the two players
A-B
Acceleration
Player A applies a force to accelerate the ball towards player B
B-C
Deceleration
Player b cushions the ball to decelerate it to a resting position at C
C-D
Rest
Player b controls the ball and prepares to return the pass
D-E
Acceleration followed by deceleration in the opposite direction
Player b applies the force to the ball, accelerating it back to player A ,who cushions the ball so decelerating it to rest