lab practical 2 pt 4 (hardy-weinberg + population growth + estimating populations)
1/19
There's no tags or description
Looks like no tags are added yet.
Name | Mastery | Learn | Test | Matching | Spaced |
|---|
No study sessions yet.
20 Terms
hardy-weinberg principle
frequencies of alleles and genotypes in a population remain constant from generation to generation
true or false?
in a given population where gametes contribute to the next generation randomly, allele frequencies will not change
true
mendelian inheritance
preserves genetic variation in a population
what formula accurately exemplifies this?
“the frequency of all alleles in a population will add up to 1”
p + q = 1
dominant
TT or Tt
recessive
tt
hardy-weinberg equilibrium
constant frequency of alleles in a gene pool
what formula accurately exemplifies this?
“p2 and q2 represent the frequencies of the homozygous genotypes and 2pq represents the frequency of the heterozygous genotype.”
p2 + 2pq + q2 = 1
true or false?
“a dominant phenotype can disappear from a population in a single generation, but a recessive phenotype cannot — even if the allele frequencies are the same.”
true
why is this statement true?
“a dominant phenotype can disappear from a population in a single generation, but a recessive phenotype cannot — even if the allele frequencies are the same.”
dominant alleles and recessive alleles behave differently in terms of visibility to selection
→ dominant alleles are always visible to selection
→ recessive alleles can “hide” in heterozygotes, protected from selection
how would you solve this in order?
“the ability to taste PTC is dominant (TT or Tt) and the inability to taste it is recessive (tt). if the frequency of non-tasting allele is 50%, what is the frequency of the tasting allele?”
1) t = q
→ non-tasting allele: q = 0.5
2) p + q = 1
→ plug in for q
→ p = 1 – (0.5)
3) p = 0.5
→ tasting allele: p = 0.5
how would you solve this in order?
“a population of 75% PTC tasters and 25% non-tasters. what is the percentage of TT and Tt?”
1) p + q = 1
2) tt = 25% → t = √q2
→ t = √0.25 → t = 0.5
3) T = p → p = 1 – q
→ p = 1 – 0.5 → p = 0.5
4) plug in for p and q → p2 + 2pq + q2 = 1
→ (0.5)2 + 2(0.5)(0.5) + (0.5)2 = 1 → 0.25 + 0.5 + 0.25 = 1
5) genotype = 25% TT : 50% Tt : 25% tt
phenotype = 75% tasters : 25% non-tasters

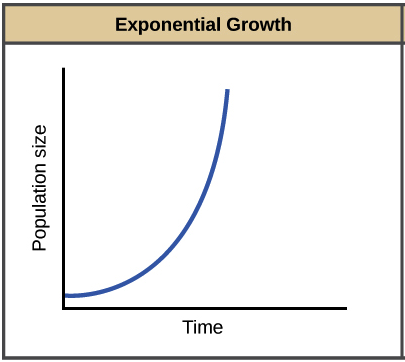
theoretical/exponential growth looks like a J-SHAPED graph. what causes this?
there are constant, ideal resources that allows the population to grow exponentially continuously

logistic/realized growth looks like an S-SHAPED graph. what causes this?
the resources are not constant (mates, food, changes in immigration/emigration patterns), which causes the population to reach a “carrying capacity,” meaning the environment cannot support an increase in population

what is the formula for exponential/theoretical growth?
(ΔN/Δt) = rN
→ (change in population size/time)
= reproductive potential*population size
what is the formula for logistic/realized growth?
(ΔN/Δt) = rN[K-N/K]
→ (change in population size/time)
= reproductive potential*population size[carrying capacity-population size/carrying capacity]
what are the 4 factors that can change population size?
1) birth rate
2) death rate
3) immigration
4) emigration
lincoln-peterson index
estimates the size of an animal population using the mark-recapture technique
→ this is ONLY for animals that move a lot in LARGE populations
→ not for sessile organisms like trees or polyps, or small populations
lincoln-peterson index formula
N = (M*S)/R
→ population size estimate
= (marked individuals released*size of second sample)/marked animals recaptured
how would you solve this in order?
“10 deer were captured, marked, and released. in the second sample, 20 deer were captured. of the second sample, 5 were marked. estimate the population size.”
1) lincoln-peterson index formula → N = (M*S)/R
2) plug in
→ N = (10×20)/5 → N = 200/5 → N = 40
the estimated size of the entire population of deer is 40 individuals